All published articles of this journal are available on ScienceDirect.

Refurbishment of Existing Building toward a Surplus Energy Building in Jordan
Authors Info & Affiliations
Abstract
Introduction:
Energy consumption rates in residential buildings rely heavily on the modularity of construction.
Methods:
Traditional building models in Jordan are considered the dominant models in which modern technology is not taken into account in building in order to reduce energy consumption. Recently, interest in modern construction schemes has appeared in Jordan with the intention of saving energy because of its high costs. The objective of this research is to help convert a building in Amman into one that generates more energy than it needs in what is known as surplus energy buildings.Several retrofit systems were considered for this purpose, including insulation, water heating, lighting, air recycling, and photovoltaic systems. This work was handled through a detailed calculation based on the basic fundamental of each subsystem used in the refurbishment process. using refurbishing techniques, the estimated payback period was found 5.08 years for all integrated systems.
Results:
The work started with a closer look at the reality of energy use in the residential sector based on the reports provided by the Ministry of Energy and the National Electricity and Energy Company.
Conclusion:
Afterward, the study sample was decided to be home in the city of Amman - Jordan, then several suggestions for improving and verifying ways to conserve energy were discussed.
1. INTRODUCTION
Energy use in residential buildings in Jordan is among the highest in the world, because the construction model in Jordan does not provide significant account of energy-saving technologies [1-5]. So there is an additional burden on Jordan in terms of energy. Jordan depends mainly on energy sources imported from neighboring countries at rates of up to 90% of its total requirements. As a result, work is starting to develop building codes to make buildings energy efficient and environmentally responsible in Jordan [6-10].
Jordan is one of the countries that is fortunate enough to have alternative energy sources, which are the hope for Jordan to reach some stability, the energy security for various needs. Solar energy in Jordan is the strongest candidate in various sectors in order to supply a large portion of the energy requirements. Jordan is one of the countries of the solar belt, with over 320 sunny days with very high levels of solar radiation up to 4-8 kWh/m2 [11-13]. The use of alternative sources is not limited to solar energy, as there are many promising alternative energy sources in Jordan. Among the most important of these sources is wind energy, important for its availability in Jordan at rates that are the best in the world [14-17].
Renewable energy systems are among the most important candidates to support the transformation of buildings into eco-friendly, energy-efficient and even productive buildings, and this is evident by using many renewable energy sources for a variety of purposes inside buildings, including heating water, generating electricity, using ground-base energy sources. It is very important to study renewable energy systems broadly and accurately to take advantage of them [18-23]. Many researchers who have investigated the potential of various renewable energy have emerged and confirmed the possibility of using them to generate energy in buildings completely and safely to achieve energy adequacy for a variety of purposes and uses within buildings [24-34].
Building technology has undergone many stages of development over time, so it has moved from simple traditional construction to the most developed building in order to rationalize energy consumption [35-41]. It was found that buildings are classified according to energy consumption in traditional buildings, low-energy buildings close to zero energy consumption, zero-energy buildings, and surplus energy buildings [42-44]. Several methods have been developed with the aim of rationalizing energy consumption of the buildings, such as wall insulation with different insulation patterns, the development of windows so that they become double-glazed, tripled-glass with different frame types and many others. The use of solar energy has emerged for various purposes, including the heating of water in houses through solar water heaters and the production of electric energy through the use of photovoltaic systems [45-50]. Indoor air recirculation techniques have also been developed [51-53]. The types of lighting used in buildings have also been developed, where numerous types of lighting have emerged, such as LED, fluorescent, compact fluorescent, and others [54-56]. Various computer programs have also been used to develop ways to rationalize energy consumption in buildings. For example, the lighting sensor system that works on sense movement and operate the lighting, and by the lack of movement the lighting is stopped and many other different energy saving systems [57-59].
Thermal insulation is a group of materials that, when lining the walls of buildings with them, help reduce the rate of heat flow [60-66]. There are a number of benefits to using insulating materials in buildings. Firstly, it helps to rationalize energy consumption. Secondly, the effect is to reduce carbon emissions and thus preserve the environment. Thirdly, its long-term use has an economic impact on reducing the value of energy cost [67, 68]. Ventilation systems are important systems in buildings because they help to create healthy and ideal conditions for life. Hence, the focus on recycling part of the energy-carrying air with fresh air coming from the outside is an important process so that the amount of energy that is required for various purposes in heating operations is reduced [69, 70].
The building's windows have many functions as they provide fresh air and natural light. Windows are the weakest thermal link in buildings because they are a major cause of energy loss. From here, interest in window insulation techniques has been emerged through the use of double and triple-glazed windows and the use of many types of frames with the aim of rationalizing energy consumption [71-74].
In this study, a residential house was redesigned in the city of Amman, the capital of Jordan, with the aim of making the house energy-efficient and self-sufficient by focusing on thermal insulation systems, solar water heating systems, the production of electrical energy through the use of photovoltaics, the replacement of traditional lighting with economical and environmentally friendly lighting, and the use of air circulation systems. It was found that the goal of the study can be achieved by being sufficient in energy and increasing its production through the use of these various systems.

2. MATERIALS AND METHODS
2.1. Building Description
Fig. (1) shows the selected building which is a residential building in Amman with a latitude of 32° north and a longitude of 35°. The floor area is about 300 m2. The building consists of three master rooms, kitchen, living room and the main room. The occupants of the building are assumed to be 6 persons. The design was based on precise data provided by the Jordanian ministry of energy and the meteorological department. With respect to data on water heating systems, it relied on the guidelines for the quantities of water consumed available in the officially approved Jordanian codes.
3. RESULTS AND DISCUSSION
To estimate the thermal insulation effect on the building energy load, the following design conditions are considered for both seasons, summer and winter, as shown in Table 1.
| Parameter | Summer | Winter |
|---|---|---|
| Outside temperature | 32° C | 5° C |
| Wet bulb temperature | 27° C | -2° C |
| Inside air room temperature | 24° C | 21° C |
| Relative Humidity | 47% | 50% |
| Average wind speed | 5 m/s | |
| U = 1/Rth | (1) |
Fig. (2) shows a cross-section of the existing wall with its component, thickness, and thermal resistance. The wall consists of four layers: stone, concrete, insulation, and cement plaster.
| Rwall = Ro + Rstone + Rconcrete + Rinsulation + Rcement plaster + Ri | (2) |
Substituting the parameter of the figure above in equation 2, the wall resistance and the overall heat coefficient will be:
Rwall = 0.03 + 0.055 + 0.056 + 0.110 + 0.017 + 0.12 = 0.338 m2. °C/W
| Uwall = 1/ Rwall = 2.577 W/m2. °C | (3) |
The heat transfers through building windows, doors, and interior walls were calculated using the same procedure and are given in 2.
| Section | Class type | U (W/m2.°C) |
|---|---|---|
| Windows | PVC frames double glass were used with 6mm air gap | 2.7 |
| Doors | polyurethane core door without storm | 2.3 |
| Interior walls | Bricks, plaster | 2.8 |
Table 3 shows the total heat loss load through the building spaces and the reduction in the losses through adding thermal insulation of 10 cm rock wool insulation with a thermal resistance of 2 m2. °C/W. The number of operating hours of the building is 8 hours/day.
| Room | Total load (W) | Saving in load (W) |
|---|---|---|
| Master 1 | 2402 | 1602 |
| Master 2 | 2317 | 1715 |
| Master 3 | 1908 | 1208 |
| Main | 3311 | 1306 |
| Living + Kitchen | 8205 | 3315 |
| 18143 | 9146 |
The load saving is used to compare the standard case with added insulation case. The result showed that by applying thermal insulation of rock fiber of 10 cm in thickness the heating load can be reduced by about 50%. The cost of adding thermal insulation is calculated in order to estimate the payback period in years of the system.
The exterior wall areas = 17.3 + 26.5 + 14.3 + 45.5 + 56.5 = 160.1 m2.
Total cost of adding thermal insulation = sum of wall areas x cost ($ /m2) = 160.1 x 80 = 12808 $
Total saving in US$ = Total saving (Wh/year) x electricity tariff (US$/ kWh) = 9146 x 0.2 = 1829.2 $
Payback period, PBP = Investment cost / saving
| = 12808 / (9146 x 0.2) = 7 years | (4) |

The heat recovery system is used in order to reduce the energy needed for the building heating and cooling. In the selection of the heat recovery model, one key issue was taken into consideration which is the cost compared to its properties such as efficiency and lifetime. The selected model is Zehnder ComfoAir 300 [35] with a cost of 12500 US$ and illustrates the parameters obtained from the psychometric chart. The air volume flow rate for seven persons who occupied the building can be calculated based on ASHRAE, 2005 and based on that, each person needs 8 L/s so seven persons need a 56 L/s which is equal to 119 CFM and 202 mᵌ/h.
The heat recovery effect can be calculated through the calculation of sensible heat load Ǭs,f, taking into consideration the air change per hour for the tightened building which is 0.5.
|
Ǭs,f = 1.23 x Vf x (Ti – To) Ǭs,f = 1.23 x 56 x (35 – 26) = 620 W Ǭs,f = 1.23 x 56 x (25 – 3) = 1515 W Ǭs,f = 1.23 x 56 x (30 – 26) = 275 W Ǭs,f = 1.23 x 56 x (25– 16) = 620 W |
(5) |
Fig. (3) shows a system of how to effect heat recovery system on the heating and cooling load in the case with and without a heat recovery system installed. In order to estimate the effect of the heat recovery system, the percent of the average savings calculated for both heating and cooling modes is 58%.
Total saving = total load x saving percent
| = 18143 x 55% = 9979 W | (6) |
Total saving in US$ = total saving (W) x electricity tariff (US$/W)
| = 9979 x 0.2 = 1995 US$ / year | (7) |
Payback period, PBP = initial investment cost / total saving
| = 12500 / 1995 = 9.4 year | (8) |
Energy-efficient lighting is a hot topic in today’s discussions on climate change, sustainable energy policy, and energy efficiency and therefore offers a large opportunity for savings. But, which energy-efficient lighting technology is the best choice? To estimate the lighting load, lighting power consumption demand is required, hence the watt-hours per day (Wh/day) can be calculated. Lighting Load Consumption Table 4 presents the lighting electricity load and annual consumption of Incandescent lamps, Compact fluorescent lamps and LED lamps for the building.
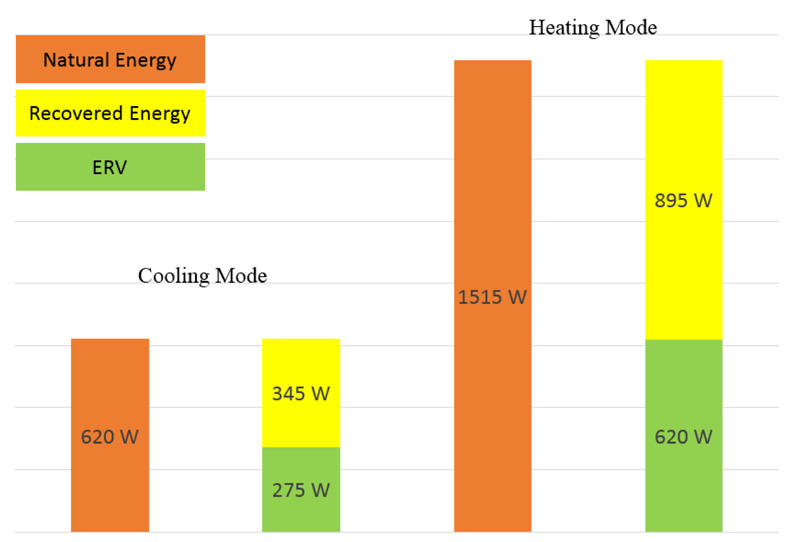
Table 4.
| Area | Fixture Type | Fixture Wattage | Annual Usage | Annual Consumption | |||||
|---|---|---|---|---|---|---|---|---|---|
| Name | Qty | H/D | D/M | M/Y | kW | kWh/yr | Cost/yr (USA $) | ||
| Master 1 | Incandescent lamps | 80W | 4 | 8 | 30 | 12 | 0.32 | 921.6 | 184 |
| Compact fluorescent lamps | 30W | 4 | 8 | 30 | 12 | 0.12 | 346.8 | 69.4 | |
| LED | 5W | 4 | 8 | 30 | 12 | 0.02 | 58.7 | 11.74 | |
| Master 2 | Incandescent lamps | 80W | 4 | 8 | 30 | 12 | 0.32 | 921.6 | 184 |
| Compact fluorescent lamps | 30W | 4 | 8 | 30 | 12 | 0.12 | 346.8 | 69.4 | |
| LED | 5W | 4 | 8 | 30 | 12 | 0.02 | 58.7 | 11.74 | |
| Master 3 | Incandescent lamps | 80W | 4 | 8 | 30 | 12 | 0.32 | 921.6 | 184 |
| Compact fluorescent lamps | 30W | 4 | 8 | 30 | 12 | 0.12 | 346.8 | 69.4 | |
| LED | 5W | 4 | 8 | 30 | 12 | 0.02 | 58.7 | 11.74 | |
| Main | Incandescent lamps | 80W | 7 | 8 | 30 | 12 | 0.56 | 1613 | 322.6 |
| Compact fluorescent lamps | 30W | 7 | 8 | 30 | 12 | 0.21 | 605 | 121 | |
| LED | 5W | 7 | 8 | 30 | 12 | 0.035 | 100 | 20 | |
|
Living + Kitchen |
Incandescent lamps | 80W | 8 | 8 | 30 | 12 | 0.64 | 1843 | 368.6 |
| Compact fluorescent lamps | 30W | 8 | 8 | 30 | 12 | 0.24 | 691 | 138 | |
| LED | 5W | 8 | 8 | 30 | 12 | 0.04 | 115 | 23 | |
| Total | Incandescent lamps | 2.16 | 6220.8 | 1244 | |||||
| Compact fluorescent lamps | 0.81 | 2336.4 | 467.2 | ||||||
| LED | 0.675 | 391.1 | 78.22 | ||||||
| The tariff pricing = 0.163 cent/kWh, 0.114 JD/kWh (JEPCO 2013) | |||||||||
| Lamp Type | Lifetime (Hours) | Cost/Lamp (USA$) |
Annual Usage H/D (8) x D/M (30) x M/Y (12) (hrs) |
No. of Used Lamps | Total Annual Use (Lamps. Hours) |
|---|---|---|---|---|---|
| Incandescent lamps | 12000 | 3.00 | 2880 | 27 | 77760 |
| Compact fluorescent lamps | 20000 | 4.50 | 2880 | 27 | 77760 |
| LED | 30000 | 6.50 | 2880 | 27 | 77760 |
It can observe from the Table 4 that the total actual consumption AC load is 6220.8 kWh/y with a cost of US$ 1244 per year. Furthermore, the total required AC power when all lights are operated is 2.16 kW. According to that, proper Compact fluorescent lamps that have the same nominal lumen will be selected instead of the regular incandescent lamps that are installed. Consequently, the total actual consumption of AC load becomes 2336.4kWh/y, and the cost is US$ 467.2 per year and for the LED lamps, the total actual consumption of AC load becomes 391.1kWh/y with cost of US$ 78.22 per year.
I. Annual Energy Cost Saving Calculations
The annual energy savings and energy cost savings per year can be obtained through using the calculated values in (Table 4) as follows:
| The annual energy savings per year (I.L&C.F.L) = 6220.8-2336.4 =3884.4 kWh/ year | (9) |
| The annual energy savings per year (I.L&LED) = 6220.8-391.1= 5829.7 kWh/ year | (10) |
| The energy cost savings per year (I.L& C.F.L) = 1244-467.2 = 776.8 US$/ year | (11) |
| The energy cost savings per year (I.L&LED) = 1244-78.22 = 1165.78 US$/ year | (12) |
In order to calculate the annual lamp cost savings, the lifetime (Capehart, Turner, and Kennedy, 2012) cost per lamp, annual usage, and the total annual use of the existing lamps, energy-saving lamps, and LED are all listed in the Table 5.
(I) Existing Light Cost Calculations
By using the values listed in Table 5, the existing light cost and energy saving cost can be determined as follows:
| No. of Incandescent lights needed = Total annual use / life time = 77760/12000 = 6.48 lamp | (13) |
| The annual Incandescent light cost = 6.48 lamp / year x 3.00$ / lamp = $19.44 | (14) |
(I) Compact fluorescent lamps Cost Calculations
| No. of Compact fluorescent lamps needed = Total annual use / life time =77760/20000 = 3.89 lamp | (15) |
| The annual Compact fluorescent lamps cost = 3.89 lamp / year x 4.5$ / lamp = $17.5 | (16) |
Annual lamp cost savings = Annual existing light cost - Annual Compact fluorescent light cost
| = 19.44 - 17.5 = 1.94 US$ | (17) |
(I) LED Lamp Cost Calculations
| No. of LED lamps needed = Total annual use / life time = 77760/30000 = 2.6 lamp | (18) |
| The annual LED lamps cost = 2.6 lamp / year x 6.5$ / lamp = $16.9 | (19) |
Annual lamp cost savings = Annual existing light cost - Annual LED light cost
| = 19.44 - 16.9 = 2.54 US$ | (20) |
The payback period (PBP) in capital budgeting refers to the period of time required for the return on an investment to “repay” the sum of the original investment. It can be calculated as follows:
PBP (C.F.L) = initial investment / annual saving = (No. of saving lamps x cost of lamp) / Annual saving
|
= (27 lamp x 4.5 US$/lamp) / (1.94 +570.3) = 121.5/778.75 = 0.16 years |
(21) |
PBP (LED) = initial investment / annual saving = (No. of saving lamps x cost of lamp) / Annual saving
|
= (27 lamp x 6.5 US$/lamp) / (2.54 +1165.78) = 175.5/1169 =0.165 years |
(22) |
There are many types of solar collectors that are used to heat the fluid that is dependent on the absorption plate. The most commonly used types are flat plates and vacuum tubing collectors. A solar water heater that will be selected in this study is based on the water heating system of the building to meet its requirements, for that, a flat-plate collector is selected. All data and results to be determined are based on Jordanian climates.
The solar radiation absorbed by a collector per unit area is equal to the difference between the incident solar radiation and the optical losses. A portion of the incident solar radiation is lost from the collector into the environment through conduction, convection and infrared radiation. Such a loss is called thermal energy loss. So the useful energy output of a collector per unit area is the difference between the absorbed solar radiation and the thermal energy loss.
The designer must decide the orientation of collectors as it is affected by two parameters, which are the azimuth angle (γ) and tilt angle (β). Fig. (4) shows the collector efficiency curve for the selected solar collector manufactured by Hanania [36].
The design of the flat plate solar collector for this case study was carried out based on the following assumptions; performance of flat plate is steady state, uniform flow due to the header cover has a small area in the collector so the flow is one dimensional, temperature gradient around the tubes is neglected, the intensity of solar radiation is taken to be I =1000W/m2, maximum plate temperature is approximately reached to 100ºC, and finally the collector inlet temperature is 50ºC.
The domestic hot water use for the building is estimated to be 50 L/person/day and the design temperature is set to be 55 ºC. The hot water demand (kg) is calculated by multiplying the domestic hot water use by the number of persons, which is 7 persons. The monthly water heating demand is listed in the Table 6, the monthly heat loss is listed in Table 7, the monthly absorbed solar radiation is listed in Table 8, and the monthly useful heat gain is listed in Table 9.

| Month | Water Demand MJ |
Month | Water Demand MJ |
|---|---|---|---|
| January | 2497 | July | 2497 |
| February | 2256 | August | 2497 |
| March | 2497 | September | 2417 |
| April | 2417 | October | 2497 |
| May | 2497 | November | 2417 |
| June | 2417 | December | 2497 |
| Month | Jan | Feb | Mar | Apr | May | Jun | Jul | Aug | Sep | Oct | Nov | Dec |
|---|---|---|---|---|---|---|---|---|---|---|---|---|
| Mean Temp (ºC) | 7 | 8 | 10 | 15 | 20 | 22 | 24 | 23 | 22 | 19 | 14 | 9 |
| Qt(MJ/m2) | 67.2 | 65.8 | 63 | 56 | 49 | 46.2 | 43.4 | 44.8 | 46.2 | 50.4 | 57.4 | 64.4 |
| Month | Solar Radiation (I) (MJ/m2.day) |
Absorbed Solar Radiation (MJ/m2) | Month | Solar Radiation (I) (MJ/m2.day) |
Absorbed Solar Radiation (MJ/m2) |
|---|---|---|---|---|---|
| Jan | 11 | 271.4 | Jul | 33 | 814 |
| Feb | 13 | 290 | Aug | 28 | 691 |
| Mar | 17.7 | 437 | Sep | 24 | 573 |
| Apr | 22.5 | 537 | Oct | 19 | 469 |
| May | 27 | 666 | Nov | 14 | 334 |
| Jun | 31 | 740 | Dec | 10.5 | 259 |
| Month | Qu (MJ) | Month | Qu (MJ) |
|---|---|---|---|
| Jan | 407 | Jul | 1139.6 |
| Feb | 443 | Aug | 967 |
| Mar | 568 | Sep | 803 |
| Apr | 725 | Oct | 657 |
| May | 933 | Nov | 434 |
| Jun | 1036 | Dec | 397 |
The actual thermal loss:
| Qt = UL.FR (T-Tam) | (23) |
From Fig. (4), the intercept of the collector efficiency curve with Y- axis is equal to the value of the FR (τα)e and equal to 0.656. For the selected model τ =94% and α= 84%.
| (τα)e = 1.02 x τα = 1.02 x 0.94 x 0.84 = 0.796 | (24) |
| FR = 0.656 / τα = 0.656 /0.796 = 0.824 | (25) |
For UL calculation, the curve slope from Fig. (4) represents the UL FR then,
| UL FR = 1.4 W/m2. ºC | (26) |
| UL = 1.4/0.824 = 1.7 W/m2. ºC | (27) |
The absorbed solar radiation:
| S = I (τα)e | (28) |
The actual useful gain per unit area,
|
Qu = Ac.FR - [S - UL. (Ti -Ta)] |
(29) |
To estimate the required number of the collector panels nc, the maximum monthly amount of energy required (Q) max is divided by the minimum actual useful energy min Qu.
| nc = QMax/Qu = 2497/397 = 6 collector panels | (30) |
To estimate the payback period, a number of operating hours for the collector is needed to specify the saving in electrical consumption. Assume the total hours needed for heating the domestic water to be 140 days/year when the solar collector is not installed, and the number of hours needed to use the auxiliary energy during the cloudy days where there is no sunlight is 40 days/year. So the first estimation in kWh/year for the auxiliary energy (500 L Floor-standing electric water heater) will be carried out to determine the electricity consumption during cloudy days when there is no sunlight. Table 10 lists some specifications for the electric water heater.
The power consumption for the electric water heater to heat the water when there is no sunlight is,
|
P = n x P x t P = 40 x 5 x 4.54 P = 908 kWh/year |
(31) |
The power consumption for the electric water heater to heat the water when there is no collector installed,
|
P = 140 x 5 x 4.54 P = 3178 kWh/year |
(32) |
| Saving in power consumption in kWh = 3187 - 908 = 2270 kWh/year | (33) |
Saving in power consumption in US$ = saving in power consumption (kWh) × tariff price
| = 2270 x 0.2 = 454 US$/year | (34) |
The initial cost of adding a solar collector with 4 plates for the selected collector, including the installation of the pipes and pumps needed, is 1350 US$ (Hanania).
Payback period, PBP = Initial investment cost / Total annual saving
|
= 1350 / 454 = 3 years |
(35) |
The greatest environmental challenge that Jordan faces today is the scarcity of water. Indeed, water is the determining factor of the population/resources equation. Whereas, water resources in Jordan have fluctuated around a stationary average, the country’s population has continued to rise. A high rate of natural population growth, combined with periodic massive influxes of refugees, has transformed a comfortable balance between population and water in the first half of this century into a chronic and worsening imbalance in the second half. The situation has been exacerbated by the fact that Jordan shares most of its surface water resources with neighboring countries, whose control has partially deprived Jordan of its fair share of water. Current use already exceeds renewable supply. The deficit is covered by the unsustainable practice of overdrawing highland aquifers, resulting in lower water tables and declining water quality.
There are several water conservation strategies that can be considered for buildings. These strategies can be grouped into three main categories: Indoor water management, outdoor water management, and recycling of water. Table 11 describes some of the applications in the building where the water is used, such as toilets, clothes washers, showers, etc. also water management calculations are calculated based on Moncef Krarti, 2011 system with saving up to 31% for all use. The domestic water use for the building is estimated to be 50 L/person/day as hot water and 50 L/person/day as cold water and the number of persons inside the building is equal to 7 persons.
| Brand | ACI Electronic |
|---|---|
| Model | 500L |
| Normal Power | 5000W |
| Intensity | 21.7 Amp. |
| Heating From15ºC to 55ºC | 4.54hours |
| Net Weight | 155kg |
| Max. Operating Temp | 95ºC |
| Max. Operating Pressure | 7 bar |
| End Use | Present of use | Amount of water (L) | Percent of Saving | Amount of saving (L) |
|---|---|---|---|---|
| Toilets | 28% | 196 | 31% | 60.8 |
| Clothes washers | 21% | 147 | 45.6 | |
| Showers | 18% | 126 | 39 | |
| Faucets | 16% | 112 | 34.8 | |
| Leaks | 10% | 70 | 22 | |
| Other domestic | 3% | 21 | 6.4 | |
| Bath | 2% | 14 | 4.4 | |
| Dishwashers | 2% | 14 | 4.4 | |
| Total | 100% | 700 | 217.4 |
The investment cost of the system can be estimated based on the improvement that is selected for the system, which is 1500 US$. The saving in the US$ can be extracted through the saving water amount and the water pricing tariff, which is 5.15 US$/mᵌ.
| Total amount = 700 x 365 = 2555000 L = 255.5 mᵌ/ year | (36) |
Water cost = total amount x water tariff
|
= 255.5 x 5.15 = 1316 US$/year |
(37) |
| Total saving amount = 217.4 x 365 = 79387.5 L = 79.4 mᵌ/ year | (38) |
Water cost = total amount x water tariff
|
= 79.4 x 5.15 = 409 US$/year |
(39) |
Payback period, PBP = initial investment/ saving cost
|
= 1500/409 = 3.6 year |
(40) |
The sun is the largest energy source of life while, at the same time, it is the ultimate source of most of renewable energy sources. Solar energy can be used to generate electricity in a direct way with the use of photovoltaic modules. In this work, a grid-connected system will be considered for the PV system.
The average building electricity consumption per month is assumed to be 800 kWh [37].
The inverter output power can be calculated through Eq. (41).
| Pinv, output = Average electrical consumption /130h = 800/130 = 6 kW | (41) |
Taken into consideration that 130h is the average usage of electricity loads during each month in hours.
Based on the above results, the 6 kW inverter SOLAR EDGE SINGLE PHASE INVERTER SE2200-SE6000 is selected for this study, as it has a high value of ηinv,CEC that equals 97.6%, with good enough power output to meet the required energy. Furthermore, the price was relatively fair compared with other brands.
The power input of the inverter Pinv in, which would necessarily represent the power output of the PV array, can be calculated using the maximum demanded output power and the inverter’s CEC weighted efficiency ηinv,CEC.
| Pinv, in, kWh = Pinv, out, kWh / ηinv,CEC. = 6/0.976 = 6 kW | (42) |
The selected PV is a HELIOS 9T6420 with Pmax = 320Wp at the slandered conditions of 1000W/m2 as irradiance and 25°C module temperature. The module efficiency is 15.45%. The actual PV array power can be calculated by using Eq. 43.
| Pmax, actual (Wp) = [(1 - LT) x (1-LC)] (Pmax) PV panel | (43) |
Where, LT = 0.07 for the worst month, December in this study, and LC = 0.04 a realistic [38].
| Pmax, actual (Wp) = [(1 -0.07) x (1-0.04)] x 320 = 285.7 Wp | (44) |
In order to calculate the array sizing May is considered the best month of the year for solar radiation with an irradiance of 1000W/m2 for 10 hours, while December the worst month with an irradiance of 1000W/m2 for 6.5 hours. The electricity consumption per day is assumed to be 26 kWh.
Power produced by PV cell/h = Daily load (May) kWh / Effective sunlight period
| Pmax, actual (Wp) = [(1 -0.07) x (1-0.04)] x 320 = 285.7 Wp | (44) |
|
= 26 /6.5 = 4000 Wp |
(45) |
No. of PV panels required = Hourly peak hours needed / Pmax, actual
|
= 4000 / 285.7 = 15 panels |
(46) |
The selected SOLAR EDGE SE2200-SE4000 inverter requires a range of input DC voltage equal to Vinv,in 200 - 500V DC, depending on the connected load. For the purposes of this study, a relative voltage level input is to be used, specifically 250 VDC. That is to reduce the DC currents, which would help in reducing the size of the required cables. Therefore, the PV array should have enough panels in series to meet this voltage level. If the Maximum Power Voltage VMP = 45.78 VDC of the HELIOS solar panels.
Total number of PV panels in series = V inv, in / VMP
|
= 250 / 45.78 = 5 panels |
(47) |
Total No. of PV panels lines = Total No. of PV panels / Total No. of PV panels in series
|
= 15/ 5 = 3 parallel lines |
(48) |
The PV array row spacing should be carefully selected to minimize the effect of shading on the amount of power produced. Using the selected HELIOS solar panels with a length of 1.976 m, the value of Y at solar altitude angles equal to 45˚ and at tilt angles equal to 30º is equal to 97.8 cm would be suitable. This will be preferred as it minimizes the total occupied area by the PV array. Consequently, the value of X = 97.8cm, as shown in Fig. (5). The types of panels were carefully selected in order to meet the energy needs of the selected house and ensure to exploit small areas of the roof of the building to maintain sufficient areas for the rest of the various applications and uses of the house. Hence, after choosing the types of panels, mathematical calculations were carried out with the aim of determining the distances that should be left between the panels in order not to allow the panels By blocking the sun's rays from each other so that the entire area needed by the panels is their real area, in addition to the space left between the panels.

To estimate the space required by the PV array, the spacing area is added to the total area of the 30° tilted panels.
AArray = (Amodule + Aspacing) × No of PV Parallel Lines × No of PV in one line
|
= (2+1) × 5 × 2 = 30 m2 |
(49) |
The annual PV production is calculated through the calculation of the monthly production depending on the number of sunshine per day, and it was found that the total PV production is equal to 10076 kWh/year. The electricity tariff of selling electricity based on renewable energy is fixed in Jordan and equal to 0.171 US$ [37], so the price of PV system production is equal to 1723US$. The electricity bill for the building with 9600 kWh/year is 900 US$ based on the electricity tariff announced by the national electricity company in Jordan. The PV system cost consists of the panels, inverter, PV installation and maintenance costs. In this study, the proposed system cost is assumed to be 11750 US$.
Payback period, PBP = Initial investment cost / Total annual saving
|
= 11750 / 2623 = 4.5 years |
(50) |
CONCLUSION
New building technology aims to reduce the energy demand and the environmental impact of the old fashion system by using new: building insulation, heat recovery system, lighting systems, water heating source, water management systems, and a source of electricity generation to cover the building needs. In this work, a 10 cm rock fiber was used as thermal insulation and it was found that it can reduce the energy load by 50%. A heat recovery system applied to help in the recycling of the air during year seasons, it’s found that the percent of saving can reach approximately 57% saving. Two new lighting systems were also applied to the building in order to select one with more savings percent, the selected system was the LED system with 65% savings. The flat plate collector was used to cover the need for hot water for the building resident and it is found that the percent of saving through using this system can reach 75% saving. New equipment was suggested to install as a replacement of the existing equipment for reducing the amount of water used in the daily used and it’s found that the saving percent can achieve through using new equipment can be about 80% saving. On the grid PV, system was designed in order to cover all the needs of the electricity in the building and more and it’s found that the building can provide by its more than its need by 15% over saving. Compiling all new systems together can help to achieve the surplus energy building the case of this work. This research contributes to providing suggestions for the residential building sector in order to provide energy needs from renewable sources, in addition to providing advice on the optimal use of energy in order to provide the largest amount of it.
The payback period, PBP is a key parameter that this work depends on it to show if it’s worth investing in these systems in the building or not. For the presented work, the investment costs for all the systems also summed up the saving in terms of US$ to calculate the payback period.
PBP All systems = ∑ initial investment / ∑ annual saving
=(12808+12500+175.5+1250+1500+11750)/(1829.2+1995+648.64+370+409+2623)
= 5.08 years.
CONSENT FOR PUBLICATION
Not applicable.
AVAILABILITY OF DATA AND MATERIALS
The data sets used and/or analysed during this study are available from the corresponding author upon request.
FUNDING
We gratefully acknowledge the funding of the project (428/2021) by the deanship of academic research - Mutah University.
CONFLICT OF INTEREST
The authors declare no conflict of interest financial or otherwise.
ACKNOWLEDGMENTS
We gratefully acknowledge the funding of the project by the deanship of academic research - Mutah University.
| Nomenclature Table | |||
|---|---|---|---|
| U | Over all coefficient of heat transfer | C.F.L | Compact fluorescent lamps |
| Rth | Thermal resistance | PBP | Payback period |
| Rwall | Wall resistance | Qt | The actual thermal loss |
| Ro | Outdoor resistance | UL | Overall coefficient of heat transfer of the wall |
| Ri | Indoor resistance | FR | Removal Heat Transfer Factor |
| kWh | kilowatt hour | T | Main temperature |
| Ǭs,f | Sensible heat load | Tam | Ambient temperature |
| I.L | Incandescent lamps | τα | Effective Transmittance - Absorptance |
| I | solar radiation | nc | Number of the collector panels |
| S | absorbed solar radiation | QMax | Maximum Heat transfer by ERV |
| Qu | The actual useful gain per unit area | Pinv, output | Power output of the Inverter |
| Ac | Solar collector area | Pinv, in, kWh | Power Input of the Inverter |
| P | The power | ηinv,CEC | The inverter efficiency |
| n | Number of Working Days in a Month | Pmax | The max power |
| t | Time Needed to Heat the Water to the Desired Temperature | Lc | Cable Loss Factor |
| Pmax, actual (Wp) | The actual max power | LT | Temperature Loss Factor |
| AArray | Area required by the PV panel | Lm | Material Thickness |
| Aspacing | Space area between the panels | Amodule | Module area |
| ERV | Energy Recovery Ventilation | ||

