All published articles of this journal are available on ScienceDirect.

Flow Test for Ground Granulated Blast Furnace Slag-Fly Ash Inorganic Polymer Mix Designed for Pre-Placed Gravel Pavement
Abstract
Objective:
For the purpose of inexpensive and accelerated creation of corrosive resistive load bearing environments, the concept of combing pre-placed aggregate construction methods with Inorganic Polymer (IP) binder was explored.
Methods:
In this study the concept of combing pre-placed aggregate construction methods with Inorganic Polymer (IP) binder was explored by using laboratory scale experiments.
Conclusion:
Laboratory scale experiments demonstrate mechanical properties of the constructed bed as well as provide a useful range of component ratios, and ascertain the optimal operating conditions.
1. INTRODUCTION
Traditional construction methods of structural materials such as concrete foundations or pavements require specialized equipment for batching and installation. The most common binding agent, Ordinary Portland cement, requires costly extraction procedures which in 2015, released 1500 mT of carbon dioxide into the atmosphere according to analysis done by Robbie M Andrew [1]. Industrial Inorganic Polymer (IP) binder, however, repurposes harmful waste products of manufacturing processes such as slag and fly ash leading to reduced emissions [2]. These materials are readily available in any industrialized environment, making IP an easily accessible building material should resources be limited. For these reasons, the following study was conducted to seek an IP mix designed for use in preplace aggregate pavements. Furthermore, the following will show that the proposed method of construction does not require batching, and proves installation is as simple as mix and pour.
The proposed method rests heavily on Pre-Placed Aggregate (PPA). As the analysis will show, the characterization of the PPA is crucial to the success of the pour. The concept of PPA is not a new one, rather, PPA has been used in industry for decades as a method of repairing structures as well as for several underwater construction applications [3]. Preplaced aggregate concrete is defined as the production of structures by placing aggregate in a sealed form later injected with binding mixture to fill the voids [3, 4]. This method reduces shrinkage due to the high density of course aggregate and increase in point to point contact of large aggregate [4]. However, the method described in this report deviates from the standard practice of preplaced aggregates. Our procedure is designed for horizontal application, not vertical, therefore the binder is applied to the top of the gradation and allowed to seep. Furthermore, our binder is gravity fed unlike the pressurized flow standard in PPA practice [4]. Further commonplace in modern application of PPA is the integration and application of non-shrink admixtures known as grout fluidifiers [5]. Admixtures commonly contain aluminum powder, which reacts with the alkali elements within OPC causing the release of hydrogen gas [5]. The gas causes expansion of PPA grout making the mix ideal for repairing OPC structures as it ensures intimate contact with the fractured surfaces [5]. Other components common in PPA binders include pozzolans such as fly ash, water reducing agents, and buffers to control setting and expansion [4, 5]. Course aggregate void content ranges from 40-48% void [4, 5]. The following design however finds success in the simple, and is able to achieve seepage and strength without the use of admixtures. Finally, we wish to take the application of PPA a step further for construction of full horizontal pavement design.
The second component of the proposed method is a binder, therefore as mentioned above, this study will utilize industrial geopolymer or inorganic polymer. Inorganic polymers are unique from classic ceramics in that the curing is due to a pseudo polymerization reaction between aluminates and silicates with alkali metal stabilizing ions in water. Inorganic polymers are closely related to metakaoline geopolymers in formation but differ from the strict definition of geopolymers in the starting materials. Inorganic polymers can be formed at low temperature (room temp), can cure in little as 1 day to full strength, and have potential strength 100% stronger than OPC [6]. The Ground Granulated Blast Furnace Slag-Fly Ash inorganic polymer (GGBFS FA IP) used in the following discussion form tetrahedra of alumina and silica which polymerize with corner sharing coordination. Here, the 3+ aluminum to the 4+ silicon is balanced by a 1+ alkali metal ion in solution of H20 which floats in cavities/pores/ near the alumina tetrahedra [6, 7].
Inorganic polymers should not be confused with Alkali activated materials, which induce reactions that form calcium aluminosilicate hydrates and sodium aluminosilicate hydrates [8]. These structures are not considered inorganic polymers nor geopolymers. Alkali Activated Matrices (AAM) are binders formed from alkali ions, such as sodium, originally used to test the setting properties of slag [8-10].
Our proposed test method seeks to define novel IP mix designs in order to form concrete pavements via binder application to PPA. These structures will prove useful for rapid construction and due to the absence of OPC and batching machinery, result in reduced CO2 emissions and labor.
2. APPROACH AND MATERIALIZATION
2.1. Experimental
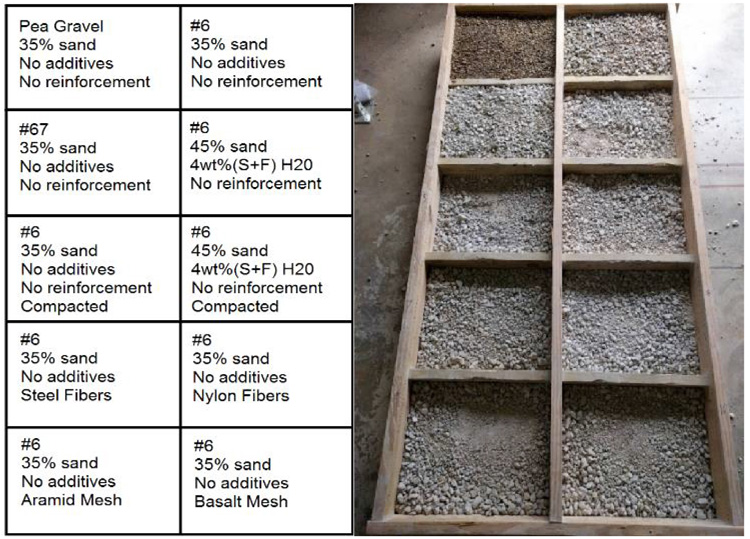
IP mix design was based on previous work of the group and collaborators at the UIUC. The test plan is depicted below in Fig. (1). Each paver base is 4 inches compacted base course. The PPA gradations were then laid atop the base course according to the indicators shown in the left most schematic in Fig. (1). The boxes in this figure next define the mortar parameters by stating sand content in percent by weight, and additive content, in this case, tap water. The following descriptors state the condition of the PPA, either compacted or as laid, and whether there is reinforcement.
Each paver is to be cored and cut into flexure bars. In this way, the height of the core gives the penetration depth of the mortar, and subsequently, the compressive strength of the cores after correcting for height to diameter ratio can be compared to realize the highest strength mix and gradation design. The flexure bars then give a decent indication of pavement performance on unstable soils.
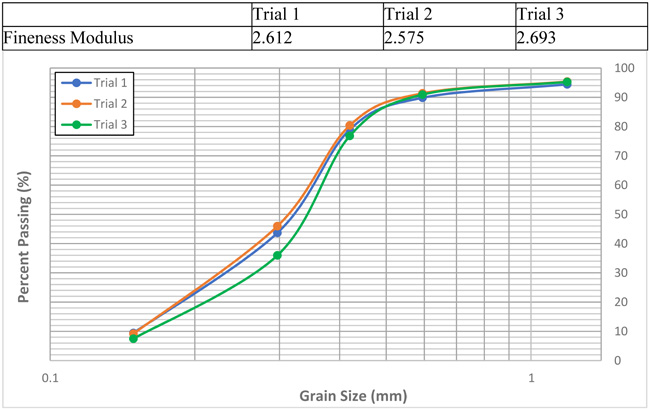
Void testing was done to characterize the PPA; the sand used for the mortar was characterized via fineness modulus. The binder rheology testing was used to characterize the flow properties of different mortars and obtain a pourable lifetime. All data is available in the appendix.
3. METHODS
3.1. Inorganic Polymer Mixing
Inorganic polymer mixing was done in ICA high shear mixer in ratio 48.75 weight % class F fly ash, 25 weight % BW50 sodium silicate solution, 16.25 weight % slag and 10 weight % deionized water for flow tests. For test pavements, mixing was done in a STOW concrete mixer.
3.2. Mechanical Testing
Mechanical testing followed modified dimension ASTM C293 for 3-point flexure and ASTM C109 for hydraulic compression of cylinders [11]. A wooden box was constructed as seen in Fig. (1). Each paver was 22 in x 18 in. A plywood base bound each section via 2x8 and 2x10 lumber. Road-pack base course was laid in all pavers and compacted with a jack tamper. Atop the road pack, the gravel gradation type, reinforcement and mortar composition were varied as depicted in Fig. (1). Pavers were filled with mortar in two lifts, starting on the outside corner working inward. Air lock was a serious issue with this design, therefore holes were drilled in the sides of the pavers which were percussively vibrated. Surfaces were spread and smoothed with a trowel and the entire assembly was covered with a tarp to ensure constant moisture content. All pavers were cored into 3 cylinders and cut via wet saw into several beams. One cylinder was delegated for compression testing per test day according to ASTM C109 [11], while all beams were selected for 28 day 3-point flexure testing according to sample size-modified ASTM C293[11].
3.3. Soil Characterization
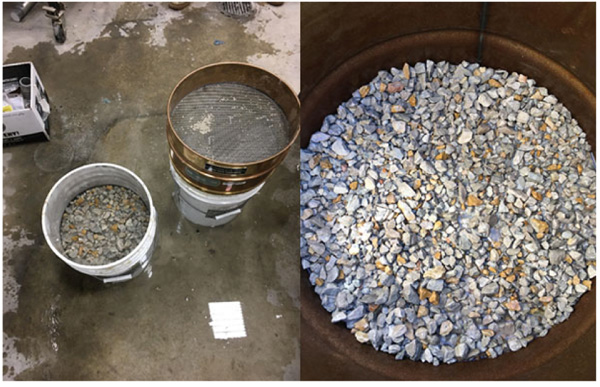
Soil characterization of sand and gravel followed ASTM C778 [11] for sand and ASTM #67 #6 and pea gravel specifications. Void testing consisted of weighing water, which filled a gravel bed, in a bucket to a defined level.
3.4. Flow tests
Flow tests were carried out in an array of three, four-inch diameter by eight-inch tall cylinders. Each cylinder had a single hole drilled into the center of the base such that there existed a cylinder with spout size 1\\, ¾\\, and ½\\. Rubber stoppers plugged the spouts until needed. In order of descending spout size, the cylinders were suspended above a data-logging scale, synced to compatible software running on a windows computer. Mix N2 was used to create IP mortar with varying weight percentages of sand and liquid additives as described above. Mixtures were gravity fed through the spouts of varying diameter and mass was recorded by the scale at a frequency of 1 hertz. The full procedure was repeated every ten minutes, until the mix no longer flowed.
4. RESULTS AND DISCUSSION
4.1. Gravel Analysis
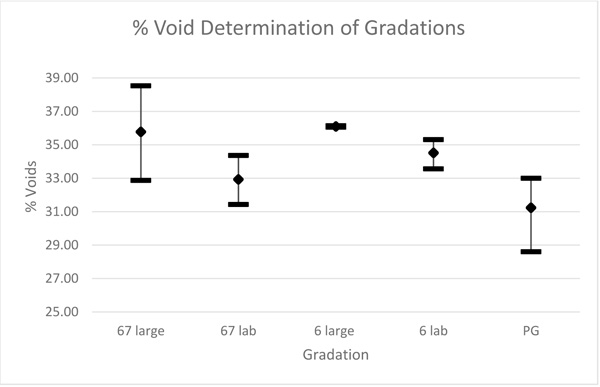
In order to fully understand the seepage and flow properties of the IP, it is best to see it in action via test pavements. Furthermore, it is pertinent to understand the characteristics of the gradations used for the test pavements and the sand used for the mortar. Void testing was done on pea gravel and targeted ASTM #6 and #67 gradations; the set-up is depicted in Fig. (2). Knowing the void content allows for accurate determination of batch size of IP per volume of surface course and, in the case of the test pavements, allows us to predict which gradation will have the best seepage qualities. Comprehensive analysis of the gravel and sand is depicted below in Figs. (3 and 4).
4.2. Flow
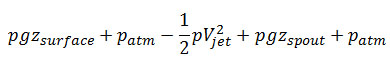
Before experimentally determining the flow rate, several mathematical models were assessed in order to obtain a predicted range over which the true flow rates would likely fall. Using incompressible Bernoulli equation to describe the flow of a low viscosity inorganic polymer mortar, and applying this equation to a “Streamline” that starts at the top free surface and exits out the spout yields,
 |
(1) |
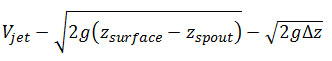
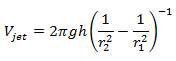
Note that the exiting fluid jet experiences the same pressure as the free surface (patm). Solving for the fluid jet velocity gives,
 |
(2) |
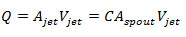
The non-zero viscosity of fluids will rob the flow of mechanical energy (converting it into heat within boundary layers hugging the spout walls), hence the fluid jet beyond the spout exit will have a slightly smaller diameter than that of the spout. This factor can be accounted for by a discharge coefficient C, whose value is typically between 0.80 and 0.98. The volumetric flowrate Q results from multiplying the jet velocity times the cross-sectional area,
 |
(3) |
The set-up as described above and featured in Fig. (5) follows flow condition “Sharp Edged”, therefore, the discharge coefficient C shall be 0.61. Calculating the flow rates, we obtain Table 1.
Applying Navier-Stokes equation to describe the flow of low viscosity IP mortar gives,
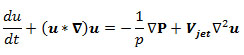 |
(4) |
| Hole diameter (d) in inches | Discharge coefficient (Cd) | Exit Velocity (m/s) | Volume flow rate (ml/s) | Mass flow rate (g/s) |
Density (g/cm3) |
|---|---|---|---|---|---|
| 0.5 | 0.61 | 2.444 | 189 | 380 | 2.010 |
| 0.75 | 0.61 | 2.444 | 425 | 854 | |
| 1 | 0.61 | 2.444 | 755 | 1519 |
Solving for our system we obtain,
 |
(5) |
Calculating volumetric flow rate in a similar manner to that detailed above we find,
 |
(6) |
Such that is the viscosity of the mortar and A is the area of the spout. With this approximation we obtain Table 2.
Upon running the tests we find there are consistently two regions of flow behavior for each run, the first being a linear region representing the steady state flow of IP, and the second being a power-law region which appears as the decrease in head becomes significant and flow slows or stops. The power-law regions represent a boundary condition that is not the focus of our work and will therefore not be discussed further. The linear region, however, shall be.
The end of the linear region is marked when either IP runs out, as is the case of the 1\\ diameter hole at 0 min for any mixture, or when the head pressure drops significantly; turn your attention to the 45% sand batches at 20 minutes as there is virtually no flow in the ½\\ even with maximum head pressure. It is interesting to note that the definition of “significant head” changes as the IP begins setting. This is likely caused by the increase in viscosity. According to Bernoulli and Stokes, the viscous material will resist flow much more strongly, therefore it is logical to attribute the decreasing flow rate, or in other words, the increase in pressure needed to maintain a flow rate, to the rising viscosity due to setting.
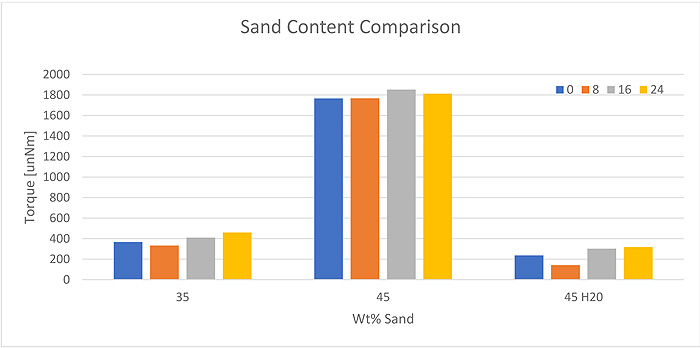
Rheology was done on these same mixes to determine the torque at 8 minute intervals. In this way, we can obtain what a “flowable torque” is. The 45% sand mix through the ½\\ is definitively unable to flow at 20 minutes. The corresponding torque at 16 minutes is 1.813 mN*m, and at 24 minutes is 1.852 mN*m. The 35% sand mortar flowed at 0.459 mN*m and the 45% sand mortar with added water last flowed at 0.317 mN*m. 35% sand and 45% sand with added water remained flowable until initial set occurred. The 35% sand mortar showed the longest “pourable lifetime,” being pourable at a maximum of 40-50 minutes. Table 3 below shows a summary of the flow data and Figs. (6) and (7) shows the progression of flow over time.
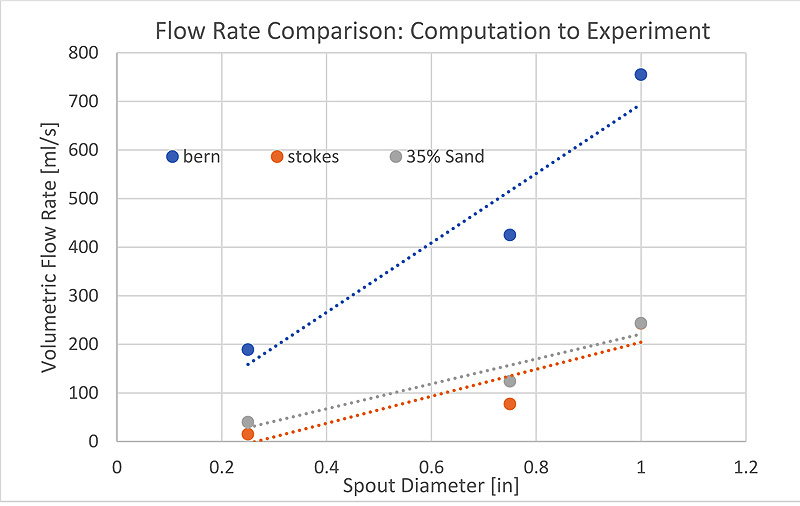
A graphical comparison to our two mathematical prediction supports than the IP follows Stokes equations for incompressible liquid and that perhaps Bernoulli is a too idealized case. Fig. (8) below clearly shows the 35% mortar fits between the two approximations with a preference for Stokes. The 45% and 45% with added water mortars were not estimated via Bernoulli and are therefore not shown; they do however follow closely to the Stokes approximation as can be seen from Tables 2 and 3.
4.3. Seepage
In order to determine the seepage depth of IP mortar in various environments and of various mix designs, core height and diameter was recorded. The resulting ratios are displayed in S. Table 1 of the SI. As void fraction increases to 36% corresponding to ASTM # 6 gradation, we achieve 90% seepage. Going forward, all subsequent mixes used a preplaced aggregate of #6. Uncompacted versus compacted PPA revealed that compaction limited seepage severely. Tracking the core seepage depth against sand content and reinforcement type showed no notable trend.

| Sand Content, Density; [weight %], [g/ml] | Hole Diameter [in] | Volume flow rate [ml/s] |
|---|---|---|
| 35, 2.19 | 0.5 | 15 |
| – | 0.75 | 77 |
| – | 1 | 243 |
| 45, 2.07 | 0.5 | 3 |
| – | 0.75 | 16 |
| – | 1 | 51 |
| 45 4% Added water, 2.01 | 0.5 | 25 |
| – | 0.75 | 127 |
| – | 1 | 401 |
| Sand Content, Density; [wt%], [g/ml] | Hole Diameter [in.] | Volumetric Flow Rate [ml/s] |
|---|---|---|
| 35, 2.19 | 0.5 | 39.87 |
| 0.75 | 123.91 | |
| 1 | 243.35 | |
| 45, 2.07 | 0.5 | 20.66 |
| 0.75 | 79.75 | |
| 1 | 208.71 | |
| 45 4% Added Water, 2.01 | 0.5 | 55.68 |
| 0.75 | 112.27 | |
| 1 | 332.66 |

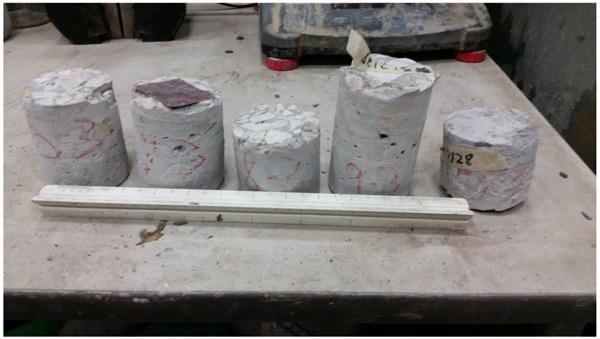
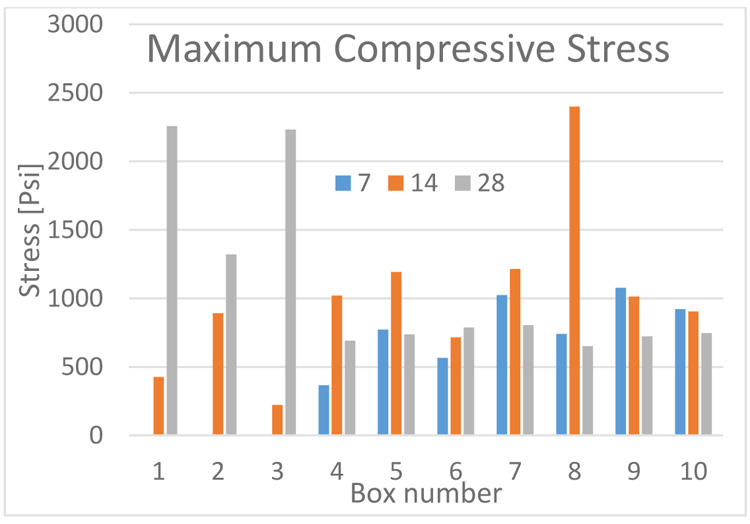
The degree of seepage discussed earlier varied between samples, resulting in varying core heights as depicted in Fig. (9). A correction factor must therefore be applied to allow accurate comparison between cores. Once corrected according to ASTM C 42 [11], the core compressive strengths were compared and depicted in Fig. (10).
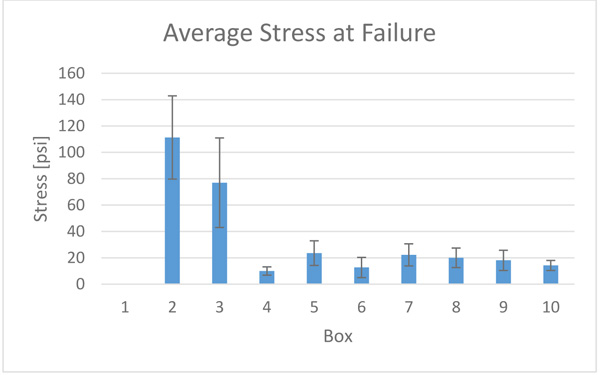
Combining with flexural test results depicted in Fig. (11) data we find pavement ‘2’ achieved the highest overall strength corresponding to # 6 gravel bed with 35 wt% sand IP mortar with no additives, compaction, or reinforcement. Under compression, mix 1 and 3 achieve higher strength but fail to perform under flexure. Mix 8 achieved high strength on day 14 however saw a decrease in strength on day 28, this is likely caused by degradation at the interface between binder and reinforcement.
Flow tests were done on IP mortars of various sand contents through varying opening diameters to determine which mortar was superior for pavement construction. Superior mortar was determined via degree of seepage, sufficient “Pourable Lifetime” and overall pavement strength. From this culmination of tests, it is possible to say that 35% sand is the optimal sand content for IP mortar as it is used in this method of construction. An example nozzle feed calculation is displayed in Table 4.
| Parameter | Symbol | Value | Notes |
|---|---|---|---|
| road thickness [in] | T | 6 | – |
| road width [feet] | w | 8 | – |
| nozzle spacing [in] | d | 12 | – |
| void content | Vc | 0.35 | – |
| passes | P | 2 | – |
| flow rate [ml/s] | Q(n) | 243 | For 35% sand at 1” |
| conversion cc => in^3 | F | 0.0610237 | – |
| Length nozzle accountable [in] | Ln | 12 | – |
| Width nozzle accountable [in] | Wn | 12 | – |
| Volume per pass [in^3] | Vp | 151.2 | LnWnTVc/P |
| Time on location [sec] | t | 10.19640275 | LnWnT/Q(n)PF |
| Raster velocity [in/sec] | v | 1.176885643 | 12/t |
CONCLUSION
This study was carried out to determine flowability parameters of GGBFS FA IP mortar mixtures to measure the speed of flow under gravity and rate of percolation into preplaced aggregate layer of known thickness and density. The gradations were prepared for the purpose of rapid pavement design and implementation. The void content can be calculated to relate volumetric discharge to rate of pouring to fill the voids. The viscosity of the IP was determined via rheology which gives us a flowable torque when combined with the volumetric flow rate. Flow rates were determined experimentally and via simulation for several mortar mixes and spout sizes. Mechanical and structural properties of the pavements were determined via core compression testing and flexural beam data. The combination of these tests reveal a 35% GGBFS FA IP achieves high strength and long pourable lifetime compared to higher water contents and sand contents.
CONSENT FOR PUBLICATION
Not applicable.
AVAILABILITY OF DATA AND MATERIALS
Not applicable.
FUNDING
This study was conducted for the Foreign Technology Assessment Support Program under Project 461088, “Method of Construction for Geopolymer Soil Stabilized Platforms.
CONFLICT OF INTEREST
The authors declare no conflict of interest, financial or otherwise.
ACKNOWLEDGEMENTS
Declared none.
SUPPLEMENTARY MATERIAL
Supplementary material is available on the publishers web site along with the published article.

