RESEARCH ARTICLE
Key Mechanisms of the Seismic Behaviour of External RC Wide Beam–column Joints
Giuseppe Santarsiero1, *, Angelo Masi1
Article Information
Identifiers and Pagination:
Year: 2019Volume: 13
First Page: 36
Last Page: 51
Publisher ID: TOBCTJ-13-36
DOI: 10.2174/1874836801913010036
Article History:
Received Date: 22/08/2018Revision Received Date: 08/01/2019
Acceptance Date: 15/02/2019
Electronic publication date: 28/02/2019
Collection year: 2019

open-access license: This is an open access article distributed under the terms of the Creative Commons Attribution 4.0 International Public License (CC-BY 4.0), a copy of which is available at: (https://creativecommons.org/licenses/by/4.0/legalcode). This license permits unrestricted use, distribution, and reproduction in any medium, provided the original author and source are credited.
Abstract
Background:
Reinforced concrete beam-column connections provided with wide beams are widely used in the European residential building stock. Several seismic codes indicate some limitation to be applied to this kind of reinforced concrete buildings due to their reduced performances with respect to those provided with conventional beams.
Objective:
The paper is focused on improving the knowledge of wide beam-column joints, highlighting the key degradation mechanisms affecting them, mainly related to slip phenomena of beam rebars, especially the rebars placed outside the column width.
Methods:
The behavior of wide beam-column joints has been evaluated by means of both experimental tests under cyclic loading and accurate nonlinear finite element analyses. The FE models predicted satisfactorily experimental results, thus enabling to carry out additional numerical analyses aimed at checking the effect of the longitudinal reinforcement amount in the beam member.
Results:
Experimental results show that wide beam-column joints conforming to the Italian seismic code do not exhibit a sufficiently ductile behavior due to damage in the non-confined concrete region, where beam rebars external to the joint core are anchored. Numerical simulations allowed to monitor bond slip of beam rebars as a function of the applied global displacement, show differences between bars placed inside and outside the column width.
Conclusion:
Numerical simulations showed that different behavior is expected in case additional beam rebars are placed either inside or outside column width. In the first case, higher peak load and ductility values can be achieved, provided that the amount of beam reinforcement is not high enough to shift damage towards the column or cause high shear stress to the joint core and its consequent fragile failure.
1. INTRODUCTION
The seismic performance of Reinforced Concrete (RC) structures is strongly influenced by the behavior of beam-column joints. Therefore, a lot of research has focused on understanding the Behavior of traditional beam-column joints (e.g., [1-3]), that is the joints provided with conventional beams and also to verify the effectiveness of retrofit systems [4]. This choice has led to neglect the huge presence of wide beams in the residential building stock of Italy and other European countries. Wide beams are those which have a width larger than their depth and are usually wider than column dimensions. Moreover, referring to the Italian RC building stock, their depth is usually equal to the slab thickness. In this kind of arrangement some longitudinal beam bars pass (for interior joints) or anchor (external) outside the column core in poor and/or unconfined bond conditions.
The use of wide beams provides some advantages in terms of internal distribution of spaces since no irregularity is present in the ceiling and, moreover, easier (and cheaper) installation of formworks is allowed. This can result in a lower inter-storey height and faster construction works [5]. Different construction habits can be found throughout the European building stock. In fact, Italian RC buildings, either existing or newly constructed, are provided with wide beams only in the interior of the plan arrangement, while conventional beams are present in the facade frames. On the other hand, for example, Spanish buildings are usually provided with wide beams even in the perimeter [6] resulting in poorer bond conditions for the external beam-column joint connecting there. However, this habit (flat spandrel beam) is growing its application in Italy also due to its cost-effectiveness.
López-Almansa et al. [7] highlighted the high vulnerability of RC buildings provided with wide beams due to the inherent low ductility of these kinds of beams and generated by the high amount of steel and unreliable contribution to the strength of the beam zone outside the column. Contrarily, other authors [8] found that, when a strong spandrel beam is present, widebeam-column joints can exhibit good performances in term of strength and ductility.
Regarding the design of new buildings, given the lack of research, seismic codes are generally “suspicious” about the real behavior of wide beams in beam-column connections under seismic actions. As an example, ACI-ASCE 352 code [9] gave some indications on the design of such types of connection, but only for the cases when all the beam flexural reinforcement bars pass through the column core. This latter case virtually implies the prohibition of the use of wide beams in moment resisting frames located in seismic regions. Current seismic codes such as EC8 [10] allow the use of wide beams in RC moment resisting frames even when designed in high ductility class (DCH), while the Italian seismic code [11], although substantially in line with EC8, forbids the use of wide beams in DCH frames, and only allows their presence in the lower ductility class. This provision has been kept in the revised version of the Italian seismic code [12].
Gomez-Martinez et al. [13] carried out a study to understand if the penalization of wide beam frames by the Italian seismic code is valid. They compared the performance of common (i.e. with conventional beams) and wide beam frames, through pushover analysis, finding that the latter can show an even higher seismic performance due the serviceability limit state (displacements) design criteria, requiring the design of stronger columns. In this study, the lumped plasticity of RC members was considered, the joint region was assumed as rigid and slippage effects were also neglected.
Currently, a number of experimental studies have been performed on wide beam-column joints which allow us to better understand their behavior. In a study to analyze the influence of the Earthquake design level on the seismic behavior was presented [14]. The authors compared the performance of wide beam-column joints designed without seismic provisions (pre 1970 code) with others having the same topology but with detailing consistent with the newest seismic code (EC8). The main result was that the seismically designed joints showed higher strength, as expected, but also a limited deformation capacity due to a sudden strength drop. In another study [15] the authors analyzed the influence of the axial load finding a small influence of it in the range of the adopted values (i.e. 15-30% of the ultimate axial load). Fateh et al. [16] made experimental tests on five full scale wide beam-column joint specimens in order to evaluate the influence of the beam width and the beam reinforcement arrangement. The tests, monotonic instead of cyclic, were still useful in recognizing that a concentration of the beam bars mostly in the column core provides better behavior than distributing them through the entire width of the beam.
An experimental and numerical study was carried out on wide beam-column joints where parametric analyses were also performed to evaluate the effects of a spandrel beam on the global response [17]. They found that the torsional behavior of spandrel beams dominates the seismic performance of wide beam-column joint specimens. Also, Benavent-Climent et al. studied internal [18] and external [19] wide beam-column joints equipped with shallow spandrel beams, making reference to the Spanish construction habit where shallow spandrel beams are frequently used. They compared their experimental results with those of other experimental campaigns, where no gravity loads were applied on the beam member during the tests, and found that the presence of the gravity load is able to delay the yield of beam longitudinal bars and, in turn, reduce the displacement ductility.
On the basis of the results of the studies described above, the main objective of the present study is to carefully analyze the post-elastic behavior of two wide beam-column joints designed with respect to the current Italian seismic code by means of the experimental results of quasi-static cyclic tests. These specimens have no spandrel beam, resulting in a poor bond condition for the beam rebars located outside the column width. Additionally, accurate finite element modelling of the specimens has been made to understand some aspects of the damage mechanisms under seismic loading. Numerical results, in agreement with the experimental ones, show that the behavior of external wide beam-column joints is strongly affected by the bond conditions of the beam bars passing out of the column core. This outcome highlights the need to limit the amount of beam longitudinal reinforcement bent outside the column. Along with bond slip phenomena, severe cracks on the beam sides also occur. Once the numerical models were calibrated fitting the experimental results, additional nonlinear numerical simulations permitted to investigating the effect of the amount and position of additional longitudinal reinforcement in the beam. Advantages in locating the rebars inside the column width are highlighted by numerical results, provided that the bending capacity of the beam does not shift the failure mechanism toward the column and joint core. Moreover, when placing the additional rebars outside the column, even though inside the so-called “effective width” (the column width plus two times the slab thickness, according to the Italian seismic code), slip phenomena cause severe strength drops responsible for a reduced available ductility.
2. EXPERIMENTAL INVESTIGATION
Globally, the experimental program included 26 cyclic quasi-static tests on full-scale beam-column joints equipped with both conventional beams and wide beams with different Earthquake Resistant Design (ERD) levels. The results of the experimental tests hereafter presented have been already reported in detail in [3, 14]. Therefore, the experimental campaign is briefly described being the novelty of the study represented by the advanced finite element analyses which permitted to investigate additional reinforcement layouts.
The joints considered here were assumed to belong to an internal frame of an RC 4-storey residential building with a constant inter-storey height of 3.2m. The beam is not supporting slab whose joists are parallel to it, therefore the joint resists only seismic actions.
The geometry of the joint specimens is shown in Fig. (1). The two specimens, named TS2 and TS3, were designed considering a low seismicity zone (Zone 4, ag = 0.05 g) and a medium seismicity zone (Zone 2, ag = 0.25g), respectively. ag is the design ground acceleration at the ultimate limit state on type A ground [20].
The geometry of the beam and column members is the same for the two specimens. The column has 300 x 300 mm cross-section while the beam has 600 x 240 mm cross-section. The detailing is consistent with that prescribed by the Italian seismic code matching the ductility class B as allowed for framed structures provided with wide beams.
Fig. (1), looking especially at specimen TS2 Fig. (1a), shows what can happen regarding the beam reinforcement arrangement applying the current Italian seismic code [11]. It prescribes that for seismically designed RC buildings, the beams, for their whole length, are provided with at least two rebars at top and two at the bottom, with a diameter not less than 14 mm. Moreover, if there is a spandrel beam, 75% of the top steel amount can be placed inside a width (so-called “effective width”) equal to the column width plus twice the slab thickness, which in this case is 300+240+240=780 mm. As can be seen, these prescriptions are respected even though the bigger bars (14 mm diameter for TS2 and 16 mm for TS3) are outside the column, resulting for specimen TS2 that most of the steel amount is outside the column in a non-confined concrete zone. So large effective width can be assumed whatever is the type of spandrel beam (i.e., deep or shallow), even though they can have very different behavior.
From the point of view of critical zones like the beam-column intersection, hoops in the column have been placed with the same spacing as the minimum used for the ends of the framing upper and lower portions of the column, as prescribed by the code.
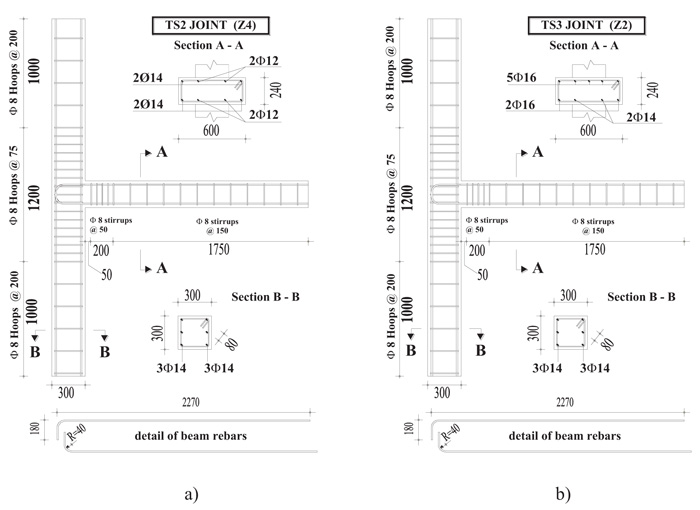 |
Fig. (1). Specimen geometry and detailing: a) TS2 specimen and b) TS3 specimen. |
It has also to be said that some construction defects were found after the steel cage was built. These mainly regarded the beam for which very different values of the concrete cover were found by means of a pacometer survey made just before the test. The top longitudinal reinforcement cover, equal to about 80 mm, was far higher than the prescribed value, while the bottom one was equal to 20 mm, in line with the design documentation. As can be seen in the following, this significantly influenced the behavior of the specimen.
The present study involves these two specimens given that the experimental results [14] showed strength values consistent with those expected but with a low deformation capacity. This is the main reason why the authors think that greater knowledge is necessary by making detailed numerical analyses to better understand the actual behavior and identify possible drawbacks of this type of beam-column connections.
The specimens were built in 2006, while the tests were made in 2013. Some compression tests on cores extracted by the specimens after the cyclic test carried out in 2013 revealed a mean value of the strength equal to fc=37 MPa. The reinforcing steel used was of type B450C, in line with the current Italian structural code [11] and corresponding to hot-rolled steel of class C according to the Eurocode 2 [10]. By means of some tensile tests on 8, 12, 16 mm diameter bars the mean value of the yielding strength was found to be equal to fy=480 MPa. The failure stress was around fts=590 MPa at a deformation of about 8%, while the ultimate deformation was about εu=12%.
The compression axial load on the column has been assumed as equal to that acting in static conditions, that is N=290 kN.
The experimental tests were carried out by applying the horizontal displacements at the top of the column. The axial load on the column was kept constantly equal to the value due to gravity loads. The system that applies the vertical load is designed to rotate along with the column so that the load direction remains parallel to the column axis without causing P-Δ effects. Load application was cyclic quasi-static with displacement control, thus permitting an adequate correlation with the stiffness and strength degradation of the specimens. The rate of application of the displacement at the top of the column was equal to 4 mm/s. The drift was increased with steps of 0.25% until reaching a drift of 1.5% and, then, with steps of 0.5%.
The instrumentation consisted of load cells that measure the axial load applied to the column, the beam reaction, and the cyclic horizontal load applied by the actuator at the top of the column. The deformations of the specimens are acquired using LVDTs applied to the column, to the beam and to the two lateral sides of the joint panel region. More details on the test set-up and the experimental program as a whole can be found in [14].
3. MAIN RESULTS OF EXPERIMENTAL TESTS
Main results from the experimental investigation of the two specimens are reported in the following in terms of both load-drift envelopes and observed damage mechanisms. As a general consideration, in both the specimens the weak beam-strong column collapse mechanism was observed, as many other researchers have found in their experimental campaigns on wide-beam column joints (e.g., [19]) even though a considerable amount of beam longitudinal reinforcement was present. This can be ascribed to the reduced depth of the wide beam which causes a low resisting moment compared to the column, as well as to the fact that, due to slip phenomena, the beam rebars outside the column do not yield causing additional weakness of the beam with respect to the column. This latter could be affected by the presence of the slab which, in real structures, could modify the behavior of the beam rebars outside the column due to some confining effect.
3.1. Load-Displacement Envelopes
Comparison of load-displacement curves is very important to judge how well a numerical analysis can capture nonlinear phenomena occurring in the RC members. Specifically, the displacement values are reported in terms of drift computed as the ratio of the column top displacement and the inter-storey height.
Fig. (2a and b) report load-drift envelopes of the loading cycles applied to specimens TS2 and TS3, respectively, during the experimental investigation. It can be noted that the behavior of both TS2 and TS3 specimens is characterized by a very narrow plateau of load values compared to conventional (equipped with conventional beam) beam-column joints provided with the same earthquake resistant design level [14]. The latter indicates that degrading phenomena occur earlier in these specimens. Moreover, due to the lesser stiffness of wide beams, yielding occurs at a higher drift value thus reducing the available ductility ratio.
For example, regarding the specimen TS3 (designed for seismic zone 2) subjected to positive loading, the yielding occurs at approximately 2% drift while for similar specimens provided with conventional beams, it occurs at drift values lower than 1% (see specimens T2, T3 and T5 in Masi et al., 2013). On the other hand, the ultimate drift du (evaluated as that one where 20% peak strength decay is observed) is equal to 2.4% for TS3 specimen while is averagely equal to 3.85% for the aforementioned specimens equipped with conventional beams.
For TS2, a load reduction after the peak was evident starting from a drift of 2.0% for positive loading and of 2.5% in the negative quadrant where the strength degradation displays a lesser extent.
The behavior of TS3 specimen was very similar to TS2 with higher maximum load values, as can be expected from a specimen with higher Earthquake Resistant Design level. In fact a peak positive load of about 21 kN was reached by TS2 specimen, while 26 kN was the maximum load exhibited by TS3 specimen. The deformation capacity of TS3 seems to be affected by a sharper drop after the peak load at 2% drift. A similar behavior is visible in the negative quadrant. Generally, significant asymmetry in terms of peak load value can be observed especially for specimen TS2 due to the already mentioned huge difference between top and bottom concrete cover. This asymmetry is less significant for specimen TS3 because the concrete cover difference is counterbalanced by a larger amount of top steel reinforcement.
3.2. Damage Patterns
Heavier damage on the tested specimens is concentrated at the beam-column intersection, especially on the beam zones outside the column width (also called in the following “wings”). Some beam reinforcing bars are anchored in those zones and high bond stresses are likely to be achieved since the effective bond length is quite short. Pull-push effect of top and bottom beam reinforcement see Fig. (1a and b) develops high stresses in the zone provided with no confining reinforcement, generating severe cracking. The latter is the most important cracking pattern caused by the cyclic loading probably combined with slippage phenomena of the bottom beam bars, as reported later when discussing the results of finite element analyses. In fact, flexure cracking at the beam-column intersection is also responsible for concrete spalling at beam bottom probably causing an important loss of bond. Upper beam bars do not suffer such a phenomenon thanks to the thicker concrete cover (i.e. about 80 mm).
The damage state at the end of the test is depicted in Fig. (3a and b) for specimen TS2 and TS3, respectively. As can be seen, severe diagonal cracking is visible on the beam sides at the beam-column intersection. Also, vertical cracks are visible on the beam near the face of the column. Crack patterns in the two specimens are similar, although with some differences. Vertical cracks in the beam preceded diagonal ones in the specimens TS2, whilst the opposite happened for the TS3 specimen. Diagonal cracks in the TS3 specimen are wider compared to TS2 since the bars bent outside the column have a larger area, thus causing higher stresses in concrete. On the contrary, vertical cracks in the TS2 specimen near the beam-column intersection are more evident than in specimen TS3 as a consequence of the lower amount of beam longitudinal reinforcement. However, note that a series of additional micro-vertical cracks are expected in the same zone of the beam, not being visible especially at the end of the tests since the drift was set to zero and most of those cracks had closed.
 |
Fig. (2). Experimental load-displacement envelopes for a) specimen TS2 and b) specimen TS3. |
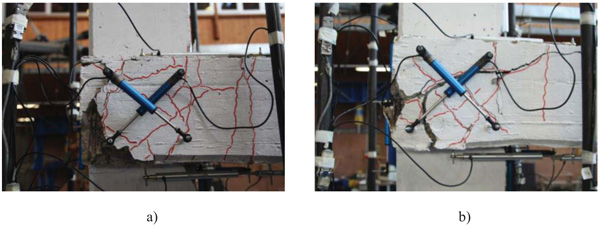 |
Fig. (3). Damage patterns at the end of the tests (4% drift) for a) specimen TS2 and b) specimen TS3. |
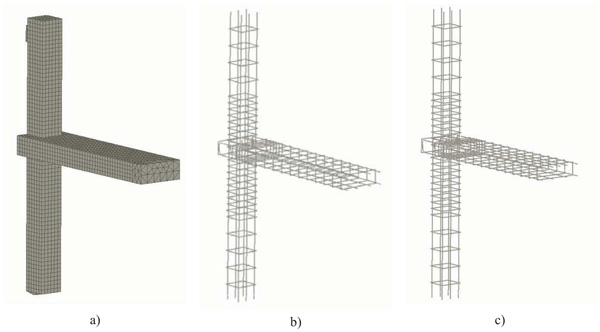 |
Fig. (4). 3D finite element model a) concrete meshing with brick elements, b) truss elements modelling reinforcement cage of TS2 specimen and c) of TS3 specimen. |
4. FINITE ELEMENT MODELLING
Finite element modelling of the specimens was carried out using the software package ATENA 3D version 5.3.3 [21]. The geometry of the specimen was modelled by defining different macro-elements for the RC members and other auxiliary elements. The connection of the different macro-elements (beam and column) was assumed as rigid in order to assure the compatibility of strains. Also, steel plates with linear elastic behavior were used to model loading and reaction regions. The mesh was made of 5470 3D linear brick elements having a mean size of 50 mm. Reinforcing bars were modelled by truss elements embedded in concrete Fig. (4). The curved part of the beam rebars was approximated by diagonal segments connecting the straight branches.
4.1. Concrete
The formulation of the constitutive relations was considered in the plane stress state. A smeared cracks approach was used to model the damage. The nonlinear behavior of concrete in the biaxial stress state is described by means of the effective stress σcef and the equivalent uniaxial strain Ɛeq. The equivalent uniaxial strain was introduced in order to eliminate the Poisson’s effect in the plane stress state. The complete equivalent uniaxial law for concrete is depicted in Fig. (5a). As can be seen the loading and unloading branches are not unique so that the stress in the concrete depends on loading history. However, concrete softening branch in compression is displacement based. At local level the compressive displacement (shortening of concrete) is evaluated and compared to the critical compressive displacement wd (in this case assumed equal to 2.5 mm), that is not dependent on the size of the structure as demonstrated in [22].
The behavior of concrete in tension is linear until the tensile strength is achieved. Once the tensile strength f'eft is reached, a fictitious crack model based on a crack-opening law and fracture energy is used for modeling crack propagation in concrete. From several crack opening laws available in ATENA, the exponential one was selected [23], as can be seen from Fig. (5b).
The compressive strength f'eft is assumed as the mean value obtained from the compressive tests on cores extracted from the column members belonging to the specimen after the test was completed. This latter is
 |
(1) |
The tensile strength was determined based on the expression provided in Eurocode 2 [10], that is
 |
Fig. (5). a) Equivalent uniaxial law and b) exponential crack opening law for concrete. |
 |
(2) |
where fck = 29 MPa has been determined through the results of the compressive test on cores.
For what concern zones where the concrete works under simultaneous tension and compression in the two principal directions, a reduction of the compressive strength after cracking in the direction parallel to the cracks is done assuming the relation between compressive strength reduction and tensile strain by Kolleger & Mehlhorn [23], also based on the Modified Compression Field Theory [24].
In the smeared cracking approach, a significant role for the accuracy of the model was played by the value of the fracture energy GF that was evaluated by means of the Remmel’s law [25], as follows:
 |
(3) |
where GFO = 0.106 N / mm for concrete with crashed basalt aggregate as in this case.
Finally, in order to set a proper nonlinear concrete model, the tension stiffening effect has to be well described. This effect is related to the stress interchange between tensile concrete and steel and is normally well accounted for by the explicit cracking occurring in volume finite elements. However, although the crack band method is able to describe the formation of cracks it is limited by the fact that once a crack appears, it must spread to the entire area of the hexahedral (brick) element. This would require, in some situations, very fine meshes that could be too expensive in terms of calculation time. Due to this, a proper description of the cracking process can be done by limiting the residual tensile strength of concrete with a coefficient ᴄts. This factor represents the relative limiting value of tensile strength in the tension softening diagram, as in Fig. (6). In the present study, this was found by gradually increasing it starting from zero until the numerical load-displacement curve showed a good fit with the experimental one. All the previously specified features are included in the so-called “CC3DNonLinCimentitious2” concrete model available in ATENA software and used in these numerical analyses. Table (1) summarizes the parameters selected for the adopted concrete model.
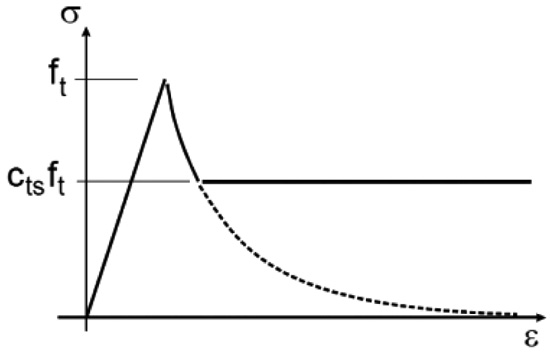 |
Fig. (6). Tension softening law with tension stiffening effect. |
| Parameter | Units | Value |
|---|---|---|
| Uniaxial compressive strength f'c | (MPa) | -37.00 |
| Elastic modulus Ec (MPa) | (MPa) | 32500 |
| Strain at compressive strength | - | -0.002 |
| Tensile strength ft (MPa) | (MPa) | 2.90 |
| Unit fracture energy (N/mm) | N/mm | 0.164 |
| Tension stiffening factor Cts | - | 0.30 |
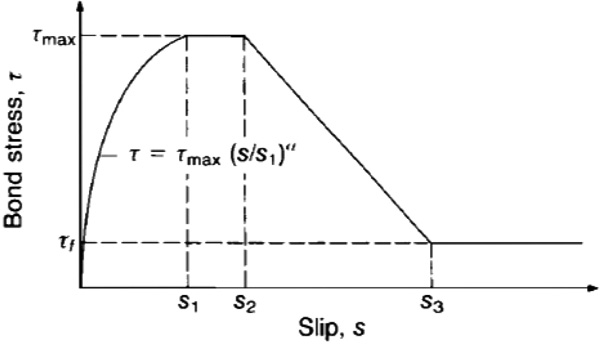 |
Fig. (7). Bond model (CEB-Fip model code). |
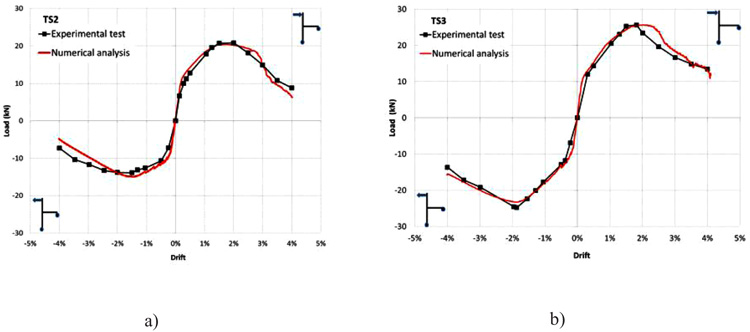 |
Fig. (8). Comparison of experimental and numerical load-displacement skeleton curves. |
4.2. Reinforcing Steel
A hardening elasto-plastic behavior was considered for the steel reinforcement. Since the numerical analyses have been monotonic instead of cyclic (in order to strongly reduce the computational effort), no Bauschinger’s effect has been accounted for. The steel elastic modulus has been set equal to 200.000 MPa and yielding stress is considered as fy=480 MPa according to the experimental results obtained from tensile test on steel specimens, as stated previously. The hardening effect has been set in order to reach the failure stress value of fts = 590 MPa at a strain of εs = 8%. This constitutive law is assumed for both longitudinal and transverse reinforcement.
ATENA 3D software can simulate the bond between concrete and steel by means of nonlinear springs [21] whose constitutive laws have to be carefully evaluated. Actually, when ribbed reinforcement is used, a perfect connection can be assumed to simulate the nonlinear behavior of RC structures. Due to the particularities of wide beam-column joints (presence of beam rebars bonded in unconfined concrete) and to the previously mentioned construction defect (top concrete cover is about 80 mm while the bottom is 20 mm), bottom and top beam rebars (outside the column core) have remarkably different bond conditions.
In this study the CEB-FIP model code [26] bond law was used. Accordingly, different bond laws are considered depending on the quality of the bond and on the confining effect acting on the concrete.
For this reason, the bond law considered for the bottom beam rebars placed out of the column core, considers unconfined concrete and poor bond conditions (concrete cover size equal to 20 mm)
Making this assumption the peak bond stress is τmax = 5.38MPa while the residual value is τf = 0.80MPa with s1=s2=0.6 mm and s3=2.5 mm (Fig. 7).
For the upper external beam bars good bond conditions (concrete cover size equal to 80 mm) were considered, still assuming unconfined concrete. This resulted in τmax = 10.76MPa, τf = 1.6MPa, s1=s2=0.6 mm and s3=1.0 mm. All the other beam longitudinal rebars (inside the column core), as well as the column rebars, were considered having a perfect connection with concrete.
4.3. Loading History
The numerical analyses were displacement controlled, by applying a horizontal displacement to the top of the column in a monotonic way. Actually, the best way to calibrate a numerical model should consider applying the loads in the same manner as in the experimental test, i.e. cyclic loading, in this case. However, to keep the computational effort sufficiently low, the loading history was monotonic instead of cyclic. This choice is corroborated by the fact that monotonic numerical analyses have already shown to be effective in the interpretation and understanding of experimental results from tests under cyclic loads (e.g [27-29]). Therefore, two separate analyses were necessary to apply positive and negative displacements.
Before the application of the horizontal imposed displacement, few steps were necessary to apply the compression load on the column, set equal to N=290 kN. The iterative solution was obtained by means of the Newton-Raphson method applying small increments of the displacement. Precisely, increments of 0.3 mm were applied until reaching the targeted maximum displacement. It is worth noting that the software is able to generate additional sub-steps in order to get a load increment consistent with the nonlinear solution. As maximum displacement a value of 128 mm was chosen for the numerical analyses, corresponding to the maximum experimental drift value of 4%.
5. COMPARISON OF NUMERICAL AND EXPERIMENTAL RESULTS
In order to check the capability of a numerical model to correctly predict the behavior of either whole structures or sub-assemblages, it is helpful to compare the load-displacement curves obtained from experimental tests and numerical simulations. This allows us to understand if key phenomena occurring during the nonlinear behavior of a specimen (e.g. cracking and crushing of concrete, bond slip) are correctly accounted for in the right sequence [30]. With this in mind, the skeleton curves of experimental and numerical load-displacement behavior were prepared. The numerical one is the direct result of the finite element analysis, while the experimental one is obtained by connecting all the load peaks of each set of three cycles. The peak load in each set is always relevant to the first cycle since degrading phenomena cause the strength drop during the following second and third cycle.
As can be seen from Fig. (8), for both TS2 and TS3 specimens the numerical analysis is able to follow the experimental behavior very well, up to 4.0% drift for both positive and negative loads, even when severe cracking is observed in the experimental investigation. Some delay in the drop of the numerical curve of TS3, after reaching the peak load, was observed. This could be due to lower degrading phenomena accounted in the numerical analysis since it is monotonic and for this reason cracking is less severe.
In order to make a systematic comparison of results, the data about forces and deformation capacities is summarized in Table (2), for both the experimental tests and the numerical analyses, in terms of.
- peak value of the positive load, Fmax, and negative load, Fmin;
- ultimate drift value for positive load, du+,, and negative load, du-;
The ultimate drift du is conventionally determined according to Panagiotakos and Fardis [31] as the drift value where a strength decay of 20%, with respect to the peak value, is observed.
The comparison in Table (2) shows good agreement between experimental and numerical results especially concerning peak loads and related drift values for both specimens. The load’s prediction is good for both the positive and negative quadrants with the difference being equal to 1% for positive and 6% for negative loads concerning specimen TS3. Prediction for TS2 is slightly less accurate, but still very good since the maximum load difference is 9% for negative loading. It is worth noting that, given the very complex behavior of wide beam-column joints, larger differences in the peak load prediction can be found in other studies (e.g [17]).
The prediction in terms of ultimate drift value for both positive and negative loads is good: the higher differences, relevant to specimen TS3, are equal to 12% and 11% for positive and negative loading, respectively. Some of this difference can be explained by taking into account that, as the numerical analysis is monotonic, less damage and, consequently lower strength degradation, is expected with respect to the experimental cyclic test. However, such a difference appears rather small. Also for TS2 specimen, a good prediction is found, apart from the negative quadrant where the numerical peak load is larger and the degrading branch is slightly steeper.
| - | TS2 | TS3 | |||||
|---|---|---|---|---|---|---|---|
| Experimental | Numerical | Ratio Exp/Num | Experimental | Numerical | Ratio Exp/Num | ||
| Fmax | [kN] | 20.96 | 20.42 | 0.97 | 25.89 | 25.62 | 0.99 |
| Fmin | [kN] | -14.00 | -14.95 | 1.07 | -24.66 | -23.25 | 0.94 |
| du+ | [%] | 2.70 | 2.90 | 1.07 | 2.40 | 2.68 | 1.12 |
| du- | [%] | -3.20 | -2.50 | 0.78 | -2.95 | -3.28 | 1.11 |
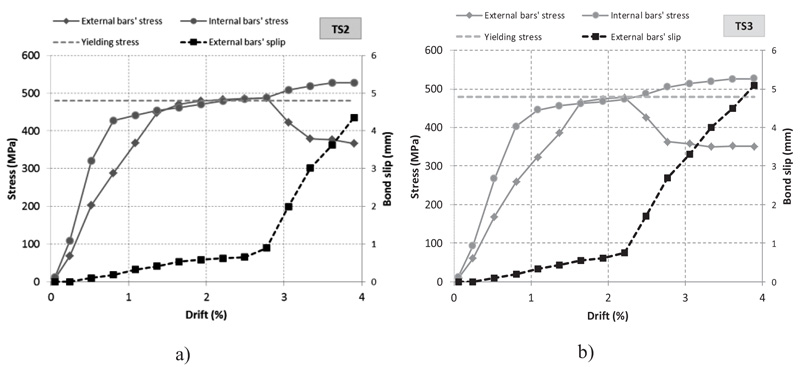 |
Fig. (9). Comparison of stress values from numerical analyses for a) TS2 specimen and b) TS3 specimen along with trends of bond slip for bottom rebars placed outside the column (external). |
Indeed, in addition to the comparison in Table (2), the effectiveness of the numerical model can be assessed by looking at the post-peak branches of the load-drift plots in Fig. (8) where the numerical solution confirms the capability of precisely predicting the damage mechanisms affecting the tested specimen, capturing the degrading behavior up to a drift value of 4% where extensive damage occurred.
The good agreement between experimental and numerical load-displacement curves generally confirms that the assumptions in the numerical model are useful in capturing the main damage mechanism which occurred in the experimental tests.
In order to fully characterize the degrading phenomena affecting the specimen it is interesting to plot the trend of the stress values (and bond slips) of the bottom beam rebars vs drift, as displayed in Fig. (9) for positive loading, where heavier damage occurs. Stress and slip values are related to the inner face of column where they both achieve the maximum values. For positive loading, when bottom bars are subjected to tension, external bars suffer bond slip even for very low drift values with significant differences of stress values compared with internal ones, for both TS2 and TS3 specimens. First slips of these bars occur at 0.3% drift for both TS2 and TS3 specimens.
Specimen TS2 in Fig. (9) shows the yielding of internal bars at about 2.2%, while external ones slightly overcome the yielding stress without the possibility of hardening, as internal bars do. In fact, at about 2.6% drift, slips start to grow more quickly meaning that the peak bond strength has been reached. After a sharp drop, the stress of the external bars stabilizes at about 380 MPa because the 90° bends start to work.
Specimen TS3 offers similar trends. However, in this case the external bars approach the yielding without reaching it. The stress drop starts earlier (2.2% drift) compared to TS2 and finally the stress stabilizes around 360 MPa. Slip values are generally larger for the TS3 specimen, especially after the peak bond strength was achieved.
Very different behaviour of interior and external bars suggests that a better behaviour could be obtained by placing the bars with the larger area inside the column core, not as in this case, where the two specimens have the bars with larger area anchored outside the column width (see beam section A-A displayed in Fig. (1a and b)). In the specimens under study, considered as belonging to a real structure, the reinforcing bars arrangement was obtained from a commercial finite element software consistent with the Italian structural code. Taking this into account, it is interesting to check what happens changing the amount of beam longitudinal reinforcement inside and outside the column core. This can be made with the help of the calibrated finite element models by only varying the number and location of beam bars.
6. ANALYSIS OF DIFFERENT REINFORCEMENT LAYOUTS
In order to verify the effect of different longitudinal reinforcement layouts in the beam on the global behavior of wide beam-column joints, additional finite element analyses have been carried out. TS2 joint in its current arrangement has been used as control specimen. It was preferred to TS3 being provided of a lower amount of beam reinforcement and therefore more suitable to be analyzed with additional rebars in the beam.
In particular, the goal of these analyses is to verify the possibly different effect of additional beam reinforcement placed either inside or outside the column core. To do so, starting from the FE model relevant to the control specimen, different FE models have been built by locating further rebars in two different zones. The first choice has been placing the rebars outside the column core (O) while, in the second one, rebars are inside the column core (I). In such a way the global beam reinforcement arrangement has been held symmetric (i.e. the top steel area is equal to the bottom one).
The new FE models were obtained by adding two or four 14 mm diameter bars at the top and at the bottom of the beam cross-section as reported in Table (3), either inside or outside the column width.
As displayed in Fig. (10), each reinforcement layout is indicated with the letter “O” or “I” followed by a number (e.g. O-1) that means how many rebars are added at both the top and bottom of the beam cross-section.
Based on the 3D nonlinear FE model of the control specimen TS2, four finite element models were built by changing the quantity and position of steel bars in the beam. Using these models further analyses were carried out with the same modalities used for specimens TS2 and TS3, and checking the response in terms of load-drift curves corresponding to the different solutions. The numerical simulations provided the load-drift behavior and the damage mechanisms considering only positive loading in order to keep the computational effort under acceptable limits.
Moreover, damage mechanisms were investigated by means of the cracking pattern provided by the post-processor.
6.1. Seismic Performance
Fig. (11) shows the comparison of the load-drift curves related to the five FE models (only for positive loading). As can be expected, in presence of additional reinforcement area the maximum sustained load is higher, even though the Fmax increase is lower than the As increase, e.g. while the latter is in the range 1.58-2.15, the Fmax increase is in the range 1.41-1.80. Further, the As increase does not always provide better ductility performance. In Table (3), the main results from the numerical simulations are summarized.
| Layout | AS | AS/ABG | ASE/ABG | ASI/ABG |
|---|---|---|---|---|
| (mm2) | (%) | (%) | (%) | |
| Control sp. | 532 | 0.37 | 0.21 | 0.16 |
| O-1 | 838 | 0.58 | 0.43 | 0.16 |
| O-2 | 1144 | 0.79 | 0.64 | 0.16 |
| I-1 | 838 | 0.58 | 0.21 | 0.37 |
| I-2 | 1144 | 0.79 | 0.21 | 0.58 |
ABG gross area of the beam cross section
ASI beam steel area inside the column width
ASE beam steel area outside the column width
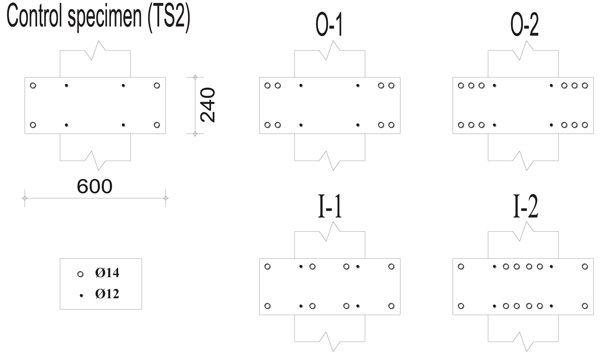 |
Fig. (10). Different beam rebars arrangements for the parametric analysis. |
In order to compare the relative performance of the different layouts, beyond the maximum load additional parameters have been derived from the FE models. First of all, the yielding drift (dy) determined as the drift value where the first bar reaches a stress value equal to fy. The second one is the ultimate drift (du) assumed as the drift value where the load-drift curve shows a 20% strength drop with respect to the peak load value. These values are reported in Table (4), along with the percentage variations with respect to the control specimen values.
It can be noted that higher peak load values are attained when additional reinforcement area is placed inside the column core where lower bond-slip effects take place. Due to this in the models I-1 and I-2 higher stress values in the beam rebars can be attained, thus resulting in better global performance. Specifically, increased strength values of about 47% and 80% with respect to the control specimen are found in I1 and I2 models, respectively, while O-1 and O-2 show strength increase equal to about 41 and 66%, respectively.
Ultimate deformation capacity du generally show a slight decrease compared to the control specimen, with the exception of model I-1 where du increases of about 30%. This shows that layouts with a significant quota of steel inside the column width can determine more ductile mechanism provided that the total steel amount does not increase so much to shift the crisis from the beam to the column and/or the joint core.
Globally, the layout named I-1 determines more favorable performance providing significant increases of both peak load and displacement ductility that increases of about 92%.
6.2. Damage Patterns
In order to analyse the role of the different reinforcement layouts on the damage pattern, the crack width plots were obtained from the ATENA 3D FE simulations. They are displayed in Fig. (12) where the colormaps are done using a color scale suitable to put in evidence the distribution of Crack Opening Displacement (COD) value through the whole beam-column joint. This means that the highest values (which are out of scale) have been assigned a cyan color. The cyan colored zones attain a crack width of about 2 mm.
The plots represent the external view (from the side) of the crack patterns for a max drift value of 4%, if attained by the model under examination. In the case the analysis ended before 4% due to convergence problems, the plots are taken at the maximum drift value.
First of all, it can be noted that comparing the damage pattern among the control specimen and the models O-1 and O-2 the damage to the column increases. The damage to the beam sides (the part of the beam included in the column depth) increases in O-1 but decreases in O-2 given that, in this case, most of the cracks affect the column, i.e. there is an unfavorable mechanism shift towards the weak column-strong beam behavior. To support this conclusion, it is sufficient to compare the maximum stresses in column longitudinal reinforcement σcol. In the O-1 model there is σcol=363 MPa, while in the O-2 model σcol=486 MPa is found, that is higher than the yielding stress value. These values are attained at drift value just beyond the peak load, before heavy slip degradation phenomena cause the strength drops in both models.
| - | Control spec. TS2 | O-1 | O-2 | I-1 | I-2 | ||||
|---|---|---|---|---|---|---|---|---|---|
| Value | Value | Δ% | Value | Δ% | Value | Δ% | Value | Δ% | |
| Fmax [kN] | 20.42 | 28.84 | 41.2 | 34.00 | 66.5 | 30.00 | 46.9 | 36.76 | 80.0 |
| du [%] | 2.9 | 2.54 | -12.4 | 2.70 | -6.9 | 3.75 | 29.3 | 2.62 | -9.7 |
| dy [%] | 1.97 | 1.52 | -22.8 | 1.40 | -28.9 | 1.33 | -32.5 | 1.77 | -10.2 |
| μ [-] | 1.47 | 1.67 | 13.6 | 1.93 | 31.3 | 2.82 | 91.8 | 1.48 | 0.7 |
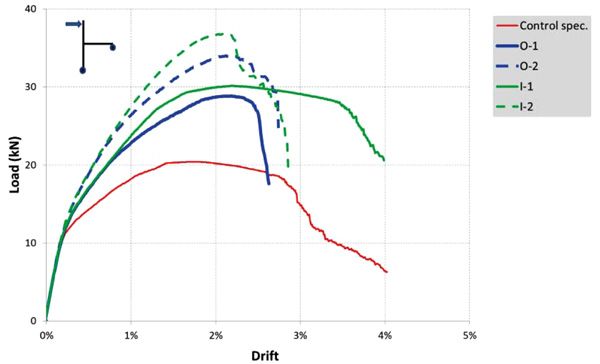 |
Fig. (11). Load-drift curves from different reinforcement layouts. |
For what concerns I-1 and I-2 solutions, increasing the reinforcement amount inside the column provide different results. In fact, a general increase of the column damage is yet visible even though the damage to the beam sides decreases, being most of the beam reinforcement located inside the column width. These layouts provide σcol=446 MPa and σcol=493 MPa, respectively for I-1 and I-2, meaning that for I-2 also the column yields resulting in a mechanism not consistent with capacity design principles.
The high ductility difference between I1 and I2 (2.82 against 1.48, Table (4), can be attributed to the heavier damage sustained by the column that in I2 model is subjected to a higher flexural demand.
Indeed, Fig. (13) shows the residual tensile strength when the peak loads are observed for the layouts I-1 and I-2. The color map is related to a vertical plane intersecting the mid-side of the column. It is worth to remember that the tensile behavior of concrete has been approximated with an exponential softening law where the residual tensile strength depends on the COD. So, the lower is the residual tensile strength, the higher is damage.
As for I-1 layout, the area with the lower residual tensile strength values (most damaged area) is that surrounding the beam reinforcement partially extending inside the beam-column intersection. In I-2 model (equipped with a higher amount of beam steel area), the most damaged area is larger also due to the higher stress values in the column longitudinal reinforcement.
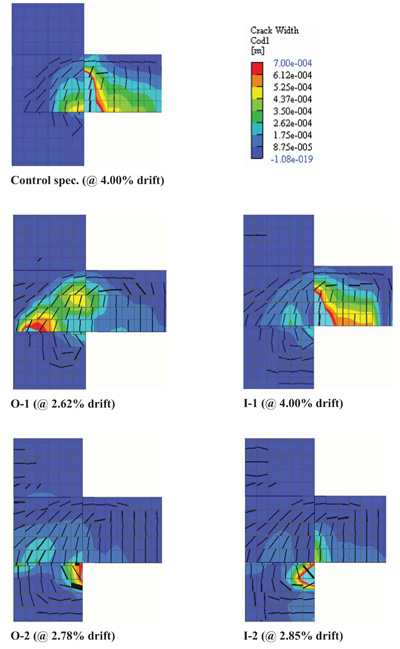 |
Fig. (12). Crack width plots in the five different models (side views) at the max attained drift value. |
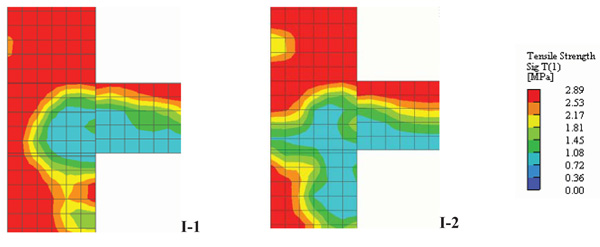 |
Fig. (13). Tensile strength field inside the column core at peak load. |
The heavier damage observed in the beam-column intersection of layout I-2 (particularly in the back of the column, where the beam bars are anchored) origins a decrease of tensile stress of the beam and column longitudinal reinforcement affecting, in turn, the whole strength of the specimen the drops. Moreover, less favorable ductile performances are observed.
It can be concluded that O-1 and O-2 layouts appear not suitable choices because they cause larger damage to the beam sides (wings) and to the column, respectively. Further, heavy bond slips are found causing an early strength drop as observed in the load-drift curve Fig. (13). Therefore, a more effective solution is locating the additional rebars in the column width, as generally suggested by many codes, and specifically, adopting I-1 layout, that is avoiding over-strength of the beam as shown by layout I-2.
CONCLUSION
With the help of advanced numerical simulations, it has been possible to identify the key phenomena responsible of the sudden strength degradation affecting external RC wide beam-column joints when subjected to lateral loads. For the two studied specimens, subjected to experimental tests under cyclic loads, very poor bond conditions determined slip phenomena affecting the bars bent outside the column core, that reduced their ability to provide an adequate deformation capacity and, in turn, significant ductility.
These phenomena do not occur to the bars bent within the column width due to better bond conditions and to the favourable confinement action exerted by the hoops. Indeed, along with slippage phenomena, another important damage mechanism is the cracking on the beam sides, where no confinement effects are present due to the absence of beam and column hoops. Moreover, the high flexibility of wide beams causes a delay of its yielding point in comparison with beam-column connections equipped with conventional beams (having the depth larger than width), thus further reducing the available ductility.
The numerical simulations showed that different behavior is found in case additional beam rebars are placed either inside or outside the column core. In the first case, higher peak loads and ductility can be achieved, provided that the amount of beam reinforcement is not so high to shift damage towards the column and/or to affect the beam-column intersection.
Increasing the amount of beam longitudinal reinforcement outside the column (O-1 and O-2 layouts) leads to fragile behavior since the increased strength of the beam cannot be sustained due to slippage phenomena which suddenly reduces the beam rebar stresses. Before this happens, the strength of the specimen increases enough to determine higher flexural demand on the column, with the consequent cracking and damage. This happens even (as in this case) the additional bars are next to the column in the so-called effective width of the beam which the Italian seismic code defines as the column width plus two times the slab thickness (being about equal, in this case, to the full beam width).
In the case of I-1 and I-2 layouts (provided with additional rebars placed inside the column), lower damage to the beam sides is found. This finding is important with respect to the repairability after a seismic event: in fact, the damage to the column ends is easier to be identified and repaired.
Out of the four investigated layouts, I-1 is the best solution providing significant increments to the peak load and especially to the ductility. In fact the stress drop (due to slip) of external bars is a little share of the total tensile stress exerted by beam rebars, resulting in a little influence on the specimen’s ductility.
Moreover, despite some additional cracks to the column (compared to the control specimens), the whole damage to the column is less than those found in the other layouts. The column rebars do not yield assuring that the whole failure mechanism is weak beam-strong column. This latter should be accounted when framed RC buildings are constructed using wide beams, which are easier to manage during the construction process (reduced need of formworks). For this reason, the Italian construction habit has recently turned towards the use of embedded spandrel beams (i.e., provided with a depth equal to the adjacent slab thickness). This makes the bond conditions of the bottom bars similar to those ones of the specimens herein studied, with the consequent problems highlighted in this study. In general, considering fully collaborating the beam rebars placed in the effective width (but outside the column) appears an unconservative assumption, especially if the concrete cover is poor as in the case a deep spandrel beam is absent.
| Nomenclature | |||
| f’c | compressive strength of concrete | ASE | beam steel area outside the column width |
| ft | tensile strength of concrete | ABG | gross area of the beam cross section |
| ν | Poisson’s ratio of concrete | dy- | yielding drift value for negative loading |
| Ec | elastic modulus of concrete | du+ | ultimate drift value for positive loading |
| fts | failure stress of reinforcing steel | du- | ultimate drift value for negative loading |
| fy | yielding stress of reinforcing steel | μ- | ductility ratio for negative loading |
| εu | strain of steel | ag | design ground acceleration |
| εu | ultimate strain of steel | σefc | effective stress of concrete |
| τf | residual bond stress | εeq | equivalent uniaxial strain of concrete |
| τmax | ultimate bond stress of the laminate | f’eft | uniaxial tensile strength of concrete |
| s1 | Bond slip at τmax | f’efc | uniaxial compressive strength of concrete |
| s2 | Bond slip at the end of plateau | fck | cylinder characteristic strength of concrete |
| s3 | Bond slip at τf | Gf | fracture energy of concrete |
| N | Axial load applied to the column | GF0 | basic fracture energy of concrete |
| σcol | Max stress in column long. reinforcement | cts | tension stiffening coefficient |
| dy+ | yielding drift value for positive loading | Fmax | positive peak value of load-drift curve |
| AS | steel area at beam bottom or top | Fmin | negative peak value of load-drift curve |
| ASI | beam steel area inside the column width | - | - |
CONSENT FOR PUBLICATION
Not applicable.
AVAILABILITY OF DATA AND MATERIALS
Not applicable.
FUNDING
None
CONFLICT OF INTEREST
The authors declare no conflict of interest, financial or otherwise.
ACKNOWLEDGEMENTS
Declared none.


