All published articles of this journal are available on ScienceDirect.

Damage Identification in Plane Multi-storey Reinforced Concrete Frame
Abstract
Objective:
In this paper, a new method for damage detection in reinforced concrete multi-storey frames is presented.
Methods:
The proposed new methodology is a hybrid technique consisting of two parts. The first step involves determining the seismic pushover capacity curve of the structure, and the second step includes formulating the diagram of the instantaneous eigenfequencies of the structure in the nonlinear regime. With reference to this diagram, more details are given in the text. To estimate the equivalent target displacement defined at the top of the structure, which corresponds to the instantaneous eigenfrequencies of a structure with damage, the diagram of these eigenfrequencies is combined with the seismic pushover capacity curve of the structure. Thus, the target displacement at the top of the frame is calculated.
Result:
The advantage of the proposed methodology is that using this target displacement, the final picture of the damage in the structure is estimated from the two pushover analyses, with positive and negative signs of the floor lateral forces corresponding to triangular distribution in elevation. For clarification, an example of a three-storey R/C frame is presented as a paradigm.
Conclusion:
Using the proposed methodology, the locations of damage in the structure are successfully identified, as well as the Damage Stiffness Matrix is estimated with high accuracy.
1. INTRODUCTION
It is well-known that identification of the dynamic characteristics of reinforced concrete (R/C) structures contributes to the removal of uncertainties in the structure models so as to perform advanced non-linear analyses on the inherent building seismic capacity. Additionally, the identification of eigenfrequencies (and mode shapes) of the structure supports the simple monitoring of a building’s ‘structural integrity’. For this purpose, the main target is to identify the dynamic characteristics of the structure through analytic processing of the measured response, and for this reason, in the past, various stochastic and deterministic procedures have been presented. For example, ‘operational modal analysis’ [1-4], which uses the ‘frequency domain decomposition’ technique was developed. Furthermore, with reference to ambient vibration monitoring, much information is found in the Wenzel and Pichler book [5]. Using the ‘stochastic subspace identification’, various techniques have been proposed, which are based on the classical books by Overschee and De Moor [6], where the measured responses directly harmonize with the parametric models. Three distinct algorithms (principal component, canonical variate analysis algorithms, and the unweighted principal component) have been used in stochastic subspace techniques. In each case, the analysis of random data and operational modal analysis is the base field of analysis of the recorded accelerograms [7-9]. Having known the abovementioned techniques, the “modal time-histories method” was proposed [10]. This last method is suitable for structures subjected to earthquake ground excitation at their base or loaded with strong wind pressure. Using the modal time-histories method, eigenfrequencies, mode-shapes, and modal damping ratios have been calculated in a linear area in various structures [11]. An important method for the detection of damage to a structure is the use of the perturbation matrix, which is based on the theory that a unique minimum rank matrix solution of the underdetermined system exists. Thus, Zimmerman and Kaouk [12, 13] proposed the so-called minimum rank perturbation theory (MRPT), in which a non-zero entry in the damage vector is interpreted as an indicator of damage location. Another technique was given by Domaneschi et al. [14, 15], where the discontinuity of forms of mode shapes was used. Moreover, another technique that uses the artificial neural network was proposed by Nazari and Baghalian [16], but it is suitable for simple symmetric beams. Very interesting works are those of Peeters [3], Amani et al. [17], and Zhang et al. [18], in which the idea of a damage stiffness matrix is presented. However, the detection of the damage to a structure, the detection of the location of the damage on the structure, as well as the importance of all damages, are open issues for investigation. The present paper attempts to cover a significant part of this gap.
1.1. Analysis
We consider a linear multi-degree of freedom system (MDOF) without damping, freely vibrating due to initial forced displacement/velocity. The equation of motion is as follows (Eqs. 1 and 2).
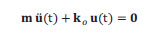 |
(1) |
Where, m and ko are the mass and stiffness matrices, respectively, while u(t) is the time displacement vector of the system. Moreover, we consider that this mentioned system has damage; thus, the stiffness matrix has been changed per ∆ki called the Damage Stiffness Matrix, and therefore, we get:
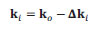 |
(2) |
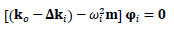
Furthermore, it is known that the mode shapes of a system are defined only in the linear area (Fourier Analysis), while in the nonlinear area, mode shapes are not defined. However, instantaneous mode shapes at each inelastic step of the analysis can be defined. Indeed, if we consider an inelastic i-step of the analysis, where damage has been developed at various positions of the structure, then modal (linear) analysis can be performed using the instantaneous stiffness matrix ki. Therefore, the motion equation is written as follows (Eqs. 3 and 4).
 |
(3) |
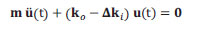
We consider that the nonlinear analysis of a structure has been stopped at i-step. Immediately, we can perform a linear analysis, such as the modal analysis, using as initial conditions the results of the i-step. Therefore, the eigenvalue problem of the inelastic i-step (considering that the mass matrix m is constant) is written as follows:
 |
(4) |
Where, ωi is the instantaneous eigenvalue that gives the circular frequency (in rad/s) and ϕi is the instantaneous mode shape vector of the structure at the inelastic i-step of the analysis. If we ask that the abovementioned eigenvalue problem has a solution with ϕi = 0, then the equation det [(ko - ∆ki) –  m] = 0 must be true. Thus, the unknown eigenvalue ωi obtains values by the roots of the last equation.
Moreover, using an eigenvalue of the , namely  ,g, where g = 1,2,3,.. N, Eq. (4) is pre-multiplied by the
  ,g, so we get:
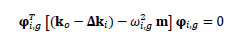 |
(5) |
Eq. (5) can be rewritten as follows:
 |
(6) |
We note that the identification of the instantaneous frequency ωi,g at the inelastic i-step of analysis is impossible to be identified by analysis of the records (namely, by time history of accelerograms) using the Random Data procedure. Indeed, all these procedures demand a sufficient duration of time windows, where the value of the eigenfrequency has to be constant; however, it is not existing. The same is true for the instantaneous mode shape vector ϕi of the structure at inelastic i-step of analysis. Thus, the final conclusion that arises from this analysis is the fact that the obtained records by an installed identification multichannel network system of accelerometers that are analyzed must come from the ambient vibration of a calm structure (with damage) without motion. In this way, we can obtain records with sufficient duration of time windows to estimate the first eigenfrequencies of the structure with damage using a suitable identification system. Last, to estimate the damage of a structure, the case of the strong excitation of the structure is unsuitable because the motion drives the structure deep in the inelastic area, since the structure has various damages. Therefore, if ωi,g, ϕi,g, ko, ∆ki, m are known by the present methodology, then Eq. (6) is essential because this equation is used for verification reasons at the end of the proposed procedure given in the present paper.
2. METHODOLOGY
To estimate the damage on the examined structure, the following two things have to be calculated: (1) the location of the damages on the structure and (2) the number of the damages. For this purpose, a hybrid methodology consisting of an identification system and a numerical model is presented. For the first time, this hybrid methodology is used and it consists of seven phases:
(i) The examined structure is instrumented by a local network of uniaxial accelerometers located at the characteristic positions along the degrees of freedom of the system. By the recorded response accelerograms due to ambient reasons, the first eigenfrequency (or the fundamental eigenfrequency) of the structure (that has various damages) can be estimated using a suitable identification method (e.g., “modal time-histories” method by Makarios [10]).
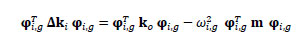
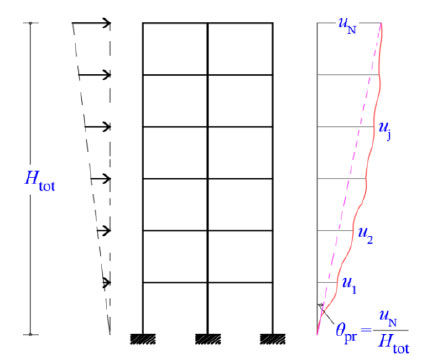
(ii) Simultaneously, a numerical model of the structure, which is suitable for seismic nonlinear static analysis, is created, and the pushover capacity curve of the structure is obtained for the positive and negative signs of the lateral floor forces. In the case of the plane multi-storey reinforced concrete (r/c) frames, this pushover capacity curve can be calculated in terms of roof displacement and base shear force (Fig. 1).
(iii) Next, the diagram of the instantaneous cyclic eigenfrequencies (in Hz) of the structure in the nonlinear area is presented as a function of the roof displacement uN (Fig. 2). This diagram is presented for the first time here, and depicted by the structural analysis program that performs “modal analysis” at each step of the previous pushover analysis (so, at each step, the stiffness matrix of the damaged structure is used since it considers all plastic hinges that have been developed). Thus, this diagram has οn horizontal axis inelastic roof displacement of the examined structure, and on the vertical axis, the eigenfrequency of the structure that is damaged.
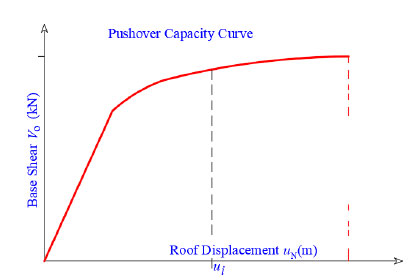
(i) Knowing the fundamental eigenfrequency f1,i of the structure by the (a) phase, this frequency is inserted into the diagram of the instantaneous eigenfrequencies of nonlinear area, and we note the inelastic target-displacement ui on the top of the structure (Fig. 2). We note that all the rest instantaneous eigenfrequencies (f2,i, f3,i, ... fN,i) lie on the y-line (Fig. 2) of the target-displacement ui.
(ii) Knowing the inelastic target-displacement ui on the top of the structure, by (d) phase (Fig. 2), we move on to that step of pushover analyses where this roof displacement has appeared (Fig. 1). The image of the plastic hinges at this step from the two pushover analyses gives the final images of the damage, while these two images superposition to deduce the final damage.
(iii) At the i-step of pushover analysis, (v) phase, using the instantaneous stiffness matrix, a linear modal analysis is performed using as initial conditions the response data of the examined step. From this modal analysis, all circular eigenfrequencies ωi,g and all instantaneous mode shapes ϕi,g are calculated.
(iv) Finally, the instantaneous stiffness matrix ki of the structure is calculated at examined inelastic i-step, so the Damage Stiffness Matrix ∆ki at the same i-step comes from the general relationship ∆ki = ko - ki, where ko is the known Initial Stiffness Matrix of the structure without damage. We note that the mass matrix m of the structure is always known. Afterwards, Eq.(6) can be applied for verification reasons.
2.1. Numerical Example
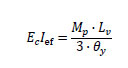
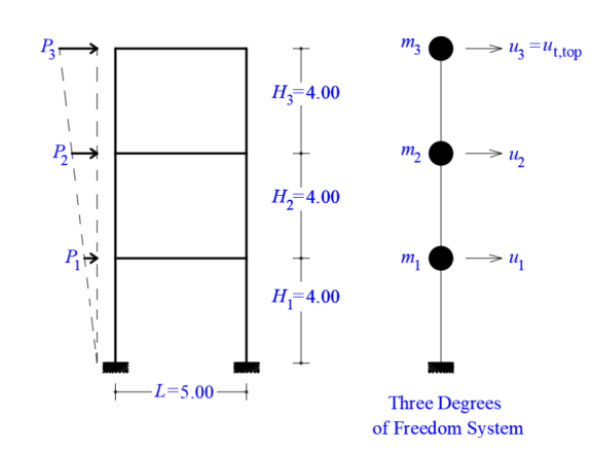
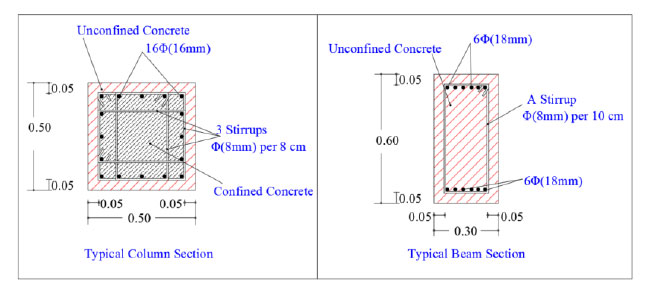
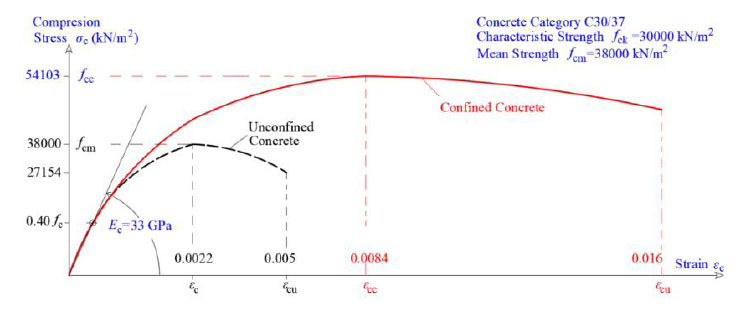
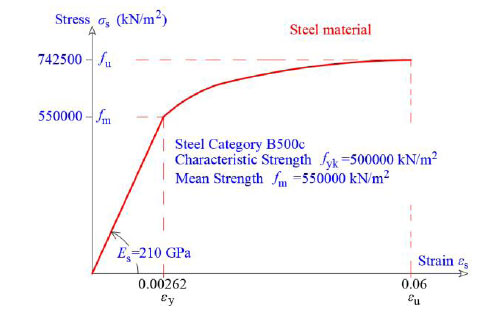
We here consider the plane three-storey reinforced concrete (R/C) frame consisting of two columns on each floor, where the beam length is L=5.00 m and the height of all storeys is 4.00 m, as shown in Fig. (3). All columns have the same section bc × hc = 0.50 × 0.50, where each one is symmetrically reinforced with 16 steel bars (diameter Φ=16mm for each one, Fig. 4). Columns have 3 stirrups in each level with longitudinal space of 8mm axially. The concrete Elasticity Modulus is Ec = 33GPa and the steel Elasticity Modulus is Es = 210GPa. The beam has a rectangular section of Ec x hb = 0.30 x 0.60 with 6Φ18 at the upper and at down fiber of the beam (Fig. 4). The used materials for the columns are unconfined concrete (Fig. 5), confined concrete according to the Mander model [19] for the core of the section (Fig. 5), and steel (Fig. 6). The model of the frame is created using known Structural Analysis Program [20] using fiber models on the sections. The effective moment of inertia of the sections of the r/c members is considered according to Eurocode 1998-3 [5, 21]. Indeed, when targeting the Near Collapse (NC) state, all R/C members have to possess section flexural stiffness EcIef that is calculated by the following (Eq. 7):
 |
(7) |
| θpr | Ief/Ig | θpr | Ief/Ig | θpr | Ief/Ig | θpr | Ief/Ig | |||
|---|---|---|---|---|---|---|---|---|---|---|
| 0. | 1.00 | 0.010 | 0.35 | 0.020 | 0.30 | 0.030 | 0.25 | |||
| 0.001 | 1.00 | 0.011 | 0.30 | 0.021 | 0.25 | 0.031 | 0.20 | |||
| 0.002 | 0.80 | 0.012 | 0.30 | 0.022 | 0.25 | 0.032 | 0.20 | |||
| 0.003 | 0.60 | 0.013 | 0.30 | 0.023 | 0.25 | 0.033 | 0.20 | |||
| 0.004 | 0.50 | 0.014 | 0.30 | 0.024 | 0.25 | 0.034 | 0.20 | |||
| 0.005 | 050 | 0.015 | 0.30 | 0.025 | 0.25 | 0.035 | 0.20 | |||
| 0.006 | 0.40 | 0.016 | 0.30 | 0.026 | 0.25 | 0.036 | 0.20 | |||
| 0.007 | 0.40 | 0.017 | 0.30 | 0.027 | 0.25 | 0.037 | 0.20 | |||
| 0.008 | 035 | 0.018 | 0.30 | 0.028 | 0.25 | 0.038 | 0.20 | |||
| 0.009 | 0.35 | 0.019 | 0.30 | 0.029 | 0.25 | 0.039 + | Eq.(7) |
Where, Mp is the plastic moment of the section, using an ideal elastoplastic model on the diagram of the moment-curvature of the section, Lv is the shear length of the reinforced concrete (r/c) member, where this shear length is taken equal to the half-length of the member (for column and beam, [22]), and θy is the available profile angle (angle of chord) of the half length of the r/c member at yield state that is given approximately by Equation A.10 of Eurocode EN 1998-3.
In the present paper, for targeting the other higher seismic performance level, such as Limited Damage (DL) or Significant Damage (SD) according to Eurocode EN 1998-3, scaling has been applied where the section’s effective moment of inertia Ief has been obtained, as shown in Table 1, by using the profile angle θpr of the structure (Fig. 7).
Afterwards, two pushover analyses are performed with positive and negative signs of the floor lateral forces until the Near Collapse state, using the effective moment of inertia, as defined by Eq. (7). Using as target-displacement of the top of the frame the value that arises from the discrete value of the profile angle θpr shown in Table 1, a pushover analysis is performed. In the last step of this pushover analysis, a modal analysis of the frame (that has various damages) is performed to obtain the instantaneous cyclic eigenfrequencies of the system. This procedure is repeated for each value of the profile angle θpr presented in Table 1, changing the effective moment of inertia for all r/c members according to this table. Thus, the diagram of the instantaneous cyclic eigenfrequencies (in Hz) of the structure in the nonlinear area is estimated as a function of the roof displacement uN (Fig. 8). Furthermore, in the case of a structure, an identification multi-channel system that consists of uniaxial accelerometers is installed, and the records of response accelerations when the structure is quasi-calm (namely due to ambient vibrations) are obtained. From the analysis of the records, by removing the noise and using an identification technique to obtain the dynamic characteristics of the structure, the fundamental eigenfrequency f1 for the i-step of pushover analysis arises.
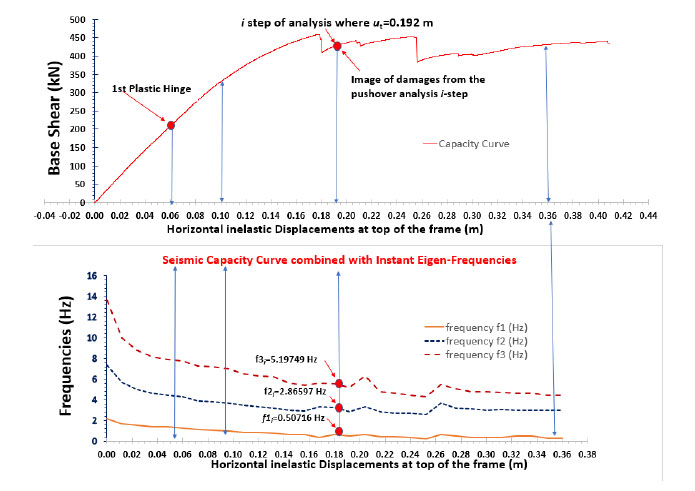
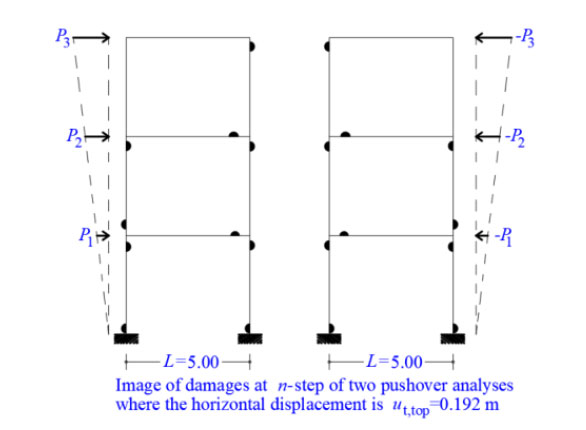
Moreover, using Fig. (2 and 8), the respective displacement uN,i of the top of the frame is obtained. Moreover, using the pushover analysis where the top displacement uN,i appears, the image of damage is obtained. By the superposition of the two images (of the two pushover analyses with positive and negative signs of the lateral forces), the final estimation of the damage is obtained (Fig. 9). It is worth noting that the capacity curve is derived based on the load pattern shown in Fig. (3). Furthermore, it is known that in an earthquake event, the actual load on the structure is different, and this loading changes in each time step; thus, the damage distribution on the frame can be different from that obtained by the push-over analysis. However, on the other hand, the critical parameter in the present methodology is the fundamental eigenfrequency that is identified by the instrumental records using accelerometers. Having knowing the fundamental eigenfrequency of the structure, we can estimate (from Fig. 2 or 8) the equivalent horizontal displacement of the monitoring point on the top of the building, and then the capacity curve is taken into account. Hence, the use of the capacity curve is an auxiliary technique, where the profile of the load pattern, shown in Fig. (3), does not play any role, because the fundamental eigenfrequency of the structure is identified experimentally.
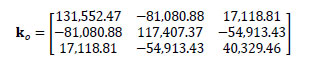
Finally, the instantaneous stiffness matrix ki of the structure at examined inelastic i-step is calculated. Therefore, the Damage Stiffness Matrix ∆ki at the same i-step is deduced from the general relationship ∆ki = ko - ki, where ko is the known Initial Stiffness Matrix of the structure without damage. The initial Stiffness Matrix ko of the structure (with the geometric moment of inertia of all r/c members) is as follows:
 |
The instantaneous Stiffness Matrix ki of the structure (with effective moment of inertia of all R/c members from Table 1) at the i-step is:
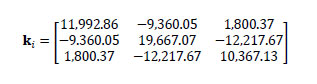 |
Thus, the Damage Stiffness Matrix ∆ki at the same i-step is calculated as follows:
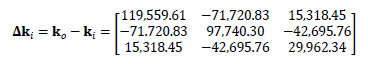 |
3. RESULTS AND DISCUSSION
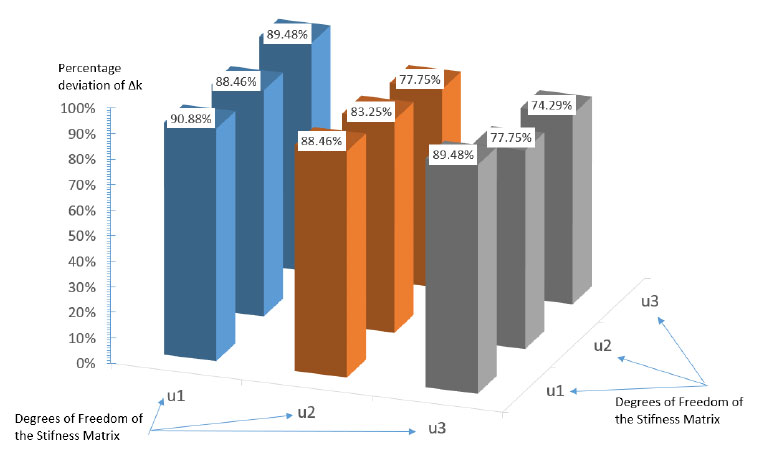
Obtaining the Damage Stiffness Matrix ∆ki from the previous step, we can determine the final percentage deviation term of ∆ki, which is absolutely compatible with the damage (Figs. 9, Fig. 10). These deviations on the diagonal terms of the Damage Stiffness matrix indicate the degree of damage of the plane three-storey r/c frame for the i-step.
The new methodology proposed in this study provides a very good estimation of the degree of damage in a plane multi-strorey R/C frame. However, it is to be noted that, naturally, the seismic phenomenon is as follows:
(i) Initially, the planar multi-storey R/C frame is in ataraxia (at rest).
(ii) Next, a strong seismic ground excitation appears, and the structure vibrates with inelastic floor displacements, which means that there is damage in the structure when it comes back to rest.
(iii) However, the steel bars of the structural members yield plastic hinges. Hence, there are steady deformations of the yielding steel bars, and these steel deformations block the closing of the open cracks, and thus the cracks remain open in all plastic hinges of the structures. The degree of damage to the structure is dependent on the seismic target displacement.
(iv) Afterwards, we apply the first step of the proposed methodology, where the structure is instrumented by a local network of uniaxial accelerometers located at the characteristic positions along the degrees of freedom of the system. Hence, from this step, the real eigenfrequencies of the structure with damage are determined.
(v) Finally, according to the present methodology, and using the diagram of the instantaneous eigenfrequencies in the nonlinear regime combined with the seismic capacity curve of the structure, we can predict the respective degree of damage to the R/C structure.
CONCLUSION
In the present paper, a new methodology that can be applied for the identification of damages in structures (mainly in the case of seismic damage) has been proposed. This methodology consists of seven phases, which are outlined in the methodology section. A hybrid technique has also been presented in this paper, where the pushover capacity curve is combined with the diagram of the instantaneous eigenfrequencies of the structure. The diagram of these instantaneous eigenfrequencies of a structure in the nonlinear regime is a novel idea that is presented here for the first time. Afterwards, having known the inelastic target displacement on the top of the structure, the image of damage on the structure is formed by the respective pushover analysis, where the above-mentioned inelastic target displacement has been calculated. Simultaneously, the instantaneous Stiffness Matrix
CONSENT FOR PUBLICATION
Not applicable.
AVAILABILITY OF DATA AND MATERIALS
Not applicable.
FUNDING
None.
CONFLICT OF INTEREST
The author declares no conflict of interest, financial or otherwise.
ACKNOWLEDGEMENTS
Declared none.
ABBREVIATION
| R/C | = Reinforced Concrete |

