All published articles of this journal are available on ScienceDirect.

The Influence of the Rate of Increase of Ground Vibration Accelerations During Earthquakes on the Value of the Observed Macroseismic Effect
Abstract
Aims:
It is known that along with the traditionally considered amplitudes and durations of ground vibrations, the rate of increase in the intensity of ground vibrations in time can also affect the level of macroseismic effects caused by earthquakes. According to the previously obtained correlations, the differences between the observed macroseismic effects during earthquakes with slow and fast increases in the amplitude level of oscillations can reach one point of the macroseismic scale. The purpose of this study is to obtain, on the basis of a significantly (almost 9 times) larger than before, the volume of initial data (in combination with a more effective method of analysis) new and more accurate quantitative estimates of the studied dependences, as well as their possible interpretation.
Background:
This work continues the research that began in 1985-1989. A representative statistical material was used, including 1250 accelerograms of earthquakes that occurred in different regions of the world, with magnitudes M = 2.5-7.7, distances of 5-230 km and independent estimates of macroseismic intensities I = 3-10 points by the MSK or MMI.
Objective:
Correlations between the absolute and relative rates of increase of ground vibration accelerations during earthquakes with different magnitudes and distances, on the one hand, and macroseismic effects caused by these vibrations, on the other, are considered.
Methods:
The study was carried out in the form of a direct statistical comparison of the parameters describing the form of ground vibrations during earthquakes with the characteristics of variations in macroseismic effects caused by these vibrations. A sample was formed and analyzed, including 1250 accelerograms of sensible and strong earthquakes recorded in various regions of the world and having independent estimates of the macroseismic intensity of shaking at instrumental registration sites.
Results:
It is shown that the macroseismic intensity of shaking can depend on the relative rate of increase of acceleration amplitudes in the general wavetrain of ground vibrations. An increase in the macroseismic intensity of shaking was observed with an increase in the relative rate of increase of the amplitudes and, conversely, it decreases with a slowdown in the rate of increase of the acceleration intensity. Similar constructions, made according to the data of the Time-Frequency Signal Analysis (TFSA) of 50 accelerograms of earthquakes with M = 3.3-6.2, a distance of 7-139 km and a macroseismic intensity of 4-7 MMI points, showed the same dependence, but clearer and with large coefficients of regression and correlation. The difference between earthquakes with “fast” and “slow” accelerations in the intensity I can reach one MSK point.
Conclusion:
The results of this study indicate that the rate of increase in the acceleration of ground vibrations during earthquakes can in a certain way affect the macroseismic effects. Earthquakes with slowly increasing amplitudes of ground vibration accelerations form average less macroseismic effects than those with rapidly growing accelerations.
Variations in the shaking intensity, at the same time, are quite significant and can be compared with variations associated with differences in soil-geomorphological conditions, focal mechanisms, general seismotectonic conditions and other factors that are traditionally taken into account in detailed assessments of seismic hazard. Therefore, this factor should also be taken into account when conducting such studies.
1. INTRODUCTION
Historically, a quantitative description of the negative consequences of strong earthquakes began to be carried out in the form of points of macroseismic scales. Later, with the development of networks of strong-motion stations in various regions, it became possible to obtain data on “quake” in the form of physical characteristics of ground vibrations, which allow understanding better the nature of seismic phenomena, as well as make calculations of structures for seismic resistance. However, due to insufficient technical equipment, obtaining such data even today is not possible in each of the seismically active regions of the world. The second limitation is a relatively short period (less than 90 years), during which instrumental observations of strong motions are generally conducted. In this sense, the data of macroseismic observations are often more representative since they cover much larger territories and time intervals, reaching hundreds and even thousands of years in historically developed regions. To date, a lot of such regions (including Russia) have accumulated extensive macroseismic material, including data on the strongest earthquakes in these regions, that is especially important for predictive estimates. For this and some other reasons, estimates of the intensity of seismic shocks are widely used in seismic zoning, earthquake engineering, insurance, seismic risk management and other areas [1-9].
Thus, the simultaneous use in modern seismology of two types of data obtained by “instrumental” and “macroseismic” methods is a historically developed and useful reality, which, in turn, sets the task of these two types of estimates. The study was converted into each other. Many researchers have been working on solving this problem by constructing various correlation ratios (both global and regional) between the parameters of strong motions and macroseismic intensity for several decades. The intensity magnitude in points is usually compared with the maximum amplitudes, durations and periods of vibrations (accelerations, velocities, displacements) of the ground, Fourier spectra and response spectra, integral characteristics of strong-motion recordings (cumulative absolute velocity, Arias intensity) [10-21]. The investigated ratios can take the form of both “direct” or “instrumental” dependencies when the intensity is a function of the strong motion parameter, and “inverse” dependencies when the strong motion parameter is a function of macroseismic intensity. Direct dependencies can be used for fast construction of shake maps that simulate the distribution of intensity for real [22-25] and scenario [1, 26] earthquakes. Inverse dependencies make it possible to estimate the engineering parameters of vibrations during historical earthquakes according to the available macroseismic data. The above dependencies (both direct and inverse) can also be used to assess the “level of conformance” in the estimates of various parameters of the predicted seismic impacts as a quality criterion for these estimates [27].
Correlations between macroseismic intensity and Fourier amplitude spectrum [10, 28-30] allow making various types of seismic hazard assessments, both in deterministic and probabilistic forms. Based on the “intensity-Fourier spectrum” relationships, a technique has been developed that allows reconstructing the probable spectrum of ground vibration accelerations during a strong earthquake according to the macroseismic field recorded during this earthquake [31].
In support of the relevance of the above issues, they note, for example, that the intensity of earthquakes in terms of the Japanese Meteorological Scale (JMA) is determined according to the records of ground acceleration [32].
The above brief review shows that a comprehensive assessment of seismic impacts in the form of points of macroseismic scales and physical parameters of ground vibrations is one of the main aspects of studying earthquakes and associated hazards. Simultaneously, the analysis of the relationship between macroseismic intensity and parameters of ground vibrations, respectively, seems to be one of the primary importance tasks. In this regard, it should be noted that the above correlations, used for their solution, are characterized by a large standard error. For Californian earthquakes, for example, such an error, according to [33], ranges from 0.6 to 0.8 points depending on the considered parameter of vibrations. In this regard, the problem of reducing errors in the relationship “intensity - soil parameter” is very urgent. To lessen this error, various researchers traditionally considered the account of the influence of such factors as earthquake magnitudes, their remoteness and local soil conditions [34]. Apparently, the rate of increase in the intensity of ground vibrations in time as one of the factors was previously considered in the work of one of the authors [10] for the first time. According to the correlations obtained in this work, the differences between the observed macroseismic effects during earthquakes with slow and fast increases in the amplitude level of vibrations can reach one point of the macroseismic scale. Moreover, among the considered various kinematic characteristics of seismic ground vibrations (accelerations, velocities and displacements) the most definite dependencies were obtained from the acceleration records. Simultaneously, these dependencies were characterized by low regression and correlation coefficients, which left questions about their practical and other significance unanswered and defined them, in this context, not as a final product, but as a prospect for the further consideration and clarification.
As far as we know, the analysis of such relationships has not been carried out yet by other researchers. This article describes our continuation of the research begun in [1]. The purpose of these studies is to obtain new and more accurate quantitative estimates of the investigated dependencies based on the involvement of a much larger (almost 9 times) volume of the initial data in combination with the use of a more effective technique for their analysis, as well as to propose their possible interpretation.
2. INITIAL DATA AND RESEARCH METHODS
This study was carried out in the form of a direct statistical comparison of the parameters describing the form of ground vibrations during earthquakes with the characteristics of variations in macroseismic effects caused by these vibrations. Following the above-mentioned results of our previous studies, a sample was formed and analyzed, including 1250 accelerograms of sensible and strong earthquakes recorded in various regions of the world and having independent estimates of the macroseismic intensity of shaking at instrumental registration sites. A summary of these earthquakes and the records obtained from them are given in Table 1. As shown in Table 1, this work uses the records of ground vibrations during earthquakes with a quite widespread in magnitudes, distances, regional seismotectonic and local soil-geomorphological conditions, with different mechanisms of movement in the source and macroseismic effects of different intensity. It has been done to form some “average” sample, which, if possible, would take into account and, accordingly, level out various seismic and geological conditions for the occurrence of earthquakes, the features of which, generally, can affect the phenomenon under consideration as such. The only limitation, in this sense, is that only shallow “crustal” earthquakes are presented here, which, in most cases, represent the greatest danger.
For small earthquakes (M≤5), the records of ground vibrations, evaluations of macroseismic intensity and other data indicated in Table 1 were taken, mainly based on research materials carried out at different times by the IS of the Academy of Sciences of Uzbekistan, IPE RAS, IMGG FEB RAS [35-37]. The initial data for larger earthquakes were taken from the strong motion databases [38, 39], as well as from publications [11, 40-50].
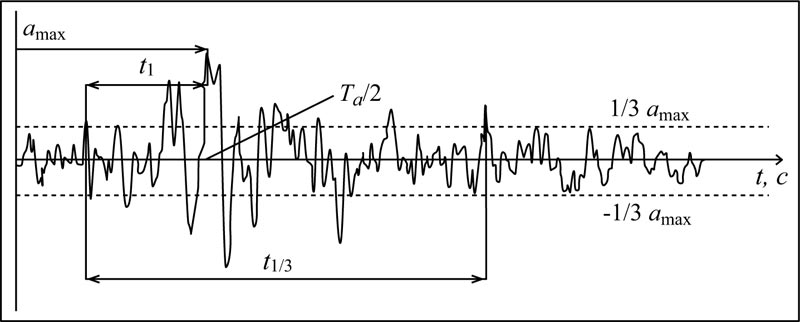
For a quantitative description of the forms of records, each accelerogram was characterized by the ratio of the rise time of acceleration amplitudes from 1/3 of the maximum values to the maximum (t1) to the total duration of vibrations with amplitudes of at least 1/3 of the maximum (t1/3). As our previous studies showed, the parameter t1/t1/3is the most informative in this case. Fig. (1) shows the general scheme for the measurements of the above parameters t1 and t1/3, used in the present research, as well as the maximum amplitudes (amax) and visible periods of accelerations with maximum amplitude (Ta). For better ensuring the statistical representativeness of the sample, in addition to the accelerograms with “average” values of t1/t1/3 that constitute the bulk of the sample, we tried to include as much as possible the rarer records with the highest and lowest values of this parameter.
| Region; Earthquake | Number of Records | Magnitude | Distance(km) | Intensity (MSK, MMI) |
|---|---|---|---|---|
| US West; 1933-1969 | 136 | 4,4-7,7 | 4-210 | 3-9 |
| San Fernando; 09.02.1971 | 128 | 6,5 | 8-105 | 5-10 |
| Gazli; 17.05.1976 | 3 | 7,3 | 25 | 10 |
| Gazli; 1976 | 40 | 2,5-5,3 | 5-45 | 2,5-7 |
| Friuli; 1976 | 50 | 3,8-6,2 | 7-139 | 4-8 |
| Montenegro; 15.04.1979 | 22 | 7,0 | 9-110 | 5-9 |
| Coyote Lake; 06.08.1979 | 8 | 5,7 | 10-14 | 7-8 |
| Imperial Valley; 15.10.1979 | 22 | 6,5 | 6-31 | 7-9 |
| Coalinga; 02.05.1983 | 93 | 6,7 | 10-68 | 5-8 |
| Morgan Hill; 24.04.1984 | 58 | 6,1-6,2 | 5-73 | 4-8 |
| MorganHill; 1984 | 2 | 3,1-3,7 | 13-14 | 3 |
| Gazli; 1984 | 10 | 3,0-5,1 | 7-24 | 2,5-6 |
| Pap; 1984 | 34 | 2,5-4,8 | 13-23 | 2,5-7 |
| North Palm Springs; 08.07.1986 | 59 | 6,2 | 5-83 | 5-8 |
| Whittier Narrows; 01.10.1987 | 84 | 6,1 | 7-108 | 4-8 |
| Spitak; 07.12.1988 | 2 | 6,9 | 40 | 8 |
| Loma Prieta; 18.10.1989 | 114 | 7,0 | 7-137 | 4-9 |
| Cape Mendocino; 25.04.1992 | 24 | 7,0 | 5-60 | 6-9 |
| Landers; 28.06.1992 | 73 | 7,2 | 14-195 | 4-8 |
| Northridge; 17.01.1994 | 49 | 6,7 | 2-150 | 4-9 |
| Kobe; 16.01.1995 | 6 | 6,9 | 10 | 9-10 |
| Iran; 1997 | 3 | 7,3 | 55-70 | 7 |
| Тurkeу; 1999 | 37 | 6,8-7,7 | 10-85 | 6-9 |
| Chi-Chi; 21.09.1999 | 48 | 7,6 | 2-23 | 9 |
| Hector Mine; 16.10.1999 | 117 | 7,1 | 48-223 | 4-8 |
| Azores | 2 | 5,0 | 5 | 7 |
| Greece | 7 | 4,3-6,8 | 10-118 | 4-8 |
| Far East | 19 | 3,4-6,5 | 20-87 | 3-6 |
| Total | 1250 | 3,4-7,7 | 2-223 | 2,5-10 |
To describe the changes in macroseismic intensities for each accelerogram, the value ΔIФ= IН-IР was calculated, where IН is the observed intensity at the registration point of the accelerogram, and IР is the calculated intensity of shaking or the force of shaking that can be expected based on the average (i.e., excluding the form factor of the record) estimates. Hereinafter, the value ΔIФ will be denoted by the term “intensity increment”, which is widely used in seismic microzonation with a similar, but still with a different meaning.
Overwhelmingly (more than 90%) the IР value was estimated by the intensity calculated from the Fourier amplitude spectrum corresponding to the given accelerogram. This is the main methodological difference of this work from our previous studies, in which not the levels of spectral densities of accelerations, but single parameters of vibrations are used for the assessment of IР and, accordingly, ΔIФ (see Fig. (1)). Estimates of the IР value by the spectrum seem to be preferable for two reasons. The first is that the intensity of shaking (as it is shown earlier, e.g [10].) correlates better with the levels of Fourier spectra at certain frequencies (which are specific for earthquakes of different strengths) than with other dynamic characteristics of ground vibrations. The second is the invariance of the amplitude spectra concerning the shape of the analyzed record.
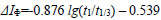
A detailed description of various options for assessing the intensity of shaking by the spectrum of ground vibrations can be found in [10]. In the present work, we only briefly described the main elements of the model of this research. Here is used the variant, which assumed that the macroseismic effect (12-point intensity scale) of an earthquake is formed mainly by ground vibrations at frequencies “responsible” for the given intensity of shaking and the contribution of other frequencies of the spectrum can be neglected. In this case, the condition for the intensity not to be exceeded is the condition that the spectrum level at the frequency “responsible” for the macroseismic effect of a given force (ƒi) does not exceed the spectral density level assigned to this intensity (I = i). This condition is necessary but not sufficient since the frequencies “responsible” for macroseismic effects of different strengths, generally speaking, are different.
A necessary and sufficient condition for non-exceedance the intensity I = i is the condition under which the observed spectrum at the “responsible” frequency ƒi does not exceed the level assigned to the intensity I = i, as well as the condition under which the observed spectrum (at other frequencies “responsible” for the macroseismic effect of greater strength (I = j>i)) does not exceed spectral density levels assigned to the intensity I = j> i. Spectral densities assigned to different intensity levels are given as probability distribution functions. Therefore, their non- exceedance (or exceedance) is a random event, the occurrence of which can be expected only with a certain probability, which, in its turn, determines the probability of non-exceedance (or exceedance) the intensity I = i for a given observed spectrum of ground vibrations during an earthquake. Thus, a random event – non-exceedance of the shaking intensity I = i – is equivalent to a combination of random events, i.e. to a non-exceedance by individual spectral components of the sets of intensity levels assigned to the intensity I = i, i + 1, i + 2,…, 12 points.
Based on the above, the following expression was used to calculate the probability distribution function of the intensity non- exceedance:
 |
(1) |
Here aj and σj are the mean value (mathematical expectation) and the standard of the value x = lg|S|, assigned to the intensity I = i at the frequency ƒi, “responsible” for the macroseismic effect of the given force; xj is the value of the logarithm of the observed spectrum of ground vibrations at the frequency ƒi; xmin is a sufficiently small value (usually equal to aj-5σj). Table 2 shows the values of aj and σj used in the present work.
The intensity assessment by the distribution function (1) was carried out in two ways: by its level corresponding to the non-exceedance probability equal to 0.5 and by the point at which the maximum of its first derivative is recorded. Finally, the IР value was calculated as the mean of these two assessments.
In cases where the spectrum of the accelerogram was absent for various reasons, the estimation of its calculated intensity was conducted using the functional [51]:
 
|
(2) |
where M is the magnitude of the earthquake; Iр is measured in MSK points; PGA - in cm/s/s; Тa, and t1/3 - in s.
In addition to the above-described main volume of the initial data represented by earthquake accelerograms, a certain amount of the initial data, where ground vibrations during earthquakes are presented not just in the form of accelerograms, but in the form of spectral-time sweeps of these accelerograms, was also considered. In total, TFSAdiagrams were analyzed, calculated from 50 records of earthquakes that occurred in the Friuli area in 1976 (Table 1).
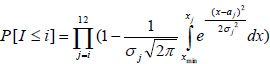
According to the calculated TFSA acceleration diagrams, the nature of time behavior of the envelope amplitudes (or the recording form) for each frequency filter in the frequency range 0.78 - 13 Hz was determined. The value t1*/t1/3* was used to parameterize the recording form of each frequency component by analogy with the above-described analysis of the accelerogram shape. The measurement method and the physical meaning of the parameters t1* and t1/3*are illustrated in Fig. (2), where the time on the accelerogram is plotted on the abscissa, and the level of envelope amplitude is plotted on the ordinate.
In the analysis of TFSA diagrams, the ΔIФ values are taken the same as in the analysis of accelerograms.
The paper does not consider accelerograms with ΔIФ values, which exceed in absolute value two points, since for physical reasons, it seems unlikely that these few (but occurring) emissions are directly related to the considered causal relationship.
Statistical processing of the initial data was carried out using standard procedures of regression, correlation and dispersion analyses.
3. RESULTS AND DISCUSSION
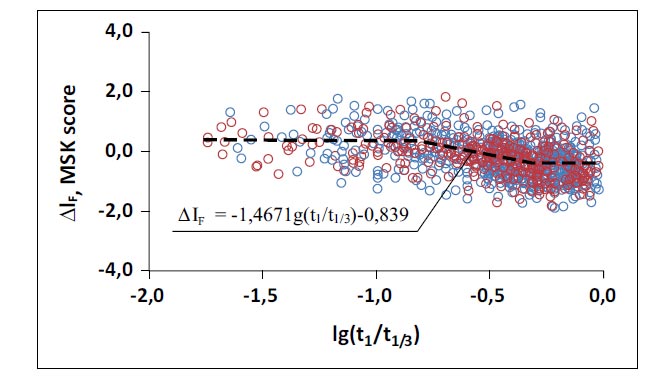
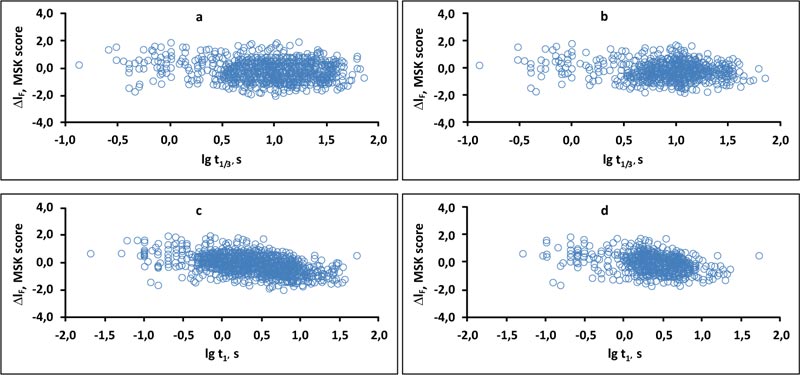
Fig. (3) shows a graph in which the values of the shape parameter lg(t1/t1/3), determined for each of the analyzed accelerograms, are matched with the intensity increments ΔIФ calculated from the same accelerograms. The data shown in the figure are divided into those related to “strong” earthquakes (Iн ≥ 6 MSK or MMI) and related to “moderate” and “sensible” earthquakes (Iн< 6 MSK or MMI). This division is made to clarify the degree of influence of this factor on the dependences we are considering. As can be seen from the figure, this influence is minimal, and in further constructions, the data on “stronger” and “less strong” earthquakes are considered together.
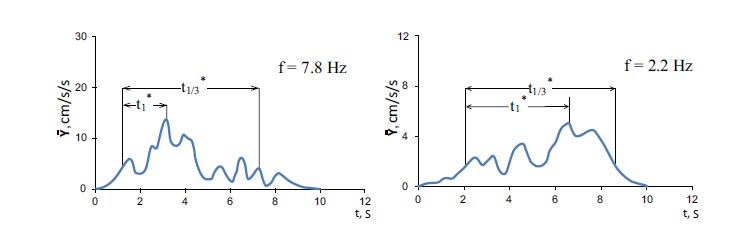
If we approximate the data shown in Fig. (3) with a simple linear regression equation, we get the expression:
|
(3) |
where ΔIФis measured in MSK or MMI points; t1 and t1/3- in s and r is the correlation coefficient.
However, upon a more detailed examination of the data shown in Fig. (3), one can see that the relationships between the values of ΔIФ and t1/t1/3 are not the same at different intervals of values of t1/t1/3. At small values of lg(t1/t1/3) the values of ΔIФ change little with a change in the shape parameter t1/t1/3. With an increase in the values of t1/t1/3, starting approximately from the values of log (t1/t1/3) ≈ - 0.85, the intensity increments begin to alter markedly in inverse proportion to the change in lg(t1/t1/3). With a further increase in t1/t1/3, starting from the values lg (t1/t1/3) ≈ - 0.30, the calculated intensity increments ΔIФ stabilize again. In this case, piecewise-linear approximation gives the following regression equations and correlation coefficients:
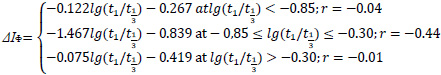 |
(4) |
where the conventions are the same as in expression (3).
Expression (4) shows that in the range of values of the shape parameter lg(t1/t1/3) from -0.85 to -0.30, the intensity of the dependence of ΔIФ on (t1/t1/3) increases significantly and the regression coefficient becomes equal to -1.467 versus -0.876 in expression (3). But at the same time, the correlation coefficient remains low (even slightly lower than in expression (3)), which from a formal point of view can be interpreted as an indication of a weak relationship between ΔIФ and (t1/t1/3). At the same time, this behavior of the correlation coefficient, in this case, can be explained by a reduction in the range of values (t1/t1/3) in which the above-mentioned increase in the regression coefficient occurred. Indeed, if the regression coefficient observed in the range lg(t1/t1/3)=-0.85÷-0.30 continues beyond this range, then the correspondingly corrected real ratios of the values ΔIФ and lg(t1/t1/3) will have a higher (than in expression (3)) correlation coefficient r = -0.65.
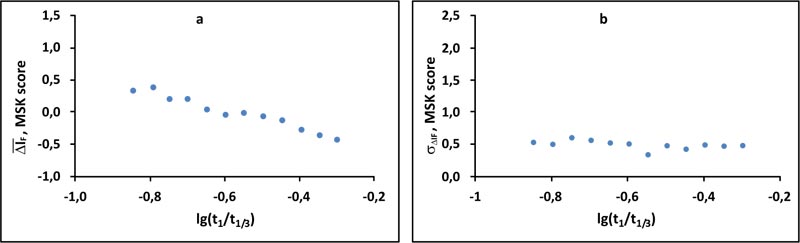
The relatively high scatter of individual ΔIФ values observed against the background of the general trend can be explained by the real accuracy of estimates of ΔIн and ΔIр (about 0.5 MSK points), as well as the accuracy of measurements on the accelerograms of the parameters t1 and t1/3. Indeed, the connection between the strength of shaking and the relative rate of increase in the acceleration amplitudes is manifested more clearly when considering not individual values of ΔIФ and Δlg(t1/t1/3), but their average (and under the assumption of a lognormal distribution of the most probable ΔIФ values) values calculated for elementary intervals Δlg(t1/t1/3), into which the considered range of values log lg (t1/t1/3) = - 0.85 ÷ - 0.30 is divided with a step of 0.05 (Fig. 4a). The analytical expression that approximates the data in Fig. (4a) and the corresponding correlation coefficient in this case is:
|
(5) |
where the conventional signs are the same as in expressions (3 and 4).
The standard deviations of the intensity increments σΔIФ, calculated for the above elementary intervals of lg(t1/t1/3) values, range from σΔIФ = 0.36 MSK to σΔIФ = 0.62 MSK and in average areσΔIФ = 0.51 MSK. In a graphical form, the distribution of the σΔIФ values over elementary intervals is shown in Fig. (4b).
Thus, the above results may indicate the presence of a relationship between ΔIФ and t1/t1/3. This relationship is expressed in the fact that earthquakes with higher relative growth rates of ground vibration accelerations form larger macroseismic effects than earthquakes with lower relative growth rates of seismic vibration intensity. At the same time, it can be assumed that this effect may be associated not with the parameter t1/t1/3, but simply with t1/3. Indeed, it has long been known [12, 14]. that the observed intensity of earthquakes increases (all other things being equal) with an increase in the duration of ground vibrations. Then, if, for example, with an increase in t1/3 the value oft1 is simultaneously maintained or rather slowly increases (and thus t1/t1/3 decreases), an increase in the value of IН and, accordingly, ΔIФ will be observed. To clarify this issue, the corresponding comparisons were made for the analyzed data sample. Their results are shown graphically in Fig. (5a and 5b).
| Model Parameters | I, MSK point | |||||||||
|---|---|---|---|---|---|---|---|---|---|---|
| III | IV | V | VI | VII | VIII | IX | X | XI | XII | |
| aj,sm/s | -0,57 | -0,10 | 0,37 | 0,84 | 1,31 | 1,78 | 2,25 | 2,72 | 3,10 | 3,30 |
| σj | 0,15 | 0,15 | 0,12 | 0,10 | 0,09 | 0,09 | 0,09 | 0,09 | 0,09 | 0,09 |
| Fres, Hz | 10,0 | 10,0 | 7,8 | 4,8 | 3,6 | 1,68 | 1,0 | 0,78 | 0,78 | 0,78 |
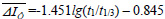
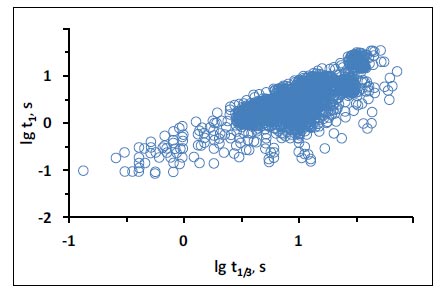
The regression and correlation coefficients calculated from these arrays are, respectively, equal to 0.266 and -0.151 for the entire data volume and -0.240 and -0.147 for accelerograms with -0.85≤lg(t1/t1/3)≤-0.30. Additionally, by the analyzed data sample, the relations between the parameters t1 and t1/3 (Fig. 6), which showed that in our case the values of t1 grow in direct proportion to the value of t1/3, were considered. The regression coefficient (equal to 0.87) is quite high, which contradicts the above hypothesis about the possible decisive influence of the parameter t1/3 on the intensity increment ΔIФ.
Conducted constructions, therefore, show that the dependences ΔIФ(t1/3) are very weak and they cannot explain the above relationships between ΔIФ and t1/t1/3.
The results of similar constructions, performed for the same purpose concerning the parameter t1 and in the form of graphs shown in Fig. (5c and 5d), give the coefficients of regression and correlation, respectively, -0.620 and -0.429 for the entire amount of data and -0.438 and -0.273 for accelerograms with -0.85≤lg(t1/t1/3)≤-0.30. Here the dependence ΔIФ(t1) is expectedly stronger than the dependence ΔIФ(t1/3) considered above, but still not strong enough to alternatively explain the above expressions (3) and, especially, (4 and 5).
Thus, the totality of the results obtained indicates that among the considered alternatives, the most probable and significant reason for the change in the intensity increments can be considered precisely the relative rate of increase in the intensity of accelerations t1/t1/3. By combining expressions (4 and 5), this dependence can be represented as a final expression:
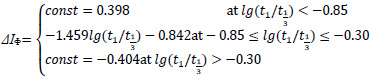 |
(6) |
where, the conventional signs are the same as in expression (3).
Similar constructions are made according to the data of the time-frequency signal analysis of accelerograms (see above). Two versions of such constructions have been made. The first option is when the intensity increments ΔIФ calculated for the analyzed accelerograms are compared with the values of the shape parameter of the envelopes t1*/t1/3* (Fig. 2), determined for the corresponding spectral components with the same frequencies. The second option is when the above values of ΔIФ were put in accordance with the values of t1*/t1/3*, estimated from the envelopes of spectral components with different frequencies, “responsible” (Table 2) for the magnitude of the macroseismic effect (Iн) observed during this earthquake.
Estimates for the first option showed a weak dependence of ΔIФ on t1*/t1/3* both within the entire considered range of values t1*/t1/3*, and in a narrower range -0,85≤lg(t1*/t1/3*)≤-0,30. Even for the frequencies at which the maxima of the spectra and amplitudes of the ground vibration accelerations are usually observed, the regression and correlation coefficients in absolute value do not exceed the values of 0.65 and 0.5, respectively. For other frequencies, these figures are even lower.
In the case of estimates according to the second option, the situation changes significantly, which is demonstrated in Fig. (7) and approximating expressions (7). Here, the behavior of the ΔIФ value when changing the shape parameter t1*/t1/3* is fundamentally the same as when changing the values t1/t1/3 (Fig. 3). The difference lies in higher regression coefficients and, especially, the correlation between ΔIФ and lg(t1*/t1/3*) in the range -0.85≤lg(t1*/t1/3*)≤-0.30, where it is r = - 0.891. It is also important that these estimates are obtained directly from the data of individual measurements and not from the average values, as was done in the estimates corresponding to expression (5).
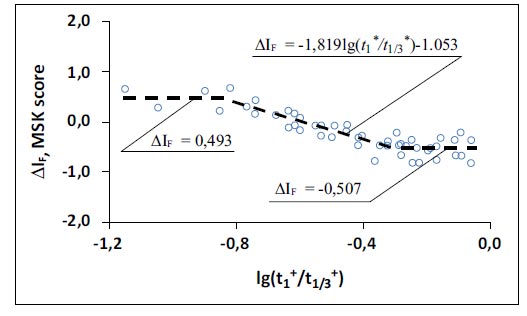
Piecewise-linear approximation of the considered dependence of ΔIФ on t1*/t1/3*:
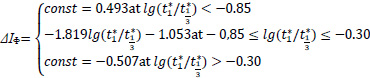 |
(7) |
where, ΔIФis expressed in MSK or MMI points; t1* and t1/3* in s.
Thus, the data of the analysis of spectral-temporal sweeps not only confirm the above-considered estimates obtained directly from the accelerograms but show even clearer dependences of the levels of the observed macroseismic effects on the increased rate of the ground vibration accelerations. It also should be emphasized that these results also indicate an important role in the formation of macroseismic effects of earthquakes, ground vibrations of precisely “responsible” frequencies, which we have already described in sufficient detail earlier [10].
The idea of the “responsible” frequencies, in our opinion, can be quite organically entered into a possible physical interpretation of the above-described dependences of ΔIФ on t1/t1/3. Or on the contrary, the observed dependences of ΔIФ on t1/t1/3 can be interpreted within the framework of our ideas about the “responsible” frequencies. Based on these ideas, the explanation of the results described above in general terms can be considered on the example of a building or structure exposed to seismic effects. The behavior of buildings or structures of a building or structure, in this case, is a suitable example because more than 90% of the accelerograms of this study fall on earthquakes with Iн ≥ 4.5 MSK points, and in this intensity range, according to the MSK and MMI scales, buildings and structures are the main indicators for determining the strength (intensity) of earthquakes.
Based on the foregoing, we will assume that before the earthquake, the object had no defects and it can be conditionally considered elastic and having its characteristics, including the frequency of natural vibrations and the frequency of overtones. After the onset of shaking, first small, and then ever-increasing defects (cracks, collapses, etc.) gradually appear in it. As a result of the growth of these defects, the object becomes less and less “elastic”. This happens, among other things, since “plastic hinges” appear in the emerging cracks, in which deformations (and the associated growth of cracks) depend not only on the acting forces (on accelerations) but also on the “pumped-in” energy in them (from the speed of ground vibration). And the intense velocities of seismic vibrations, as is known, are observed already at lower frequencies than accelerations. As a result of the accumulation of defects, the object, so to speak, “adapts” to the seismic impact, changes its initial characteristics - including a decrease in the frequency of natural vibrations and vibrations of its individual elements. Thus, having received the initial damage, the object, seems to “come out” from under the influence of seismic ground vibrations of the initial frequency. In this case, for the further growth of macroseismic defects, not only an increase in the vibration intensity is required, but also a shift of their spectrum to the low-frequency region. Such a mechanism can, in principle (on a qualitative level, of course) explain the previously revealed existence of a connection between the strength (intensity) of ground shaking and the “responsible” frequencies of ground vibrations, a distinctive feature of which is the trend towards their decrease with increasing value of I. The same mechanism can be applied to explain the results of this study. Indeed, if, for example, intense accelerations do not arise immediately, but increase gradually, then, according to the hypothesis put forward, they may have a lesser effect on the formation of macroseismic effects, since the object has time to change its properties and, thereby, reduce their influence in comparison with the same accelerations, but arising at the beginning of the shaking process.
The consequences of the Gazli (1976 and 1984) and Pap (1984) earthquakes (intensities 8-9 and 7-8 MSK, respectively) can serve as a certain confirmation of the stated hypothesis [10]. Here, the objects, which were severely damaged as a result of the first strong shocks, suffered from relatively weak additional damage during repeated earthquakes of approximately the same intensity, while the similar objects that were relatively well preserved (or newly built, as in the case of the Gazli earthquakes of 1976 and 1984) after the first earthquakes, suffered significantly after the repeated impacts.
From the same point of view, it is possible to interpret the results obtained earlier in the Central research institute of building construction named after V.A.Kucherenko. Here, tests of building structure elements were carried out on a vibrating platform. These experiments showed (data of A.M. Zharov and J.M. Eisenberg) that with an increase in the vibration acceleration of the platform base, damages appeared in the tested structures, which at first increased rather quickly, but then the rate of their growth slowed down even after reaching certain levels of damage acceleration ceased to grow, although the acceleration continued to grow. But, at the same time, the frequency of vibrations of the platform bases remained constant. Thus, the data of experiments on a vibrating platform also do not contradict the above hypothesis.
CONCLUSION
Summarizing the above, we can conclude the following.
The results of this study indicate that the rate of increase in the acceleration of ground vibrations during earthquakes can in a certain way affect the macroseismic effects formed by these vibrations. Earthquakes with slowly increasing amplitudes of ground vibration accelerations form on average less macroseismic effects than those with rapidly growing accelerations.
Variations in the shaking intensity, at the same time, are quite significant and can be compared with variations associated with differences in soil-geomorphological conditions, focal mechanisms, general seismotectonic conditions and other factors that are traditionally taken into account in detailed assessments of seismic hazard. Therefore, this factor should also be taken into account when conducting such studies.
However, at the moment, it is difficult to recommend any practical way of predicting these effects in real seismic-geological conditions. The development of such methods, in our opinion, may be the subject of further research.
CONSENT FOR PUBLICATION
Not applicable.
AVAILABILITY OF DATA AND MATERIALS
The data that support the findings of this study are available from the corresponding author [V.Z.] upon reasonable request.
FUNDING
The research was carried out within the state assignment of Ministry of Science and Higher Education of the Russian Federation (Theme No. 0196-2019-0069).
CONFLICT OF INTEREST
Dr. Vladislav Zaalishvili is the Editorial Board Member of The Open Construction & Building Technology Journal.
ACKNOWLEDGEMENTS
Declared none.

