All published articles of this journal are available on ScienceDirect.

Behavior of High-Strength Self-Consolidated Reinforced Concrete T-Deep Beams
Abstract
Background:
When a beam is loaded on two opposite faces and the beam’s depth is increased such that either the span-to-depth ratio is smaller than four or the shear-span-to-depth ratio is less than two, it will behave like a deep beam. Strain distribution in deep beams is different from that of ordinary beams because it is nonlinear along with the beam depth. If the beam is cast monolithically with a slab in the slab–beam system, it is considered a T-deep beam. The behavior of the resulting member is more complicated.
Objective:
The effect of flange width on the behavior of high-strength self-consolidated reinforced concrete T-deep beams was investigated.
Methods:
Experimental and numerical studies were conducted. Two shear span-to-depth ratios (1.25 and 0.85) were adopted for two groups. Each group consisted of four specimens: one rectangular beam that served as a reference beam and three flanged beams with flange widths of 440, 660 and 880 mm. All specimens had an overall depth of 450 mm, a width of 160 mm and a total length of 1600 mm. The tests were performed under a two-point load with a clear span of 1400 mm. A nonlinear analysis was also performed using ANSYS software.
Results:
Throughout the study, the performance of the T-deep beams has been investigated in terms of cracking loads, failure loads, modes of failure, loading history, rate of widening of cracks and ductility index. Results revealed that such parameters have a different ranges of effect on the response of T-deep beams. Calibration of the ANSYS model has been done by comparing results of load-deflection curves, cracking and failure loads with that obtained experimentally.
Conclusion:
The study’s results indicated that increasing the flange width yielded an 88% improvement in the failure load and an approximately 68% improvement in the cracking load. This positive effect of flange width on the failure load was more pronounced in beams with higher shear span to- depth ratios and flange widths of 660 mm. In addition, the beam’s ductility was improved, especially in cases corresponding to a higher shear span-to-depth ratio.
The finite element simulation showed good validation in terms of the load-deflection curve with a maximum failure load difference of 9%. In addition, the influence of longitudinal steel reinforcement on the behavior of such members was studied. Some parameters that reflect the effect of changing the flange width on the behavior of deep beams were also presented. Increasing the flange width is more effective when using normal strength concrete than when using high-strength concrete in terms of cracking load, beam stiffness, and failure load.
1. INTRODUCTION
A deep beam can be defined as a member that is loaded and supported on two opposite faces on which struts may create supports and loads with a shear span-to-depth ratio of less than two or a clear span-to-depth ratio of less than four [1]. The non-flexural nature of deep beam behavior gives such members the ability to sustain high ultimate loads [2]. They are therefore used in many structural applications such as reservoir tanks, foundations, diaphragms, offshore structures, bunkers, shear walls and girders in multistory buildings when it is necessary to offset columns and slabs subjected to lateral forces.
Deep beams behave in a manner that is considerably unlike that of normal beams. This occurs because stress distribution through the transverse section in deep beams deviates appreciably from the linear distribution that is assumed in normal beams. In addition, the ultimate shear failures of ordinary beams are usually brittle compared to ductile flexural failures in ordinary beams, so special treatment in terms of analysis, design and reinforcement details should be adopted for such members [3].
When a slab–beam system is cast monolithically, a portion of the slab will work as a top flange with the connected beam, so the beam behaves as a T-beam. Likewise, if the beam depth is large and the ACI-Code deep beam definition is applicable, the member can be considered a T-deep beam. Estimating the behavior of Reinforced Concrete (RC) deep beams poses a considerable challenge due to the complications of such structural members. Furthermore, considering flanges in such beams makes predicting their behavior more complex, especially when High-Strength Concrete (HSC) is used.
Several previous studies considered the behavior of deep beams, whether solid or containing web openings [2, 4-7], under various loading types, such as one-point or two-point loads [8-11], repeated loads [12, 13], distributed loads [14], strengthened or repaired beams [15-18], made of normal or high–strength concrete. However, few works have investigated the behavior of T-deep beams.
In 1992, Roy et al. [19] investigated the influence of flanges on deep beams numerically using 20-noded isoparametric elements and compared their distinctive behaviors with those of rectangular beams. Results indicated a substantial enhancement in the strength of flanged-deep beams compared to rectangular beams.
Self-Consolidated Concrete (SCC) has good workability and can be placed with no need for mechanical vibration. It is also cohesive enough to handle without bleeding or segregation. Spreading of the cast concrete is achieved under its own weight. SCC offers several advantages over traditional concrete, such as improved workability, structural integrity and bonding with reinforcing steel, as well as superior durability and strength. It also produces a uniform surface, so it is preferred for use in deep or long-span members [20]. Some studies demonstrated that the grain size of aggregate either ordinary or recycled has an influential role in adopting an appropriate SCC mixture. However, SCC characteristics may be significantly affected by type and dosage admixture and filler [21-23].
Kumar et al. [24] assessed the behavior of SCC flanged beams, compared them to those made of conventional consolidated concrete and found that SCC improved durability compared to conventional consolidated concrete, as well as uniformity of construction, homogeneity and structural responses. The behavior of RC T-deep beams strengthened by CFRP-sheets was investigated experimentally by Lee et al. [25]. The examined parameters included fiber orientation, strengthening lengths and U-wrapped anchorage using CFRP sheets. These parameters affected the shear behavior of strengthened members considerably. In addition, shear compression was the dominant failure type due to the delamination of the sheets. The design and analysis of HSC deep beams was studied by Mohammad et al. [26], who focused on stress–strain distribution and the shifting of the neutral axis along the beam depth. SCC was used to prepare tested deep beams. The strain distribution was nonlinear throughout the beam depth.
Lisantono et al. [27] derived an equation to estimate the maximum torque capacity of hybrid T-deep beams in which webs were made of normal weight concrete and flanges were cast using lightweight concrete with openings. Good prediction for the relationship between the concrete’s strain diagram and compression struts was obtained. After that, Lisantono [28] presented a nonlinear finite element analysis of hybrid RC flanged beams containing web openings under pure torsion. The results indicated that, before cracking, the curve of torque–twist angle predicted by the finite element analysis was linear and had good agreement with the obtained experimental results. However, a nonlinear curve and stiffer behavior relative to the experimental data were observed after cracking. The effectiveness of using U-wrapped CFRP fabric to strengthen RC flanged deep beams was also investigated. The strengthening process improved the shear capacity compared to the control beams in some cases, but an obvious reduction in shear capacity was found in other cases.
Lafta and Ye [29, 30] tested a set of RC deep beams without web reinforcement to investigate their behavior under indirect loads. The tested beams had different dimensions. These beams were classified into three groups depending on their shear span-to–depth (a/d) ratios. It was found that T-deep beams subjected to indirect loads can carry extra loads after the initiation of diagonal cracks. Lafta and Ye also presented suitable numerical models using ANSYS software and observed that their numerical and experimental results agreed well in terms of crack patterns, load-deflection curves and failure load. A comparison was made between the experimental tests and predicted data obtained by adopting the ACI 318M-08 equation for ordinary beams. The ACI Code equation underestimated the shear capacity of indirectly loaded T-deep beams. Chalioris et al. [31] experimentally investigated the influence of adopting CFRP ropes instead of steel stirrups as shear reinforcement when upgrading the structural response of RC deep beams. Five rectangular and flanged deep beams were subjected to monotonic loading and tested. Two strengthening schemes were used: (a) one diagonal and one vertical designed as a single-link rope embedded throughout the web section of rectangular beam and (b) double-link U-shaped ropes as a near-surface-mounted around the web of the T-beam. Epoxy bond was used to anchor the free lengths of the CFRP ropes in both cases. Beam strength increased, and brittle shear failure shifted to ductile flexural failure. An analysis was also performed to obtain the shear capacity of such beams. The experimental and theoretical behavior of SCC deep beams was investigated by Hassan et al. [32]. It was concluded that the shear span-to-depth ratio and concrete strength were the most essential parameters that affected the responses of RC deep beams.
It can be observed that the behavior of beams has been analyzed by several methods such as finite element method [10], strut and tie model [1] and Artificial Neural Networks [33, 34].
Few studies dealt with flanged deep beams made of HSC, so the behavior of SCC-HSC flanged deep beams is investigated in this study to increase the available knowledge on the performance of such structural elements. The effect of flange width on the overall response of deep beams was studied.
2. MATERIALS AND METHODS
2.1. Materials
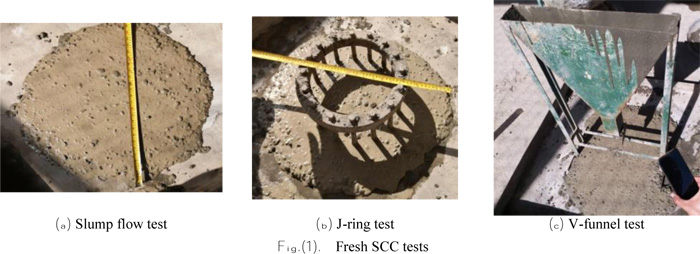
The SCC mix was prepared by mixing of ordinary Portland cement made by the KAR Company, coarse aggregate, fine aggregate, limestone powder as a filler, GILENIUM ®54 as super plasticizer and tap water in the proportions by weight shown in Table 1. The adopted water–cement ratio was approximately 0.33. Coarse aggregate with maximum size of 19 mm was used. Natural sand from the Al-Najaf zone was utilized as fine aggregate. Table 2 and Fig. (1) show the results of fresh SCC tests which carried out on the adopted concrete mix. These results confirmed that the concrete mix satisfied the requirements of specifications for SCC. The results of slump flow test and J-ring test indicated that the adopted mix satisfied the requirements of flowability and passing ability respectively. While both T500 and V-funnel test results confirmed that the mix fulfilled the viscosity requirements of SCC.
| Cement | Coarse Aggregate | Fine Aggregate | Limestone Powder | GILENIUM ®54 | Water |
|---|---|---|---|---|---|
| 1 | 1.7 | 1.78 | 0.21 | 0.016 | 0.33 |
| Test | Result | Specification Limits According to: | |
|---|---|---|---|
| Slump Flow | 660 mm | ACI 237R-07 [35] | 450-760 mm |
| T500 | 4 sec. | 2-5 sec. | |
| J-ring | 620 mm | Not differ by more than 50 mm from slump flow result | |
| V-funnel | 15 sec. | EN 206-1 [36] | 3-27 sec. |
2.2. Experimental Method
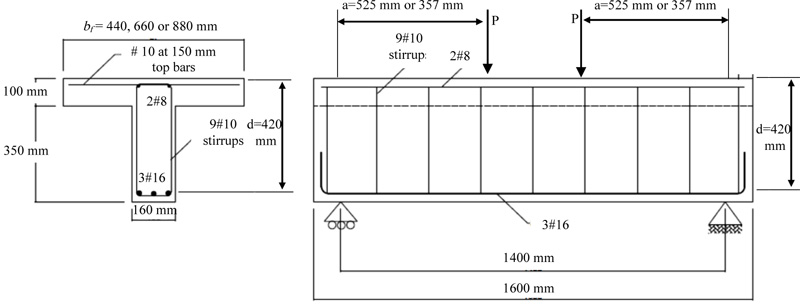
To investigate the effect of flange width on the behavior of SCC-HSC flanged deep beams, eight 1600 mm long specimens were tested. They had total depths of 450 mm and widths of 160 mm and were grouped into two categories depending on their a/d ratio (1.25 and 0.85). Where d is the effective depth and equals to 430 mm while a is the shear span and equals to 525 mm and 357 mm for a/d values 1.25 and 0.85 respectively as shown in Fig. (2). Each group consisted of four beams, one of which was a reference specimen with a rectangular section, and three beams with T-sections that had flanges with widths of 440 mm, 660 mm and 880 mm and a thickness of 100 mm, as shown in Table 3. All beams were reinforced by 3#16 bars as their main reinforcement. For shear reinforcement, #10 stirrups uniformly spaced at 200 mm throughout beam length were added. Two #8 bars were used as top bars to support the stirrups. Flanges were reinforced with #10 bars spaced at 125 mm on top of the flange to resist the transverse negative moment induced by applying loads along the flange width. Fig. (2) shows beam dimensions and reinforcement details. The tests were done under two-point loads with a clear span of 1400 mm. The simply supported beam conditions were achieved by a steel plate of 10 mm thickness and 100 mm width rested on a cylindrical shaft of 50 mm in diameter at each supporting point. The specifications of the steel bars and concrete are listed in Table 4.
3. DISCUSSION
3.1. TEST RESULTS
3.1.1. Cracking and Failure Loads
Table 5 shows the cracking loads, failure loads and the ductility index values of the tested specimens. The cracking load was affected in a wider range compared to the failure load when changing the flange width. The increase in the cracking load was about 68%. This may have occurred because increasing the flange width led to increasing the gross moment of inertia. Improvement in cracking load diminished with increasing flange width for the group with an a/d of 0.85. Therefore, an effective flange width must be determined when calculating the cracking load. Further study is required to address the effective flange width. In addition, the recorded cracking load was higher for specimens with small a/d ratios. This may be attributed to the reduction in the bending moment produced for such specimens.
Flange width has more effect on failure loads with higher a/d ratios. This behavior appears reasonable if it is considered that wider flanges resist more bending stresses relative to shear. This effect diminished when adopting larger flanges, perhaps because the larger flange required more shear connectors to fix the flange with the web and work as a single unit. As a result, at high load levels, cracks along flanges formed and developed considerably, causing local flange failure. It was also observed that increase in the failure load with smaller a/d ratios is limited, possibly because the part of the flange width known as the effective flange contributes to shear stress resistance.
At higher a/d ratios, maximum deflection increased considerably when the flange width increased. This may have occurred because increased flange width contributes to compression bending stress resistance and delays crushing failure until the tension steel yields. This refers to an increase in the ductility of member. The values of the ductility index shown in Table 5 indicate some warnings before failure. Ductility index is assumed to be the ratio of the ultimate deflection to the yield deflection, and the yield load is assumed to be a load corresponding to 75% of the ultimate load [37]. Brittle shear failure was recorded at smaller a/d ratios with small ultimate deflection values. This demonstrated that the maximum deflection was not affected by increasing flange width. However, the ductility index increased from 1.92 to about 2.44 in flanged beams compared to rectangular beams.
| Group No. | Specimen Designation | a/d | Flange Width (mm) |
|---|---|---|---|
| Group One | TDB10 | 1.25 | Control (Rectangular section) |
| TDB11 | 1.25 | 440 | |
| TDB12 | 1.25 | 660 | |
| TDB13 | 1.25 | 880 | |
| Group Two | TDB20 | 0.85 | Control (Rectangular section) |
| TDB21 | 0.85 | 440 | |
| TDB22 | 0.85 | 660 | |
| TDB23 | 0.85 | 880 |
| Material | f`c (MPa) |
f`t (MPa) |
f`y (MPa) | fu (MPa) | |
|---|---|---|---|---|---|
| Steel bar dia. (mm) | 8 | - | - | 510 | 620 |
| 10 | - | - | 530 | 635 | |
| 16 | - | - | 520 | 660 | |
| Concrete | 78 | 3.7 | - | - | |
| Group No. | Specimen Designation | a/d Ratio | Flange Width (mm) | Cracking Load (kN) | % of the Increase in the Cracking Load with Respect to Reference Beam | Failure Load (kN) | % of the Increase in the Failure Load with Respect to Reference Beam | Yielding Deflection* (mm) | Max Deflection (mm) | Ductility Index |
| Group One | TDB10 | 1.25 | Control | 100 | - | 700 | - | 5.93 | 25.48 | 4.296796 |
| TDB11 | 1.25 | 440 | 120 | 20 | 723 | 3.3 | 7.1114 | 24.84 | 3.492983 | |
| TDB12 | 1.25 | 660 | 125 | 25 | 773 | 10.4 | 7.86 | 35.55 | 4.522901 | |
| TDB13 | 1.25 | 880 | 168 | 68 | 694 | 10.7 | 7.1436 | 36.91 | 5.166863 | |
| Group Two | TDB20 | 0.85 | Control | 195 | - | 980 | - | 5.366 | 10.29 | 1.91763 |
| TDB21 | 0.85 | 440 | 240 | 23 | 1100 | 14.5 | 6.2 | 14.50 | 2.33871 | |
| TDB22 | 0.85 | 660 | 240 | 23 | 1087 | 10.9 | 5.6242 | 12.63 | 2.245653 | |
| TDB23 | 0.85 | 880 | 250 | 28 | 1100 | 12.2 | 6.16 | 15 | 2.435065 |
3.1.2. Load Deflection Curves
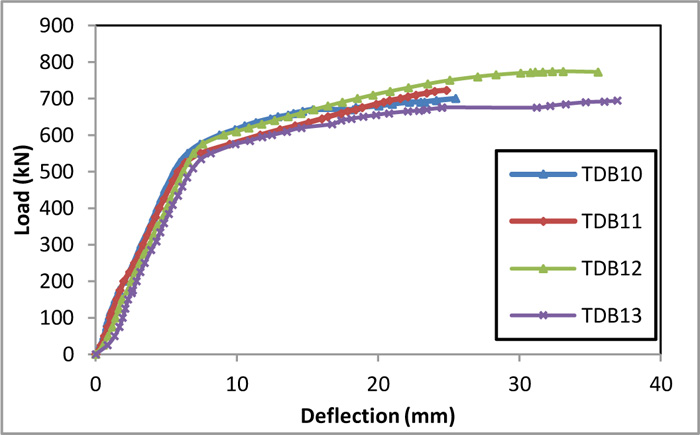
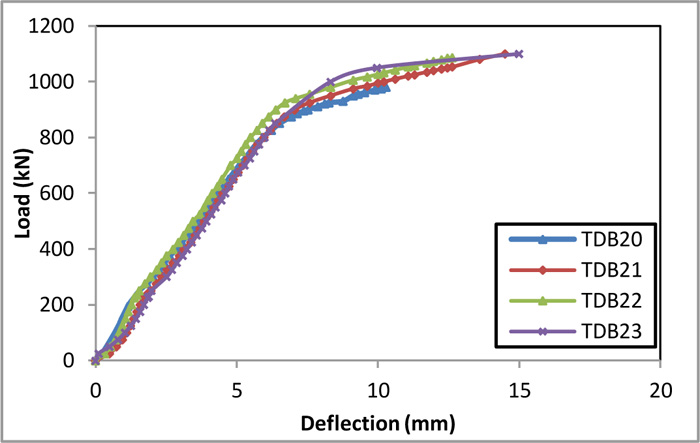
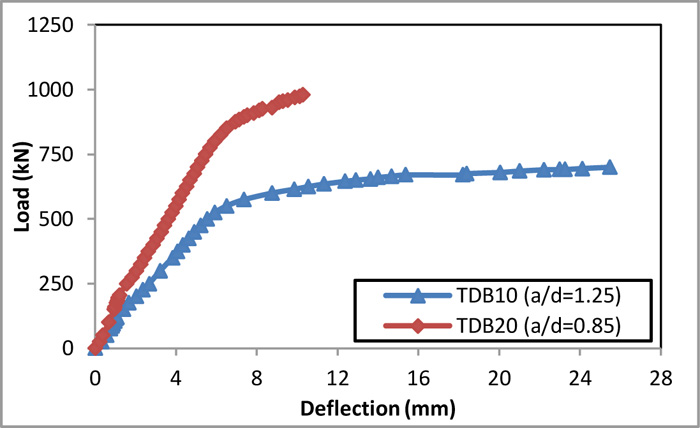
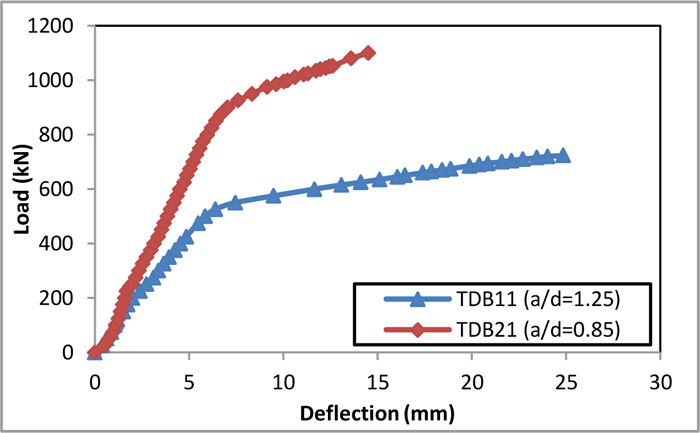
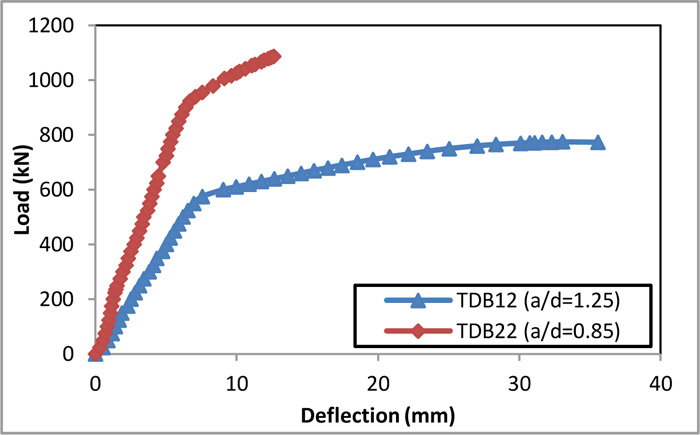
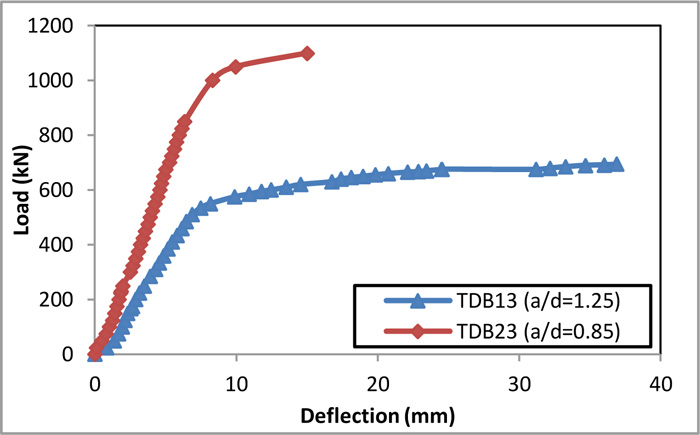
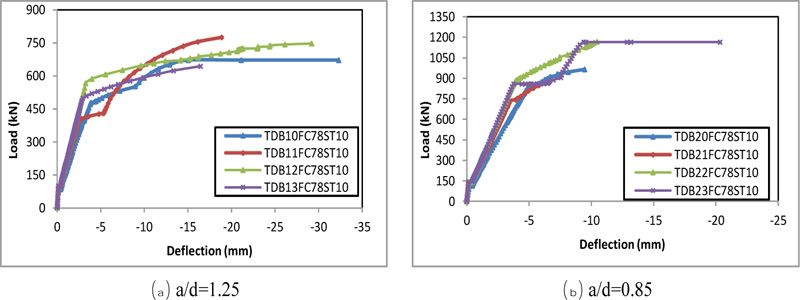
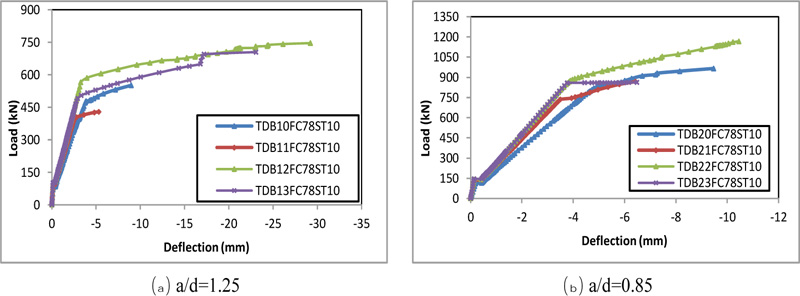
Figs. (3 and 4) show the effect of the a/d ratio on the load-deflection curves for the rectangular (control) deep beam and T-deep beams with flange widths of 440 mm, 660 mm and 880 mm, respectively. The overall behavior of all three beams includes three loading stages. In the first stage, a linear behavior can be observed in reference to the uncracked beam case. During this stage, the a/d ratio had a limited effect on the behavior of T-deep beams with different flange widths.
After the initiation of the first crack, the curves tended to be nonlinear, which indicated the onset of the second loading stage. However, the slope of the load-deflection curves dropped within a very limited range. At this stage, the a/d ratio had a considerable effect on T-deep beam behavior. After that, the third loading stage began. In this stage, the load-deflection curve decreased significantly, possibly due to the yielding of the tension steel and the enlargement and spreading of cracks. Flange width exerted no significant influence on failure load when the concrete grade was about 80 MPa. However, it had a considerable effect on the ductility index for the two a/d values. As Table 5 shows, ductility increased by 20% and 27% for a/d values of 1.25 and 0.85, respectively, due to the presence of the flange.
The effect of changing the a/d ratio on the behavior of T-deep beams is shown in Figs. (5-8). There was a clear and considerable increase in the ultimate load, which reached about 60% when the a/d ratio decreased from 1.25 to 0.85. Brittle shear failure was obtained in cases with small a/d ratios, whereas a ductile flexural failure was dominant in cases of beams with higher a/d ratios.
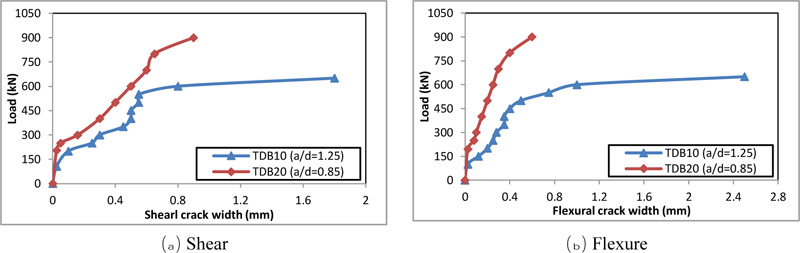
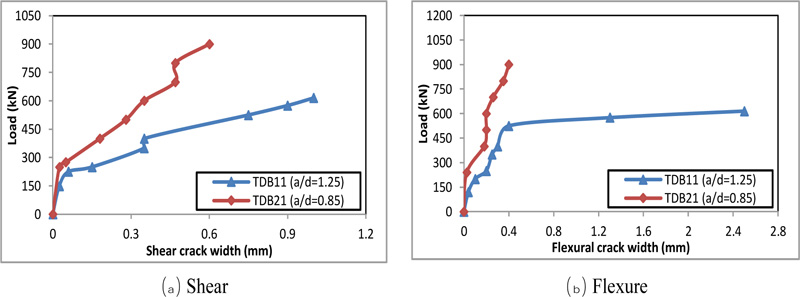
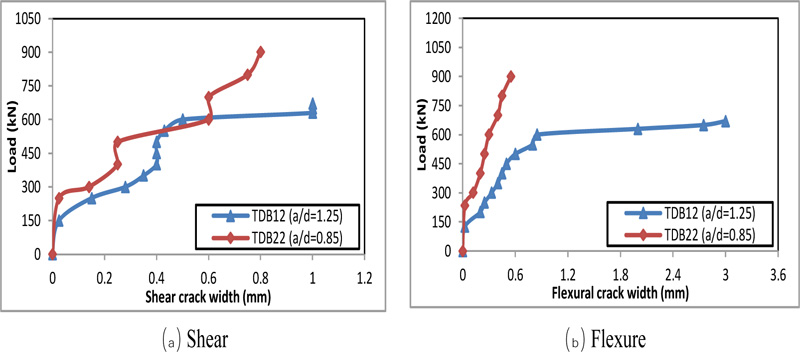
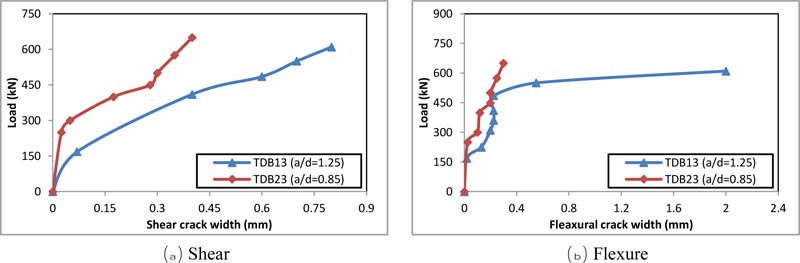
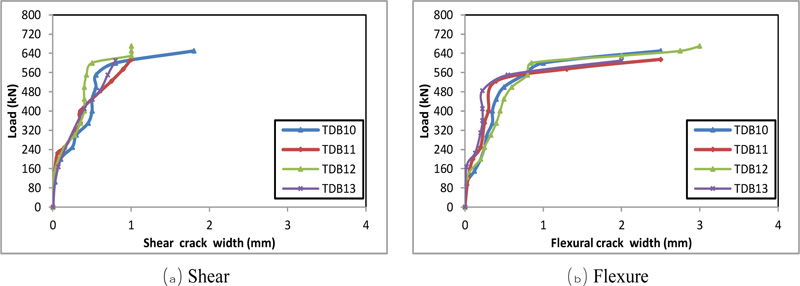
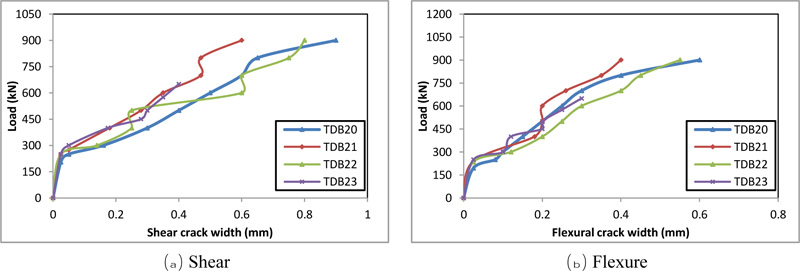
3.1.3. Cracks Width
Crack widths were measured at two points: the first diagonal crack in the shear span and the mid-span flexural crack. Figs. (9-12) show the load-shear crack width and load-flexural crack width relationships for control rectangular beams and flanged beams with flange widths of 440 mm, 660 mm and 880 mm, respectively. In cases with higher a/d ratios, flexural and shear cracks increased obviously during the final loading stage. This may be due to the yielding of the tension reinforcement, which resulted in ductile behavior. However, when the a/d ratio decreased, the flexural cracks reduced at a rate greater than that of the shear cracks.
Figs. (13 and 14) show the effect of flange width on shear- and flexural-crack width, respectively. Improvements in shear and flexural cracks were approximately the same in cases with smaller a/d ratios. In general, the range of improvement for crack width decreased with increasing flange width.
As it is known, within the mid-span, the bending moment is dominant, and flexural cracks occurred first. Therefore, higher tensile strains resulted, leading to a relatively wider crack compared to the first diagonal crack that developed within the shear span. The widening of such cracks is restrained by the shear resistance provided by high strength concrete.
3.1.4. Mode of Failure
The crack patterns of the tested beams with a/d ratios of 1.25 and 0.85 are shown in Figs. (15 and 16) respectively. It is clear that the first cracks in all specimens began at the bottom face of the mid-span, which is marked in red. These cracks grew and widened, and other cracks developed. It is obvious that the cracks at the mid-span grew vertically, so they were considered flexural cracks. Inclined diagonal shear cracks, however, formed at the shear span. It was also observed that for the higher a/d ratios, the cracks were more numerous and closer than in cases with smaller a/d ratios. This may be attributable to the ductile behavior of such members. The neutral axes of the flanged beams raised up as the flange width increased, and they were located in the flanges in the currently tested beams. Therefore, the flanges were cracked at higher loading stages. The cracks in the rectangular beams stopped at a lower level than those in the flanged beams. At the point of failure, crushing was observed at the top fibers of the tested beams and accompanied the cracking that occurred in the tension face when the a/d ratio was 1.25. This occurs due to high bending stresses that correspond to the high bending moment. The general failure pattern is a diagonal shear failure when the a/d ratio is small. Cracks formed in the junction line between the web and flange, and these cracks became more obvious in cases with small a/d ratios and high flange width. This may be attributable to the considerable change in shear resistance due to the sudden reduction in the member’s width, in addition to the higher shear stresses corresponding to the smaller a/d ratios.
A comparison of Fig. (15a and 15b) reveals that there is no essential difference in shear resistance between the two specimens due to the concrete’s high strength. In contrast, there is an important variation in flexural resistance. Therefore, increasing flange width shifted the neutral axis up such that the compression force induced in the compression flange equilibrated the tensile force induced in the steel reinforcement. This increased the strain induced in the steel reinforcement, so the flexural ductility increased, as previously mentioned. Additionally, crack development increased, and these cracks almost penetrated the flange. Therefore, cracks formed in the junction line between flanges. Then, several cracks that formed on the tension face developed horizontally, indicating that some bond loss occurred, and some horizontal spalling in concrete almost developed. This weakness in the concrete might allow for increased beam curvature. Thus, failure occurred by diagonal shear with some horizontal cracks near the top face of the flange. From this, it can be concluded that the tension steel suffered higher strain values than that developed in specimen TDB10 leading to more ductile behavior.
Figs. (15c and 15d) show the effect of increased flange width on crack distribution at the point of failure for specimens TDB12 and TDB13. Increased flange width clearly affected flexural resistance to some extent. As the compression force increased, more tensile stresses in the bottom steel were accommodated. Therefore, more horizontal cracks formed and more curvature was observed. Failure occurred when vertical cracking under the point load and some crushing developed.
Figs. (15a and 16a) show the effect of a/d ratio on crack patterns for the specimens with rectangular sections. For higher a/d ratios, flexure tends to be more effective than shear. Thus, the first crack was of the flexural type, but with progress in loading, more cracks formed within and away from the pure bending moment zone. This may indicate that the tension steel resisted higher stresses than the steel in specimen TDB20. For such beams, it is obvious that the cracking progressed rapidly toward the high shear zone. A relatively smaller number of cracks initiated at the pure bending moment zone. Failure for both specimens occurred by diagonal shear. The failure mode of specimen TDB10 was accompanied by crushing at the compression face. Furthermore, it is clear from Table 5 that reducing the a/d ratio from 1.25 to 0.85 increased the failure load from 40% to 59%. Thus, stiffer behavior was obtained because of the concrete’s high strength.
The cracking pattern of specimen TDB21 is shown in Fig. (16b). When specimens TDB10 and TDB20 are compared with specimens TDB11 and TDB21, the same conclusion can be seen: the number of cracks increased with higher a/d ratios. In addition, for specimen TDB11, the flexure behavior is more obvious if compared with that of specimen TDB21. This can be observed from the difference in the number of horizontal cracks at the tension face for each specimen and the extent of horizontal cracking in the top face of the flange.
It is worth mentioning that the diagonal crack that initiated from the supports toward the loads caused, at final stages, a slight vertical displacement that resulted in some cracks within the flange near the support.
Fig. (16c) shows the crack pattern of specimen TDB22. It is obvious that the number of cracks increased relative to those of specimen TDB21, and there is a noticeable increase in the horizontal cracks, indicating more tensile force in the tension steel due to increased flange width. Similar crack propagation at the top face of the flange can also be observed.
The crack pattern of specimen TDB23 is shown in Fig. (16d). It is clear that the diagonal crack caused considerable movement of the concrete block at the support. However, more horizontal cracks developed at the flange and the junction between the flange and the web. This movement can be attributed to a large number of horizontal cracks that may have been caused by a loss of bond between the steel and concrete due to the excessive tensile stress produced in the steel bars. The combination of shear and moment controlled the angle of inclination of the major diagonal crack that developed between the stirrups and penetrated up to the flange without any interruption by steel. Thus severe failure finally occurred at the support due to diagonal shear.
3.2. Numerical Simulation and Results
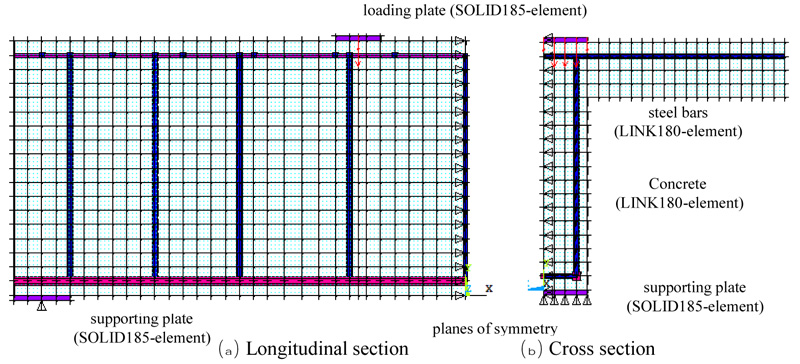
The finite element method and ANSYS15 software were used to perform numerical analysis of the tested beams. The concrete, steel reinforcement and steel plates at the loading and supporting points were simulated using the SOLID65, LINK180 and SOLID185 elements, respectively. The steel plates were used to prevent local crushing on concrete. All the adopted elements are three-dimensional elements with three orthogonal degrees of freedom per node. The SOLID65 and SOLID185 elements are 8-node brick elements, while LINK180 is a 2-node element. The difference between the two brick elements is that SOLID65 can take into consideration the cracking and crushing phenomena not addressed by SOLID185. Therefore, SOLID65 is suitable for representing the concrete [38].
ANSYS treats the cross-sectional areas of steel reinforcement as real constants. These are illustrated in Table 6. The initial strains for all steel bars are set as zero. Because the discrete representation method is used to simulate reinforcement steel, zero values are set as real constant for the SOLID65 element.
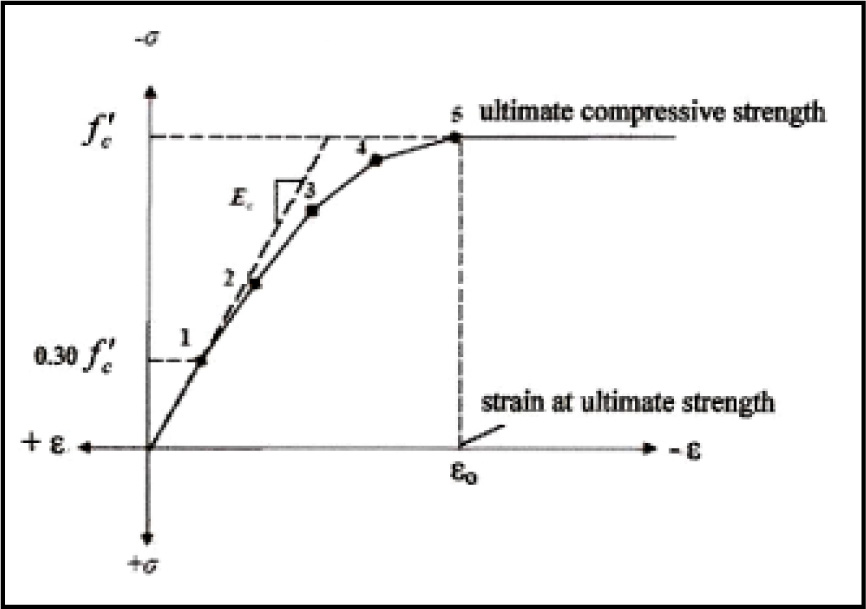
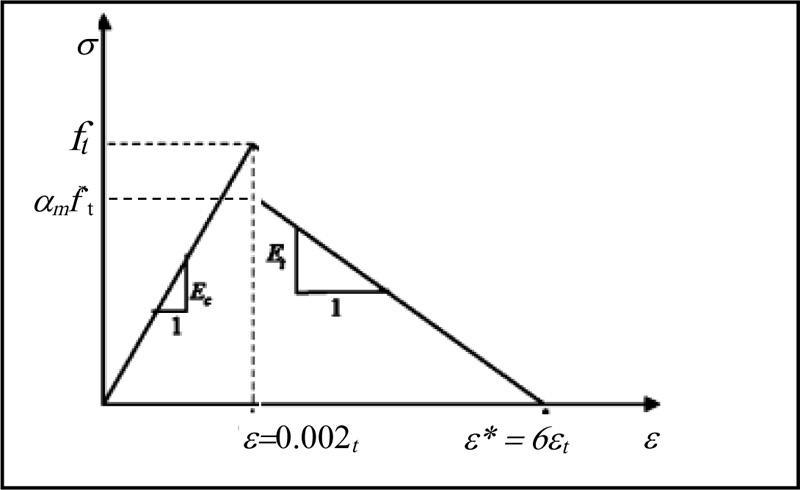
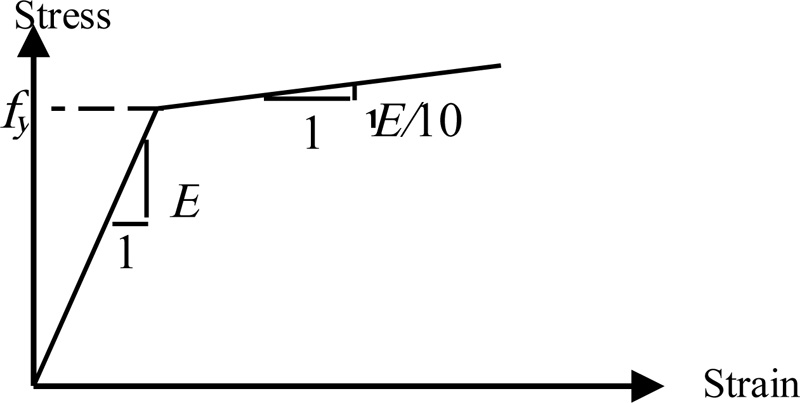
The adopted values that define the constitutive relationships for concrete, steel bars and steel plates in the supporting points and under the applied loads are listed in Table 7. The concrete stress-strain constitutive models for concrete in compression and tension shown in Figs. (17 and 18), respectively were adopted. Steel reinforcement bars were modeled as a bilinear stress-strain constitutive model, as shown in Fig. (19). One-quarter of each tested beam was considered by making use of symmetry. A typical simulated beam is shown in Fig. (20).
Non-linear analysis was used to predict the behavior of the tested specimens and the extended parametric study. The sources of nonlinearity in the considered problem arise from the cracking and crushing of concrete or the nonlinear behavior of the concrete itself, as well as the yielding and post-yielding of the steel bars. The modulus of elasticity and Poisson’s ratio were input as linear isotropic parameters for each material (i.e.. concrete, reinforcement bars, and steel plates). The concrete’s nonlinear behavior was simulated by introducing shear transfer coefficients for open and closed cracks, crushing and cracking stresses and tensile crack factors [38].
| Real Constant Set | Element Type | Real Constants | |||
|
1 (concrete) |
SOLID65 | Material number ,Volume Ratios, Orientation Angles and Orientation Angles | Rebar1 | Rebar2 | Rebar3 |
| 0 | 0 | 0 | |||
|
2 (# 8 bars) |
LINK180 | Cross-sec. area (mm2) | 50.3 | ||
| Initial strain | 0 | ||||
|
3 (# 10 bars) |
LINK180 | Cross-sec. area (mm2) | 71 | ||
| Initial strain) | 0 | ||||
|
4 (#16 bars) |
LINK180 | Cross-sec. area (mm2) | 199 | ||
| Initial strain | 0 | ||||
| Material Number | Element Type | Material Properties | ||||||
| 1 | SOLID65 | Linear Isotropic | Multilinear Isotropic | Concrete | ||||
| Modulus of elasticity | Possion`s ratio | Point No. | strain | Stress (MPa) | Shear coefficient for opened cracks | 0.45 | ||
| 36000 MPa | 0.2 | 1 | 0.0003333 | 12 | Shear coefficient for closed cracks | 0.95 | ||
| 2 | 0.0004 | 14.3 | UnTensS (ft) | 3.7 | ||||
| 3 | 0.001 | 34.2 | UnComp (f`c) | 78 | ||||
| 4 | 0.0015 | 48.3 | St TenC (αm) | 0.6 | ||||
| 5 | 0.002 | 59.4 | ||||||
| 6 | 0.0025 | 67.4 | ||||||
| 7 | 0.003 | 73 | ||||||
| 8 | 0.0035 | 76.3 | ||||||
| 9 | 0.004 | 78 | ||||||
| 2 | LINK180 (#8) | Linear Isotropic | Bilinear Isotropic | |||||
| Modulus of elasticity | Possion`s ratio | Yield Stress | Tang Mod | |||||
| 200000 MPa | 0.3 | 510 MPa | 2000 MPa | |||||
| 3 | LINK180 (#10) | Linear Isotropic | Bilinear Isotropic | |||||
| Modulus of elasticity | Possion`s ratio | Yield Stress | Tang Mod | |||||
| 200000 MPa | 0.3 | 530 MPa | 2000 MPa | |||||
| 4 | LINK180 (#16) | Linear Isotropic | Bilinear Isotropic | |||||
| Modulus of elasticity | Possion`s ratio | Yield Stress | Tang Mod | |||||
| 200000 MPa | 0.3 | 520 MPa | 2000 MPa | |||||
| 5 | SOLID185 | Linear Isotropic | ||||||
| Modulus of elasticity | Possion`s ratio | |||||||
| 200000 MPa | 0.3 | |||||||


The numerical results of the analysis are illustrated in Table 8 and Figs. (21 and 22). As it is shown in Table 8, the difference in the failure load values between numerical and experimental results ranged from -9% to +7%. Figs. (21 and 22) show a good agreement between the numerical and experimental behavior through the entire loading history. Load-deflection curves for beams with a/d ratio of 1.25 yielded better agreement than those with a/d ratio of 0.85 throughout all loading stages. This may be attributable to the ductile behavior that corresponds to a high a/d ratio and increased dependence on the steel reinforcement to resist the applied load. The difference between the numerical and experimental results clearly increased when wider flanges were used. In general, load-deflection curves obtained from ANSYS were stiffer than those obtained experimentally. This may be due to the assumption of a full bond between the reinforcing steel bars and concrete when building the finite element model and the fact that concrete is a heterogeneous material.
4. PARAMETRIC STUDY
In the previous section, it was found that the adopted finite element simulation created using ANSYS software gives satisfactory results. Consequently, some parameters that may affect the behavior of T-deep beams are presented in this section. The effect of changing flange width on the behavior of normal and HSC deep beams was studied for a/d ratio values of 1.25 and 0.85. Two shear reinforcement values were investigated in which Av/S values were 0.89 and 0.28 mm2/mm, which correspond to sections that are heavily and lightly reinforced against shear, respectively, where Av is the area of the two legs of the stirrup in mm2, and S is the spacing between stirrups in mm.
4.1. Effect of Flange Width on High Strength Concrete Beams with Heavy Shear Reinforced Section
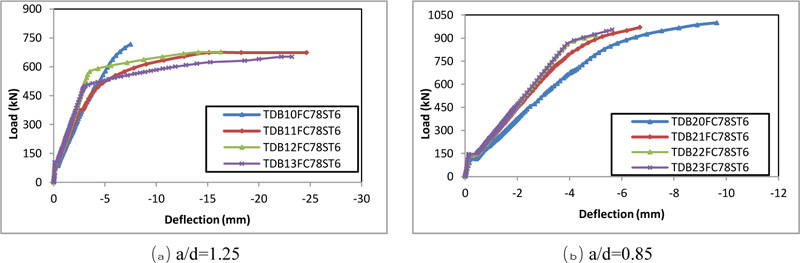
To study the effect of the flange width on the behavior of reinforced concrete deep beams, the same flange width values used in experimental part were adopted. HSC with a compressive strength of 78 MPa was used. Shear reinforcement with Av/S equal to 0.89 mm2/mm was adopted and was obtained by using ϕ 10 stirrups spaced 200 mm center to center. Fig. (23) shows the analysis results of HSC deep beams with different flange widths and the same a/d ratio values. Increased flange width has a slight effect on beam stiffness. This effect is more obvious in cases with higher a/d ratios. This result may be attributable to the higher flexural bending moment that corresponds with a higher a/d ratio and the fact that the flange contributes to compressive bending stress resistance more than it resists the high shear stresses that correspond to small a/d ratios. The effect of flange width is clearer at the final stages of loading, and it can be observed that the failure load enhanced with increasing flange width. However, these enhancements diminished with higher flange width—that is, when the flange width exceeded 660 mm. This may be attributed to the cracks that developed along the junction line between the web and flange. Thus, the flange may work separately from the beam. This indicates that wider flanges exhibit deficient horizontal shear transfer. Thus, more shear reinforcement is needed.
4.2. Effect of Flange Width on High Strength Concrete Beams with Light Shear Reinforced Section
Beams with the same properties as the beams discussed in the previous section, but in which ϕ10 stirrups were replaced with ϕ6 stirrups to obtain sections with light shear reinforced section, were also investigated. The analysis results are shown in Fig. (24). The effect of the flange width of HSC deep beams here is clearer in lightly reinforced sections than in heavily reinforced sections. The stiffness of the deep beam is enhanced with higher flange width values. This improvement becomes negligible when the flange width exceeds 660 mm. There was a slight effect of a/d on stiffness when changing the flange width. In this case, changing the flange width had a trivial effect on the failure load, but it contributed to decreasing the maximum deflection. For small a/d ratios, increasing flange width resulted in a reduction in beam ductility.
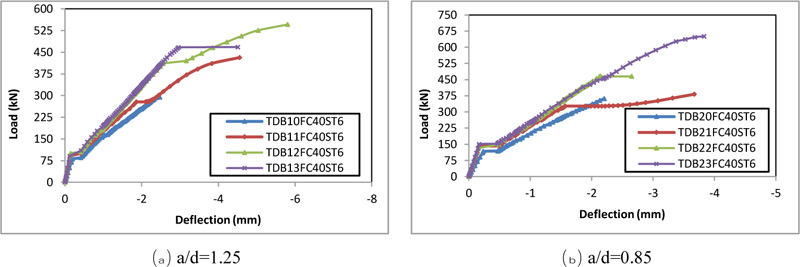
4.3. Effect of Flange Width on Normal Strength Concrete Beams with Heavy Shear Reinforced Section
In these sections, normal strength concrete with a compressive strength of 40 MPa was adopted. The influence of flange width variation on the behavior of normal strength concrete deep beams with heavily reinforced section is illustrated in Fig. (25). It can be concluded that flange width has more effect on the cracking load, beam stiffness and failure load in normal strength concrete specimens than in HSC specimens. This effect diminished when the flange width exceeded 660 mm. The ductility of the deep beam increased with increasing flange width. More enhancement was observed for high a/d ratios.
4.4. Effect of Flange Width on Normal Strength Concrete Beams with Light Shear Reinforced Section
The same specimens considered previously were analyzed here by reducing the stirrup diameter to 6 mm, and the results are presented in Fig. (26). It can be observed that changing the flange width had the same effect as was discussed in the previous section in terms of cracking load and beam stiffness, but this occurred at low levels of loading. However, the effect of flange width on beam stiffness and failure load was smaller than in the beams discussed in the previous section at high loading stages. This means that the effect of increased stirrup diameter appeared at high load stages. When adopting light shear reinforcement, changing the flange width does not contribute to enhancing beam ductility.
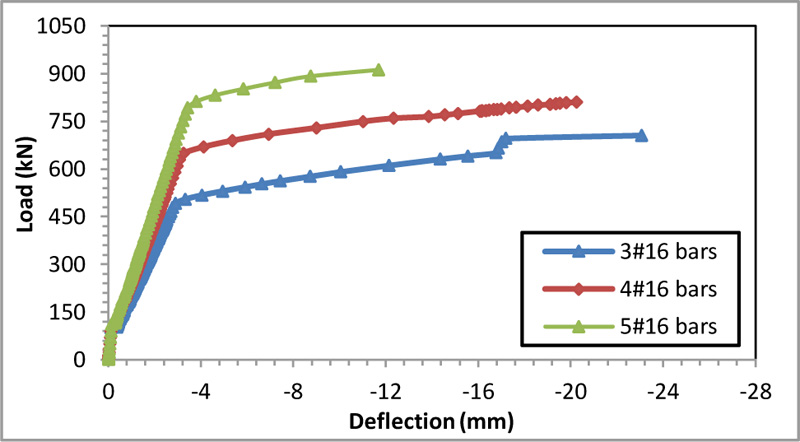
4.5. Effect of Steel Area on the Behavior of T-Deep Beams
The impact of longitudinal steel area variation on the behavior of specimens TDB13 and TDB23, which had a/d values of 1.25 and 0.85, respectively, is considered in this section. The results for specimen TDB13 are shown in Fig. (27). It can be observed that ductility and ultimate capacity vary gradually with increasing longitudinal steel area. This uniform variation may be attributed to the increased flexural behavior of beams in which the section is under-reinforced with steel in a ratio of 1%-1.5%. This corresponds to a maximum steel ratio of 2.5% for rectangular sections. Moreover, the shear resistance is relatively high due to the use of HSC. It can, therefore, be concluded that there is no significant effect on the failure mode with higher a/d values.
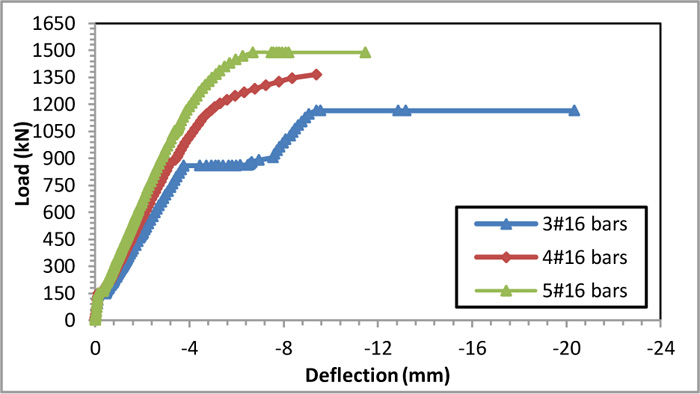
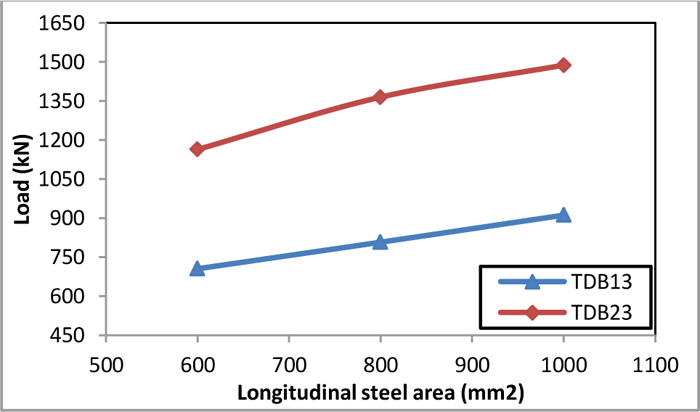
Fig. (28) shows the effect of the longitudinal steel area on the response of specimen TDB23. Due to the smaller a/d value, failure shifted from flexure to shear mode. This resulted in stiffer behavior, and increased capacity can be obtained with smaller ductility. The effect of steel area on failure load for the a/d values (i.e., 1.25 and 0.85) is shown in Fig. (29). For both specimens, an approximately linear variation of the failure loads with the amount of steel area can be observed. The flatter curve reveals that the effect of the steel area diminishes with a reduction in a/d ratio.
| Group No. | Specimen Designation | a/d Ratio | Flange Width (mm) | Ultimate Load (kN) | % of Failure Load Difference | |
| Exp. | ANSYS | |||||
| Group One | TDB10 | 1.25 | Control | 700 | 671.58 | -4 |
| TDB11 | 440 | 723 | 774.81 | +7 | ||
| TDB12 | 660 | 773 | 746.57 | -3 | ||
| TDB13 | 880 | 694 | 705 | +2 | ||
| Group Two | TDB20 | 0.85 | Control | 980 | 965.62 | -1 |
| TDB21 | 440 | 1100 | 1087.5 | -1 | ||
| TDB22 | 660 | 1087 | 1014.4 | -9 | ||
| TDB23 | 880 | 1100 | 1164.73 | +6 | ||


CONCLUSION
This study presented an investigation of the effect of flange width on the behavior of high-strength self-consolidated reinforced concrete T-deep beams. The cracking load showed greater improvement than the failure load. Improvement in the failure and cracking loads was about 88% and 68%, respectively. The best effect of increasing the flange width was recorded in the case of normal strength concrete beams with sections that were lightly reinforced against shear. The enhancement in cracking and failure loads was reduced or vanished in cases with high flange width values. A flange width of 660 mm yielded better failure load values. Therefore, the estimation of the effective flange width is recommended. The maximum load showed a more pronounced effect when the a/d ratio was 1.25. In cases of high flange width, and to ensure that a beam acquires its full capacity, the issue of horizontal shear transfer between the flange and web must be reconsidered, so both elements work as a single unit. In cases with a high a/d ratio, increased flange width resulted in a good distribution of crack patterns in that more narrow cracks developed. This indicates that increased flange width corresponds to a good improvement in ductility. However, with wider flanges, shear crack width was significantly reduced compared with the flexural crack width at the final stages of loading.
Numerical test results revealed that ANSYS software can provide reasonably good estimations for the overall behavior of HSC T-deep beams. The maximum difference in the ultimate load between the numerical and experimental tests was about 9%. The effect of flange width on beam stiffness was more obvious when the a/d ratio increased or when steel reinforcement decreased. Changing the flange width has more influence on the cracking load, beam stiffness, and failure load when using normal strength concrete than when using HSC. Such improvements diminished when flange width increased. Therefore, a formula that estimates effective flange width for T-deep beams should be derived.
CONSENT FOR PUBLICATION
Not applicable.
AVAILABILITY OF DATA AND MATERIALS
The authors confirm that the data supporting the findings of this study are available within the article.
FUNDING
None.
CONFLICT OF INTEREST
The authors declared that there is no conflict of interest.
ACKNOWLEDGEMENTS
Declared none.

