All published articles of this journal are available on ScienceDirect.

Seismic Risk of Modern City
Authors Info & Affiliations
Abstract
Aim:
The goal of the work was to develop and implement a methodology for the expected seismic risk assessment of a modern city on the example of a test area of Vladikavkaz city.
Background:
The selected area is characterized by a variety of soil conditions typical for the entire territory of the city. At the same time, building stock includes almost all types of buildings that form the urban environment.
Objective:
Based on the differentiation of soil conditions, the test area was conditionally divided into 6 sites. Further, site effects of every site were estimated (seismic microzonation work was carried out). Expected seismic intensity (MSK-64) of the sites varied within 7-9 points. Each type of building is characterized by a certain vulnerability to a particular level of seismic impact.
Method:
The work is focused on the implementation of simple and effective statistical concepts of the MSK-64 scale for the development of express seismic risk assessment methodology. Different soils and types of buildings in different combination caused a different level of expected economic losses. Further, on the basis of taking into account the expected damage in the building stock of Kuybyshev Street, the expected social losses were calculated. In this regard, it is of interest to analyze the seismic risk variations along Kuybyshev Street, which is actually a model of the city.
Conclusion:
The suggested methodology gives a rapid express assessment of seismic risk for decision making on buildings enforcement on a city level. Seismic risk methodology was corrected for new types of buildings (“Vesna” region) and it was shown that the MSK scale is effective but must be also actualized itself.
1. INTRODUCTION
Among natural disasters, the most severe consequences are caused by earthquakes. Whole world damage from earthquakes exceeds the damage from all other natural disasters combined. According to UNESCO data, the annual damage from earth quakes amounts to several tens of billions of dollars and in many developing countries absorbs a significant part of national income. One catastrophic earthquake can take up to a million lives and cause damage of up to $ 100 billion [1-5].
Only direct losses from the destruction of residential buildings in Neftegorsk settlement as a result of the earthquake on May 28, 1995 exceeded 230 billion rubles (in prices as of June 1, 1995). Strengthening buildings to intensity 7 (without evicting tenants) would cost 100 billion rubles, and increasing the seismic resistance even during the construction of buildings would be 4-5% of the cost of building non-earthquake-resistant buildings. The number of people killed as a result of the earthquake - 1989, the wounded - more than 400 people (with a total population of the settlement of about 3000 people) [1].
An analysis of the reasons for the increase in losses suggests that this is not an accidental phenomenon, but the irreversible consequences of the rapid growth of the popu lation, industry, infrastructure, commercial, and economic activity in large cities and industrial centers located in seismically active regions. This leads to the conclusion that it is necessary to invest in a strategy to reduce losses from earth quakes before an earthquake occurs, rather than spend more time during the recovery period.
The last decades in Russia have been characterized by high rates of population, industry, and infrastructure growth in large cities and industrial centers located in seismically active regions. During construction, the features of local soils and the level of seismic hazard were not always taken into account. The study of the consequences of strong and destructive earthquakes created the conditions for new scientific developments in engineering seismology and earthquake engineering. Seismic zoning of urbanized areas is of absolute relevance since it allows identifying more accurately the sources of possible earthquakes, assessing the seismic risk of the territory, and realizing the construction of buildings and structures with a given seismic resistance. At the end of the 20th century, methods for assessing the seismic risk of already existing buildings and structures were developed in Russia [1]. These programs considered numerous objective and subjective factors affecting the seismic risk level of urbanized areas. The features of their use are described below. One of the risk assessment methodologies was developed by Prof. S.Y. Balasanyan in 1991 [6]. After eight years of successful work, the strategy was approved in 1999 by the Government of Armenia as a state program. According to this methodology, the largest contribution to the scale of possible losses in case of a strong earthquake is made by the following components:
1. The seismic hazard of the territory;
2. Population and its density in areas of high seismic risk;
3. The area of zones containing buildings and structures that have low seismic resistance compared with the level of seismic hazard.
Such an approach, based only on the main risk factors, can significantly reduce the time and financial costs necessary to obtain complete information about all the components of risk. In addition, a significant reduction in the amount of required initial information leads to its greater simplicity and uniformity. At the same time, the use of only the main factors in risk assessment provides a very accurate (about 90%) idea of seismic risk.
This problem is particularly relevant for the regions of the Caucasus. The Republic of North Ossetia-Alania is located in a seismically active zone. It seems natural to estimate the seismic risk in Vladikavkaz - the capital of the Republic [7-13]. Kuybyshev Street and the adjacent neighborhoods were selected for the study. The following factors determined the choice of this region as the object of study: a relatively large area of the region (1.35 km2); objects of various types of structures with different number of storeys (houses, schools, administrative and public buildings, markets, etc.) are situated within this territory; the area under study includes almost all soil conditions characteristic of the entire territory of Vladikavkaz.
The research was first carried out in 2005 during the implementation of the NATO “Science for Peace” Project: Tools for Risk Management (NATO SfP 974320), 1999-2005 [14]. The aim of the work was to develop and implement a methodology for assessing the expected seismic risk of a modern city on the example of a separate defined area of Vladikavkaz. This would allow solving in future insurance issues on the basis of quantitative estimates [15].
2. METHODS
According to the main idea of the Project, in each capital of the participating country or “region”, works on seismic hazard and seismic risk assessments were to be carried out in a specially defined area. Kuybyshev Street was chosen as such in Vladikavkaz. The choice of this street was due to the fact that it is characterized by the soil conditions typical for the soil stratum that form the entire territory of the city [15]. At the same time, building stock on Kuybyshev Street includes almost all types of buildings that form the urban environment. Based on the differentiation of soil conditions, the street was relatively divided into 6 sites with different soil conditions. Then the amplification relative to the reference soils was calculated, i.e. seismic microzonation (SMR) works were carried out on 6 large construction sites. Reference soils were established on the territory of Vladikavkaz earlier in 1969-1970 and were revised and refined when creating a new SMZ map of Vladikavkaz in 2010 with the help of new approaches [16, 17]. This made it possible to calculate the expected intensities for the 6 sites, which were not the same for the long Kuybyshev Street (composed of soils with significantly different seismic properties) and varied within 7–9 points. Although the seismic risk assessment of the entire territory of Vladikavkaz, according to the mentioned project, was to be carried out immediately after that, on the basis of the new SMZ map, it was not realized due to the lack of funding. Herein, the methodology was already proven [18, 19]. But going back to Kuybyshev Street, it should be noted that in order to complete the research in 2019, investigations were updated and the seismic risk assessment calculations were refined. It is known that each type of building is characterized by a certain vulnerability to a particular level of seismic impact. The values of vulnerability and other expected parameters were deter mined on the basis of statistical analysis of data from a large number of past earthquakes and, therefore, can be used with sufficient reliability in the calculations. At the same time, consideration of specific types of soils and types of building stock with calculated intensities and vulnerabilities of building types caused a different level of expected economic losses.
Seismic risk, seismic hazard, and vulnerability are related by the following relationship in eq. (1)
R = Н × V (1)where: R – seismic risk;
H – seismic hazard;
V – vulnerability.
The assessment of seismic hazard and seismic risk are the necessary steps to carry out measures to reduce earthquake losses.
2.1. Algorithm for Calculating the VulnerAbility of Buildings and Structures
Tables 1-2 show the number of damaged buildings, degree of damage d, and the corresponding values of the damage coefficient DR for different intensity levels I.
The value of the damage coefficient above 30% from an economic point of view should be considered as very high for repair and, therefore, can be considered 100% loss for functioning in certain cases.
Each intensity level in the macroseismic scale represents a certain number of buildings that must be exposed to a certain extent within the range of damage levels from 1 to 5.
Vulnerability value for a building of types A, B, C, D, taking into account the data in Table 1 and Table 2 at various levels of macroseismic intensity, can be calculated using the following expression in eq. (2)
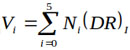 |
(2) |
It must be noted that the “averaged’ express assessment technique based on MSK-64 scale concept is applied. It is applicable for most of the buildings of the investigated area and allowed to make an assessment in a short time. Specifics of new building types as for the site 1 are considered in section 8. Life-cycle cost and seismic reliability analysis could give more precise and detailed results [19].
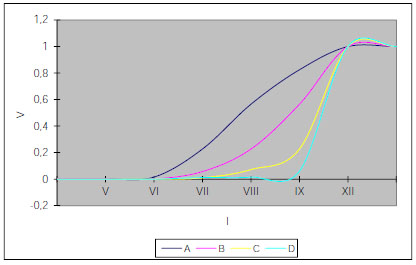
In the study area, four structural types of buildings were identified. For each type, a seismic vulnerability was calculated. The value of the degree of vulnerability lies in the range 0 ≤ V ≤ 1. The closer V is to unity, the higher the vulnerability of the building. A value of 1 corresponds to the complete collapse of the building. The results are presented in Table 3 and Fig. (1).
2.2. The Calculation of Seismic Loss Risk by the Example of Kuybyshev Street in Vladikavkaz
The area of the study was located on the territory of 1.35 km2; Gorky Street was considered as its southern border, the northern boundary passed along Dzhanaev Str., Markov Str., Osipenko Lane, and Shchukin Brothers Str.; in the west, the region stretched to the Terek River, and in the east it was limited by the corresponding line of the constructed Vesna district. The built-up part of the area was conditionally divided into six approximately equal sites, which are named from east to west: 1) Vesna, 2) Balkinsky passage – Pionerov Street, 3) Pionerov Street – Lermontovskaya Street, 4) Lermontovskaya Street – Frunze Street, 5) Frunze Street – Lenin Street, 6) Lenin Street – Terek River. Within each site, on the vector graphic, various objects and their number of storeys (separate houses and their groups, schools, institutes, administrative and public buildings, markets, etc.) were allocated, for each of which constructional types of buildings (A, B, C, D) and their number of storeys were established (Fig. 2, Table 4). Constructional types of buildings were chosen while considering the design estimation documentation, as well as during the inspection of structures in situ. The researchers of the institute were involved for this purpose.
| Seismic Intensity I, MSK-64 Scale | Building Type | |||||||
|---|---|---|---|---|---|---|---|---|
| A | B | C | D | |||||
| Number of Damaged Buildings, N (%) |
Degree of Damage d | Number of Damaged Buildings, N (%) |
Degree of Damage d | Number of Damaged Buildings, N (%) |
Degree of Damage d | Number of Damaged Buildings, N (%) |
Degree of Damage d | |
| 7 | 10 35 50 5 |
1 2 3 4 |
15 35 50 |
0 1 2 |
50 50 |
0 1 |
65 35 |
0 1 |
| 8 | 10 35 50 5 |
2 3 4 5 |
10 35 50 5 |
1 2 3 4 |
10 35 50 5 |
0 1 2 |
45 50 5 |
0 1 2 |
| 9 | 15 35 50 |
3 4 5 |
10 35 50 5 |
2 3 4 5 |
10 35 50 5 |
1 2 3 4 |
15 50 35 |
0 1 2 |
| Degree of damage d | 1 | 2 | 3 | 4 | 5 |
| Damage coefficient DR | 0.02 | 0.10 | 0.30 | 0.80 | 1.00 |
In each of the above-mentioned sites, its total area was determined, as well as the total area occupied by various built-up objects. Determination of areal indicators was carried out using the program AutoCAD. At all sites, the average number of storeys of the constructed buildings was calculated with the help of the following formula in eq. (3)
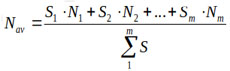 |
(3) |
where S1…Sm are squares of separate built-up objects and N1…Nm are the number of storeys corresponding to each area.
Further, in all singled out sites, an express estimate of the population was carried out using the formula Qst = Sst•Nav /20, where Sst is total square of a building stock for each calculated site, Nav is the average number of storeys of constructed objects on the calculated area, 20 is the quantity of the export value, which corresponds to the total area in m2, per resident.
In 2010, at the Geophysical Institute for the territory of Vladikavkaz, a set of seismic hazard maps was compiled for a recurrence period of 50 years and 1%, 2%, 5%, and 10% probability of exceeding seismic hazard [20]. The obtained data refer to the so-called “average soil”. For the territory of Vladikavkaz, preference is given to the 5% probability map of DSZ (detailed seismic zoning), which comes close to the existing assessments of the level of seismic hazard (recurrence period of 1000 years) for the region [21, 22]. At the same time, the territory of Vladikavkaz completely occupies the 8 point zone. Thus, the building stock area adjacent to Kuybyshev Street, spatially located near the central part of Vladikavkaz, is located in an 8-point seismic zone in accordance with the DSZ map. In the case of the absence of a detailed seismic zoning map, different approaches were used for seismic hazard assessment of the site of interest [23]. It must be also noted that in older publications, terminology of seismic hazard and risk were not separated and specified in modern form.
2.4. Calculation of the Expected Economic Losses
According to the definition, the risk is the probability of economic and social damage for a given territory over a certain period of time.
It is possible to assess risks, expressed as a percentage of losses for individual elements of risk or in monetary terms of these losses. The percentage of seismic risk is more convenient because such expression is more stable for certain elements of risk. The percentage ratio of losses does not depend on inflation and makes it possible to compare the results of assessments according to the materials of different countries, regardless of the ratio of the currency rate.

| Building Type | Macroseismic Intensity on MSK-64 Scale | |||||
|---|---|---|---|---|---|---|
| V | VI | VII | VIII | IX | XII | |
| A | 0.001 | 0.015 | 0.227 | 0.565 | 0.825 | 1 |
| B | 0 | 0.001 | 0.057 | 0.227 | 0.565 | 1 |
| C | 0 | 0 | 0.010 | 0.072 | 0.227 | 1 |
| D | 0 | 0 | 0.002 | 0.015 | 0.06 | 1 |
| Name of the Site in the Area of Kuybyshev Street | Intensity I, MSK-64 Scale (Site Effect) | Total Area m2 |
Square of Houses m2 | Land-Use Ratio | Constructive Types of Buildings and Their Area in m2 | Total Population, Including Individual Types of Buildings (People) | Average Number of Storeys | ||||||
|---|---|---|---|---|---|---|---|---|---|---|---|---|---|
| Number of Houses (groups) in units | |||||||||||||
| Number of Houses | A | B | C | D | A | B | C | D | |||||
| Vesna | 7 | 166288 | 29427 | 17.7 | 29427 | 5885 | 4 | ||||||
| 38 | |||||||||||||
| - | - | - | 29427 | - | - | - | 5885 | ||||||
| 38 | |||||||||||||
| Balkinsky passage-Pionerov Street | 7.5 | 177853 | 28532 | 16.0 | 28532 | 2140 | 1.5 | ||||||
| 178 | 706.5 | 20908.9 | 6916.6 | - | 35 | 375 | 1730 | - | |||||
| 6 | 166 | 6 | |||||||||||
| Pionerov Street-Lermontovskaya Street | 8 | 159501 | 35432 | 22.2 | 35432 | 2660 | 1.5 | ||||||
| - | 34728.4 | 703.6 | - | - | 2410 | 250 | - | ||||||
| 149 | 148 | 1 | |||||||||||
| Lermontovskaya Street-Frunze Street | 8.5 | 194762 | 62870 | 32.2 | 62870 | 6915 | 2.2 | ||||||
| 528.5 | 39802 | 22539.5 | - | 26 | 1372 | 5517 | - | ||||||
| 107 | 2 | 86 | 19 | ||||||||||
| Frunze Street-Lenin Street | 9 | 232448 | 96070 | 41.3 | 96070 | 11050 | 2.3 | ||||||
| 101 | - | 89192.8 | 6877.2 | - | - | 9283 | 1767 | - | |||||
| 93 | 8 | ||||||||||||
| Lenin Street-Terek River | 9 | 207625 | 103458 | 49.8 | 103458 | 10350 | 2.0 | ||||||
| 89 | - | 96764.2 | 6693.8 | - | - | 8925 | 1425 | - | |||||
| 83 | 6 | ||||||||||||
| Total | - | 1138477 | 355789 | 31.3 | 355789 | 39000 | 2.2 | ||||||
| 662 | 1235 | 281396.3 | 43730.7 | 29427 | 61 | 22365 | 10689 | 5885 | |||||
| 8 | 576 | 40 | 38 | ||||||||||
Data for some types of damage calculation is necessary in order to estimate the total damage:
- L1 is economic damage as a result of damage and (or) destruction of residential buildings and structures;
- L2 is economic damage as a result of damage and (or) destruction of urban infrastructure (excluding indirect losses);
- L3 is economic damage as a result of damage and (or) destruction of buildings for social welfare services (institutions of management, health care, etc.);
- L4 is social damage.
Damage caused by the secondary effects of earthquakes is taken into account by introducing specially designed multiplying coefficients for additional costs associated with the mitigation of the consequences (caused by the soils deformation, landslides, mudflows, etc.) including those connected with the impact of additional engineering protection structures from hazardous processes.
The total economic losses L is calculated as the sum of individual types of losses for all zones of varying intensity [19] in eq. (4)
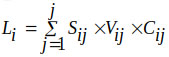 |
(4) |
where SIJ is building stock density of type j in the zone with intensity i; VIJ is the average vulnerability of a single object; CIJ is the average cost of a single object.
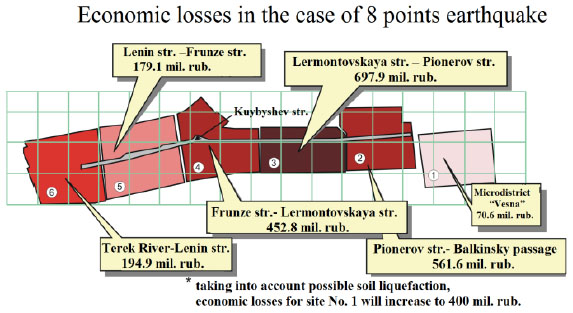
Distribution of economic losses during an intensity 8 earthquake is shown in Fig. (3), which clearly shows that the largest economic losses should be expected in areas 2 and 3, which, first of all, is due to soil conditions. At the same time, the risk of economic losses for site 1 (“Vesna” micro-district) is insignificant, due to the fact that the development of this area consists entirely of D-type buildings. At the same time, considering possible tilting of buildings caused by soil liquefaction, an economic risk will increase several times and according to our assessments will be about 400 million rubles (damage to about 30% of building stock).
2.4. Calculation of Social Losses in the Vicinity of Kuybyshev Street for EarthQuakes of Varying Intensity
Social losses during earthquakes are mainly determined by the level of damage to buildings and structures.
According to Table 3, values of vulnerability for structural types of buildings, respectively, A, B, C, and D for an earthquake of 7 points are: 0.227, 0.057, 0.01, 0.002, for an earthquake 8 points are: 0.565, 0.227, 0.072, 0.015, and for intensity 9 earthquake are: 0.825, 0.565, 0.227, 0.06.
It is accepted that the cost of one square meter of building stock in Vladikavkaz for the area of the micro-district Vesna will be 40.000 rubles and for other sites – 35.000 rubles.
To establish the full economic damage, we must also take into account losses due to damage and (or) destruction of urban infrastructure.
According to expert estimates, the additional damage from the previously calculated damage during intensity 7 earthquake will increase by 20%, and for intensity 8 earthquake - by 40%.
Thus, the total economic loss in the investigated area for intensity 7 earthquake will be ~ 168 million rubles, and intensity 8 earthquake ~ 743 million rubles.
Further, the expected economic losses were calculated as a result of damage and destruction of residential buildings and structures, as well as social facilities for each site (Table 5).
The issue of fires, which often accompany destructive earthquakes (for example, Tokyo, 1923, etc.) due to quite regular violations of gas pipelines, power grids, etc., is also very acute. In recent years, various kinds of accidents have occurred repeatedly, which can significantly change the situation in a particular urbanized area. For example, everywhere in the Caucasus, there are dangerous objects that, while neglecting the norms of exploitation, are sources of very significant hazards. Finally, returning to our region, it should be noted that the presence of toxic waste from numerous mines, including operating ones, can create conditions for natural and man-made disasters. In our work, the emphasis was placed on the seismic component through its impact on buildings and structures.
| Name of Sites in the Area of Kuybyshev Street | The Size of the Economic Loss Caused by an Earthquake, Million Rubles | ||
|---|---|---|---|
| 7 points | 8 points | 9 points | |
| Vesna | 8.2 | 17.7 | 70.6* |
| Balkinsky passage - Pionerov Street | 61.1 | 232.8 | 561.6 |
| Pionerov Street - Lermontovskaya Street | 70.3 | 280.2 | 697.9 |
| Lermontovskaya Street - Frunze Street | 114.1 | 452.8 | - |
| Frunze Street-Lenin Street | 179.1 | 722.0 | - |
| Lenin Street - Terek River Embankment | 194.9 | 784.1 | - |
| TOTAL | 139.6 | 530.7 | 1330.1 |
2.5. Calculation of Social Losses in the Vicinity of Kuybyshev Street for EarthQuakes of Varying Intensity
To calculate social losses, along with the above data from the tables, we used the data of statistical correlations between the number of wounded and dead for modern buildings (Table 6) [24]. At the same time, when calculating social losses for buildings of the old type, the results of the analysis of past earthquakes in the Caucasus were used.
3. RESULTS
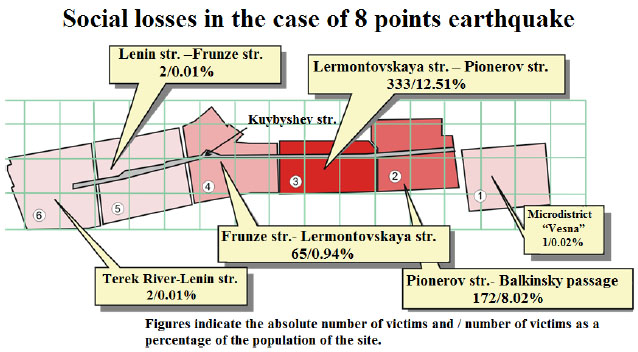
Using the expected damage percentages by damage rate and the corresponding damage rate values for different intensity levels on the MSK-64 scale, the number of buildings and structures (a majority, individual, average) of different levels, the expected social losses of the population were calculated (Fig. 4). These data are undoubtedly average and, unfortunately, can be significantly exceeded in a case of poor-quality construction. Everywhere in our calculations, it is assumed that the quality of work complies with the standards (at least for the construction period). Considering that the main part of the already existing development is characterized by a seismic resistance deficit of 1-2 points and sometimes more, very important attention should be paid to the quality of work. In particular, it is also necessary to take into account depreciation rates of buildings and structures.
| Impact | Building Type (Population, Persons) |
Loss of Population, Persons (% of total) | ||
|---|---|---|---|---|
| Light Injuries | Serious Injuries | Lethal Outcomes | ||
| VII | A (61) | 8 (13.1%) | - | - |
| VIII | 21 (34.4%) | 9 (14.8%) | 3 (4.9%) | |
| IX | 19 (31.1%) | 15 (24.6%) | 17 (27.9%) | |
| VII | B (22365) |
3 (0.01%) | - | - |
| VIII | 674 (3%) | 90 (0.4%) | 22 (0.1%) | |
| IX | 4037 (18.1%) | 528 (2.4%) | 338 (1.5%) | |
| VII | C (10689) |
- | - | - |
| VIII | 18 (0.2%) | - | - | |
| IX | 433 (4.1%) | 42 (0.4%) | 11 (0.1%) | |
| VII | D (5885) |
- | - | - |
| VIII | - | - | - | |
| IX | 1 (0.02%) | - | - | |
3.1. General Losses
General economic damage in addition to the cost of restoring destroyed and damaged buildings and structures will include the following types of costs:
- conducting rescue and other urgent work;
- restoration of utility and energy complex facilities;
- payment of compensation to the population for the loss of property and the damage caused.
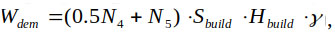
The volume of demolitions in each zone is determined by the formula [25] in eq. (5)
 |
(5) |
where N4 and N5 are the numbers of buildings that received, respectively, 4 and 5 degrees of damage;
Hbuild is the average height of buildings in the considered zone, m;
Sbuild is the average building area in the considered zone, m2;
γ is the coefficient of the voidness of the dam, it is taken to be 0.4 for buildings in a residential area and 0.2 for other zones.
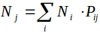
In turn, the number of buildings that received the j-th degree of damage is determined by the formula in eq. (6)
 |
(6) |
where Ni is the number of buildings of type i in the considered zone;
Pij is the probability that buildings of the i-th type will receive the j-th degree of damage.
As experience shows, the removal of demolitions beyond the contours of buildings with complete destruction is small and for example, for 9-storey buildings amounts 7 to 9 meters. Therefore, the main passages in the zones of earthquakes are practically not dammed. On the roadway, there may be separate fragments of building structures that have flown away. However, all of the above is true only for cases of destruction of buildings without tipping. In areas with low bearing capacity and large deformation of soils, there may be cases of destruction of high-rise buildings with their tipping (Site 1 - “Vesna” micro-district).
Calculation of the volume of blockages at different scenario earthquakes of 7, 8, and 9 points intensity for average soil conditions and estimation of the costs of debottleneck are given in Table 7. The complexity was considered equal to 1.8 person-hour/m3.
3.2. Indirect Economic Losses
Earthquakes can lead to a significant reduction and cessation of production volumes. Even if the company does not fall into the zone of maximum impact, violations of the infrastructure associated with electric networks, road and rail transport lead to damage caused by equipment downtime. In cases where the enterprise is located in the epicentral zone, losses can be significant. They require several years to reach the initial level.
An example is the Tangshan earthquake of July 28, 1976, which led to a complete or partial shutdown of production in the cities of Tangshan and Tianjin. Production of these two cities was restored only after two years (Table 8) [26].
During the Tangshan earthquake, about 17.2% of the personnel in the commercial sector died and 33.1% of the goods were destroyed, and 97% of the commercial buildings had to be restored.
| Name of Sites in the Area of Kuybyshev Street | Volume of Demolitions, thousand m3 | Costs for Debottleneck, mln. rub. |
||||
|---|---|---|---|---|---|---|
| 7 points | 8 points | 9 points | 7 points | 8 points | 9 points | |
| Vesna | 1.9 | 46.5 | 133.8 | 0.06 | 1.61 | 4.65 |
| Balkinsky passage - Pionerov Street | 17.2 | 46.3 | 51.4 | 0.60 | 1.61 | 1.78 |
| Pionerov Street - Lermontovskaya Street | 10.8 | 39.5 | 60.9 | 0.38 | 1.37 | 2.11 |
| Lermontovskaya Street - Frunze Street | 1.6 | 48.1 | 145.0 | 0.05 | 1.67 | 5.04 |
| Frunze Street-Lenin Street | 1.3 | 42.7 | 159.5 | 0.05 | 1.48 | 5.54 |
| Lenin Street - Terek River | 0.0 | 2.8 | 76.7 | 0.00 | 0.10 | 2.66 |
| TOTAL | 32.7 | 225.8 | 627.3 | 1.14 | 7.84 | 21.78 |
| Year | Tangshan | Tianjin |
|---|---|---|
| 1975 | 2.79 | 14.27 |
| 1976 | 1.93 | 13.36 |
| 1977 | 1.88 | 13.58 |
| 1978 | 2.92 | 15.51 |
| Year | Income from Industrial and Commercial Taxes | Financial Income |
|---|---|---|
| 1975 | 25.1 | 30.8 |
| 1976 | 18.0 | 16.3 |
| 1977 | 14.9 | 6.5 |
| 1978 | 23.5 | 21.2 |
| 1979 | 26.4 | 27.5 |
| 1980 | 28.3 | 29.1 |
| 1981 | 29.1 | 32.3 |
Tax collections reached the initial level only after four years, and financial incomes six (Table 9) [26].
The earthquake not only destroyed economic activity in the affected territory but also in economically connected cities and territories. The city of Tangshan is called the “coal capital” of China; it produces more than 5% of the coal produced in China. It supplies many large steel plants, major cities of Beijing and Tianjin, and also exports to Japan and Korea. Tangshan supplies Beijing and the whole of North China with electricity, so the earthquake caused a decline in production in Beijing and North China. The 1976 earthquake destroyed the chemical industry, which supplied raw materials to more than 600 enterprises throughout China.
4. DISCUSSION OF THE RESULTS
Based on the analysis of the results of geological surveys on Kuybyshev Street on the territory of Vladikavkaz, six sites with different soil conditions were identified. Then, using the method of expert assessments, rating evaluations of the soils of the foundations of the selected sites were implemented. According to detailed seismic zoning and seismic microzonation data, the calculated intensity for the indicated site varies within 7-9 points.
Analysis of the data shows that, at the same time, there is a clear connection between the soil conditions and the level of vulnerability of the investigated quarters. The developed approach, of course, must be taken into account when assessing seismic vulnerability and the corresponding risk of a territory, i.e. in assessing social and economic losses. Several types of buildings (A, B, C, D) were identified in the investigated area and their classification by vulnerability to seismic impacts was given. The use of rating assessments creates conditions for the transition from traditional points to other correlative estimates. This implies the use of correlations between the results of expert assessments and the calculated acceleration of soils foundations of the existing building stock.
Analysis of the calculation results shows that, depending on the type of buildings, the vulnerability varies widely. It can be well seen that the modern development of the “Vesna” micro-district is sharply distinguished by the minimality of the predicted vulnerability. Here it is almost zero at 6-9 points of impact. On the other hand, an analysis of the instrumental records of stations located in different soil conditions shows that this region is characterized by a significant seismic hazard due to the foundation soils in the form of a thick layer (20 meters or more) of clayey soils with a fluid consistency.
The results of the analysis of the worst effects of earthquakes show that the base plates, although they prevent the effect of the uneven settlement on the integrity of buildings, with soft base soils make them very vulnerable to tipping. Examples of such accidents are well known (Niigata, 1964). In general, the question of the traditional increase in the intensity of a site in order to enhance them is still controversial, since even a second sagging of individual parts of a heavy building will lead to significant damage. Some authors believe that buildings are not recommended to be strengthened and believe that it is even harmful because, on soft soils, a heavy building may simply “sink” in the ground. Therefore, it is necessary to implement special measures to strengthen the soil itself.
When implementing the seismic impact of the expected level, and, as noted above this is the magnitude of M = 7 with an earthquake intensity of 9-10 points in the epicenter, an earthquake that is generated directly in the southern part of the city, will come to the investigated site with the same intensity.
Considering that soil liquefaction usually takes place for flooded soils already with 8-point intensity, a very realistic manifestation of a seismic event similar to Niigata (Fig. 6.) seems quite realistic at the “Vesna” site (Fig. 5). It should be noted that during the Niigata earthquake (Japan, 1964), good quality houses simply lay on the ground almost undamaged. With minimal social losses, the economic damage was great. For site No. 1 (Vesna), represented by the ground layer, which contains a layer of soil of flowing consistency, the economic loss a priori will increase by 2.5 times and, according to calculations, will amount to 400 million rubles. (Fig. 5). Due to the very high quality of buildings, by the way, designed for 8 points, social losses here will be minimal. Social losses during earthquakes are mainly determined by the level of damage to buildings and structures. At the same time, the so-called secondary effects in the form of landslides, soil liquefaction, floods can become defining and abnormally high at a certain confluence of negative factors. As noted above, it is necessary to note the problem of fires, which often accompany destructive earthquakes due to completely regular violations of gas pipelines, power lines, etc.
But most of the buildings are masonry type, especially in historical regions, some of them are unique and need a special approach for vulnerability assessment and reinforcement techniques for risk mitigation [27-30].
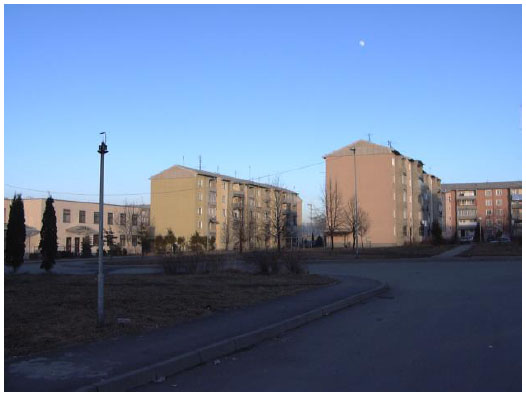
Mmax 7.1. Photo: T.V. Zaalishvili.
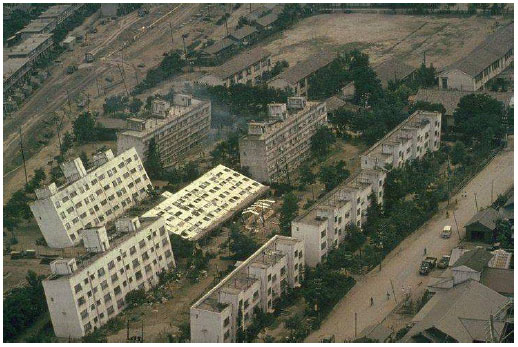
Mmax 7.5. Photo: Joseph Penzien.
CONCLUSION
1. The seismic risk assessment of a modern urbanized territory has been implemented by the example of the territory of Kuybyshev Street and adjacent quarters. Being a part of the old central part of the city, the considered street includes almost all types of buildings and structures common in the city and all the variety of ground conditions.
2. An assessment of the expected economic and social losses due to a seismic impact on the building stock has been implemented. Social losses during earthquakes are mainly determined by the level of damage to buildings and structures. At the same time, the so-called secondary effects in the form of landslides, soil liquefaction, floods can become defining and abnormally high at a certain confluence of negative factors.
3. The main indicators of the vulnerability of buildings and structures that form direct and indirect damage during earthquakes are considered. Vulnerability functions allow one to conduct a qualitative risk assessment, determine the level of possible damage to this type of structure, and, therefore, estimate the loss in an earthquake of a given intensity.
4. The classification of building stock on the Kuybyshev Street according to seismic vulnerability class is given.
5. The investigated area was divided into six sites. A number of factors were taken into account for the formation of seismic intensity assessment of the selected sites with corresponding characteristics (a type of soil, thickness of the layers, groundwater levels, topography and the presence of hazardous processes).
6. The database of building stock on Kuybyshev Street was created. This database includes all the necessary information on the buildings located along Kuybyshev Street and in the adjacent neighborhoods.
7. The features of building a model of seismic vulnerability of urban planning systems are considered.
8. Obtained materials analysis shows that in existing approaches it is quite difficult to define the vulnerability of modern buildings. In this regard, to determine the real effect of seismic intensity at a specific site, one must study and analyze the macroseismic materials on the response of traditional building stock.
9. The modern urban area is a system of objects with different vulnerabilities and often different local soil conditions. The seismic risk of building stock in such areas resembles quite complicated integrated tasks. The use of an integrated approach – geophysical, seismological, geotechnical, and engineering methods will increase the efficiency of obtaining results.
SUMMARY
Seismic risk assessment of a modern city on the example of a test area of the Vladikavkaz city is considered. The developed methodology is based on simple and effective statistical concepts of the MSK-64 scale. Risks of economical and social losses are ultimately different depending on site conditions and building type, for example, the social risk of the “Vesna” region is minimal due to a modern building type solution, while the economic risk is high due to liquefaction phenomenon. So seismic risk methodology was corrected for new types of buildings and it was shown that the MSK scale is effective but must be also actualized itself. The suggested methodology gives a rapid express assessment of seismic risk for decision making on buildings enforcement on a city level.
CONSENT OF PUBLICATION
Not applicable.
AVAILABILITY OF DATA AND MATERIALS
The data supporting the findings of the article is available in the github.com at https://github.com/melkovd/seismicrisk with reference number [31].
FUNDING
None.
CONFLICT OF INTEREST
The authors declare no conflict of interest.
ACKNOWLEDGEMENTS
The results of the paper were obtained within the state assignment of the Ministry of Science and Higher Education of the Russian Federation.

