All published articles of this journal are available on ScienceDirect.

Vibration Tests and Structural Identification of the Bell Tower of Palermo Cathedral
Authors Info & Affiliations
Abstract
Background:
The recent seismic events in Italy have underlined once more the need for seismic prevention for historic constructions of architectural interest and in general, the building heritage. During the above-mentioned earthquakes, different masonry monumental buildings have been lost due to the intrinsic vulnerability and ageing that reduced the structural member strength. This has made the community understand more that prevention is a necessary choice for the protection of monuments.
Objective:
The paper aims at demonstrating a strategy of investigation providing the possibility of health judgment, identifying a computational model for the assessment of structural capacity under service and exceptional loading like/due to high-intensity earthquakes. Considering its cost, the proposed approach is applicable only for monumental buildings. In detail, activity regarding the Bell Tower of the Palermo Cathedral is described. This investigation is framed in a huge campaign aimed at assessing the health of monuments in Palermo and their capacity to resist expected seismic actions.
Methods:
The process of the dynamic identification of the Bell Tower of Palermo Cathedral is discussed starting from the measurement of the response by high sensitivity seismometers and the analysis of the response signals. Then, the formulation of a Finite Element (FE) model of the tower is proposed after the identification of the main modal shapes. Once the Finite Element (FE) model was assessed, it was possible to evaluate the Bell Tower safety level in service and faced with exceptional loads.
Results:
The structural signals recorded along the height of the tower were analyzed to recognize the variation of the frequency content varying the external environmental loads. The signals were processed to obtain the experimental modal shapes. An FE model was defined whose mechanical parameters were successfully calibrated to give the experimental modal shapes.
Conclusion:
The analysis of the response signals made it possible to identify the actual behavior of the structure and its compatibility with the service loads. Further, an effective structural model of the Bell Tower of Palermo Cathedral was possible for assessing its capacity level.
1. INTRODUCTION
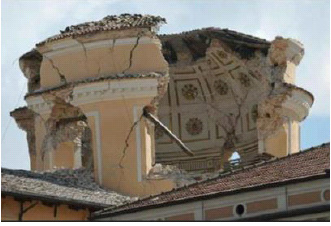
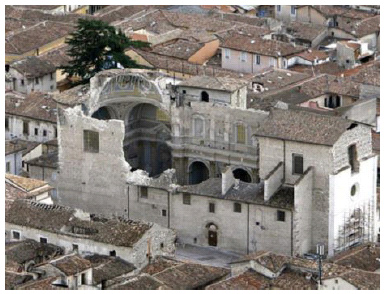
The recent seismic events in the Italian regions of Abruzzo and Lazio (i.e. the city of L’Aquila in 2009 and Amatrice in 2016 respectively) have underlined the need for seismic pre vention once more. Prevention is essential above all where the building heritage shows high vulnerability due to ageing and intrinsic characteristics of the construction typologies. It is well known that the buildings most vulnerable to seismic loads are masonry buildings. They are less able than others to resist horizontal actions because often the strength hierarchy is not satisfactory, the connections between the bearing members are difficult and/or not effective, the slabs are often very deformable, etc. Among all buildings, monumental ones certainly arouse great interest. The scenario that occurred in built-up areas hit by the earthquakes of L’Aquila or Amatrice was characterized by several monumental masonry constructions (Figs. 1-3), not always under good maintenance, and strongly damaged.

Past earthquake experiences underline how important it is to assess the state of maintenance of ancient masonry buildings and predict their response under earthquake loads. Where degradation phenomena are not evident, an assessment can be performed after monitoring the dynamic response under environmental excitations [1-6]. The analysis of the response makes it possible to notice how the excitations are amplified by the structure, detecting any non-linear behavior, and finding information about the effectiveness of the constraints between structural members. Structural monitoring also provides experimental data useful for the formulation of mathematical models [7-13] able to replicate a structural response consistent with the actual behavior. This assumes significant importance considering that the formulation of an adequate mathematical model is essential for the prediction of the structural response under excitations of exceptional intensity.
The assessment of the capacity is the starting point for design of interventions for the reduction of seismic vulnerability. Differently from the case of ordinary constructions made of reinforced concrete or masonry, for which many strategies can be adopted, (i.e. ones based on the introduction of devices able to dissipate the input seismic energy [14, 15] or based on the increment of the capacity of materials/members [16-18], in the case of monumental buildings, any intervention should be effective and compatible with the architectural value of the building, that is capable of not producing permanent modifications.
In this frame, this paper describes the experimental investigation carried out for monitoring the dynamic response of the Bell Tower of Palermo Cathedral under environmental loads. It is also shown how the acquired data can be used to obtain useful information about the seismic vulnerability of the tower. During the experimental campaign, no artificial excitation was induced beside the service loads (car traffic, wind, the action of the bells). Velocity transducers (seismometers) and acceleration transducers (accelerometers) were used for recording the response. The response of the structure, observed in the time domain through appropriate algorithms [19], was processed for a better interpretation. This experimental campaign was carried out after a series of structural interventions were applied on the tower and therefore it was also useful to have indications about their effectiveness. As will be shown, experimental data were also used for the formulation of a mathematical model of the tower.
2. HISTORICAL BACKGROUND AND CONSTRUCTIVE CHARACTERISTICS OF THE BELL TOWER OF PALERMO CATHEDRAL
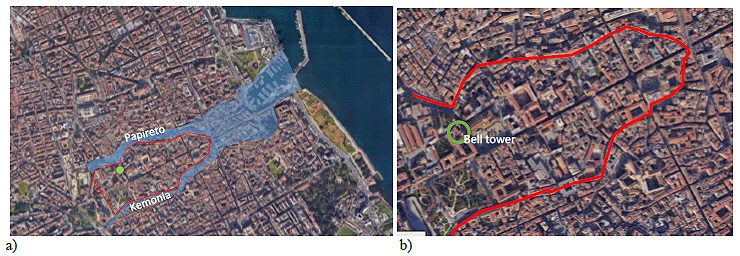
The Bell Tower of Palermo Cathedral is located in the old city alongside the ancient river Papireto, of which today the signs remain only in the orography of the territory. The Papireto and Kemonia rivers delimited the original Punic core of the city, as is shown in Fig. (4).
The first construction of the tower presumably dates back to the 6th century A.D [20]. when it served as a defensive tower. Since then the tower has gone through a number of structural interventions and changes of use.
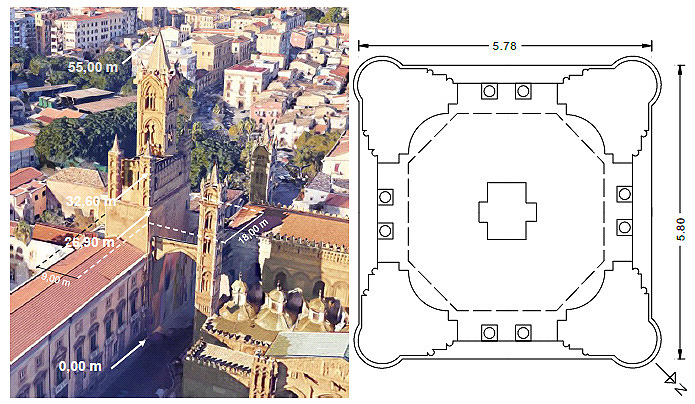
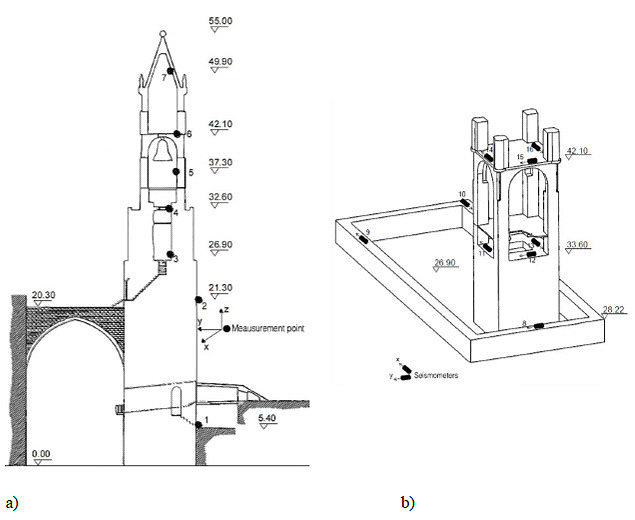
Between the 10th and 11th centuries, the tower reached its peak of importance with the construction of the two large arches connecting it to the Cathedral (Fig. 5a). During the 14th century the tower suffered a partial collapse, after which it was quickly rebuilt. The tower is over 50 meters high and its basement, rising to 26.9 m from ground level, has a rectangular cross-section of dimensions 9 m × 18 m. The secondary bells are in the part of the tower between a height of 26.9 m and a height of 32.6 m. Above 32.6 m the horizontal cross-section of the tower is reduced to a rectangle 8 m × 15 m, eccentric with respect to the basement. Then the tower has a square cross-section of 5.8 m (Fig. 5b). The main bell is close to the top of the tower. Ultimately, the tower is made up three distinct volumes: the basement, which is a solid volume; the middle part, where the secondary bells are located; and the top part, where the main bell can be found.
The tower is built almost entirely with stone material constituted by bioclastic calcarenite (sedimentary stone). The dimensions of the blocks used vary for the base and the remaining part of the structure. In the former, there are blocks whose largest dimension can be up to 110 cm, while in the latter the largest dimension of the blocks reaches 60 cm.
The construction has suffered considerable degradation which, in recent years, has made it impossible to use the main bell. Dynamic actions caused by bell tolls caused a risk of collapse for the walls that supported the anchorage axis of the bell. The use of the main bell was reactivated after the restoration interventions that were completed in 1997. The interventions were preceded by surveys on the state/ characteristics of materials.
To characterize the state of the masonry, core drillings, vertical and horizontal endoscopic examinations and chemical analysis were carried out. The stress state and mechanical characteristics were investigated in situ by flat jack tests [20].
The interventions consisted of superficial restoration of masonry, pulling of steel ties, reinforcement of the base through perforations and subsequent injections of high-strength mortar along its short side. Moreover, a steel structure was inserted at the top part of the tower (at 35 m from ground level), bounded to a reinforced concrete slab, to support the main bell.
After these interventions, the tower’s dynamic response was investigated to i) verify the suitability of the behavior of the structure; ii) formulate a mathematical model of the structure making it possible to predict its response to service loads and any exceptional loads, including earthquakes.
3. THE DYNAMIC RESPONSE OF THE TOWER
Knowledge of the dynamic response of a structure is fundamental to understand its behavior in response to environmental loads. Further, this is really useful to understand the evolution of the dynamic response through the years in such a way as to capture eventual damage states in progress.
For the current case the study was developed through the following steps: recording of the dynamic response and its analysis for identification of structural anomalies; identification of the modal frequencies and characterization of the modal shapes; quantification of dissipated energy; formulation of a mathematical model of the tower.
3.1. The Response Observation System
To characterize the behavior of the Bell Tower, it was necessary to observe the response at several points along its height and along two orthogonal directions. The analysis of a preliminary model of the tower, formulated using data obtained from the static tests carried out by Renda in 1996 [20], made it possible to define the frequency range to be investigated, and therefore the sensitivity of the measurement instrumentation. The choice of instrument sensitivity was influenced by the typology of the excitations (urban traffic, dynamic action of the bell, wind) and therefore by the need to evaluate small-scale responses in terms of both velocity and acceleration.
The instrumentation used during the experimental measurement consisted of 14 Geotech Teledyne mod. S13 seismometers with signal conditioners, 6 Bruel & Kjaers accelerometers with amplifiers, 2 Hewlett Packard spectrum analyzers, 1 oscilloscope, and 1 analogic signal recorder with 14 channels. The seismometers had the following characteristics: maximum displacement 3 mm, maximum sensitivity 1 mm/s/V, minimum sensitivity 0.001 mm/s/V, and frequency range 0.75 - 100 Hz. The reason for using the seismometers with these characteristics is because the high sensitivity of the instruments can record very low velocities like those produced by environmental noise. The characteristics of the accelerometers were the following: sensitivity 260 mV/g, frequency range 0.1 - 2800 Hz, and maximum acceleration 500 g.
It can be observed that what distinguishes accelerometers from seismometers is their sensitivity. The latter arw much more sensitive and have adjustable sensitivity and are therefore more suitable for measuring the velocity of weakly excited structures or ones with excitation of unknown intensity. For this reason, seismometers were preferred to detect the dynamic behavior of the tower while accelerometers were used to acquire accelerations of some secondary structural elements, such as the arches connecting the tower and the cathedral and the steel structure supporting the main bell.
The transducers (accelerometers and seismometers) were installed according to different methods related to the local particularities of the different measuring points: on the floor or positioned directly on cantilevers/ a cantilever connected to the wall (Fig. 6). A total of 13 measurement points were chosen. For 7 of these, 2 seismometers were simultaneously used, placed along two orthogonal directions. The remaining 6 were monitored by accelerometers. Figs. (7a and 7b) show some of the measurement points used. In detail, Fig. (7a) shows those used to identify the frequencies associated with the most important flexural shapes and Fig. (7b) shows those used to identify the frequencies associated with the most important torsional shapes. The measuring points were set by using the first results obtained from an FE model of the tower calibrated based on the static in situ test carried out in 1996 [20].
The recordings of the tower’s responses to environmental excitations (urban traffic, wind) were carried out in different conditions of input intensity during an ordinary day. In this way, it was possible to understand how the tower’s response changes during a day.
The reference system adopted provides the X-axis coinciding with the longer side of the tower, and the Z-axis along the height (Fig. 7a).
3.2. Setup of Measurements
Twelve separate surveys were carried out. These were different for the distribution of the instruments and the excitations. During the first four surveys, the seismometers were placed at seven points along the height of the tower, two for each point, one in the X direction and the other in the Y direction. This distribution was useful for characterization of the flexural harmonic components of the tower motion. During the first four surveys, the only source of excitation was environmental noise. The fifth survey provided the motion of the bells. Under such conditions, the amplitude of the structure’s response proved to be greatly amplified. During the sixth survey, seven seismometers were placed along the height of the tower in the X direction, at the previously mentioned points, and four seismometers were placed on the arches connected with the cathedral (two for each arch). This made it possible to study the interaction between the dynamic response of the tower and that of the connected arches.
During the remaining measurements, seismometers were positioned to characterize torsional harmonic components (Fig. 7b).

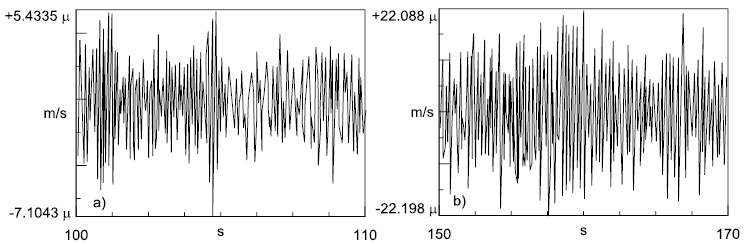
Figs. (8a and 8b) show two time recordings of the velocity at measurement point 1 and measurement point 7 in the X direction carried out during the transit of light vehicles along the street limiting the tower. The unit of the values of the ordinate axis is m/s·10-6. As can be seen, the magnitude of the velocity is very low. The maximum peak of instantaneous velocity does not exceed 6 microns/s for point 1 while for point 7 (top of the tower) it was about 20 microns/s. The recorded responses in the two horizontal directions at the top of the tower during the transit of heavy vehicles produced an increase in the maximum velocity peak which reached 40 microns/s in the X direction and about 65 microns/s in the Y direction. The complete series of recordings can be found in another study [21].
3.3. Algorithm for Signal Processing
In processing the signals, it was supposed that these were stationary and therefore that the input intensity was constant for an adequate time interval. The assumption was verified by assuming time windows of about 10 s, for which the mean and the standard deviation were evaluated. Further, considering the low amplitude of the response, an approach based on the linear behavior of the system was used [19].
Considering that:
- The response of a continuous system can be decomposed into the sum of infinite harmonic motions (each of which is obtained by modulating modal shapes with a harmonic function of time);
- Each harmonic motion contributes in a different way to the overall motion of the system;
- A frequency is associated with each harmonic;
to identify the frequencies of the harmonics that mostly contributed to the motion of the tower, the following identification approach was used. For each stationary signal, the autocorrelation function RQQ was first calculated. This function is defined as:
 |
(1) |
where E [·] is the mean of the quantities within square brackets, while Q(t) is a generic signal. Eq. (1) expresses the degree of statistical dependence of a signal at time t1 with the same signal at time t2.
The autocorrelation function does not depend on times t1 and t2 individually taken but on their difference τ = t1-t2. Then it is possible to calculate its Fourier transform obtaining the power spectral density function SQQ, that Eq.(2) is:
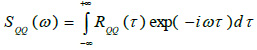 |
(2) |
The Fourier transform of the autocorrelation function, defined in the frequency domain, provides information on the frequency content of each signal. This means that, given a value of frequency ω, the corresponding value of SQQ is a measure of how much the harmonic with frequency ω contributes to the motion of the system. This means that the peaks of the function correspond to the frequencies of the harmonics which presumably make the largest contribution to the motion of the system.
If instead of using the same signal, two different signals are used, i.e. Q(t) and G(t), Eq. (1) assumes the form:
 |
(3) |
This function provides information on the degree of statistical dependence between two distinct signals at two different times. In this case too, the correlation function depends on the difference τ between the instants t1 and t2 and not on the times individually taken.
Equivalently, Eq. (3) can be expressed in the frequency domain through its Fourier transform as:
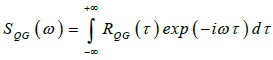 |
(4) |
In this case, SQG is the spectral power density of Q and G signals.
Using Eq. (2) and Eq. (4) it is possible to determine the coherence function γ2 between the acquired response at the generic measure point and the one acquired at a reference measurement point. The coherence function is defined Eq.(5) as follows:
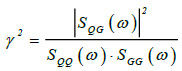 |
(5) |
This function, depending on the generic value of the frequency ω, assumes values between 0 and 1. The coherence function assumes the value 1 if the two considered signals are linearly dependent. For the current case, evaluation of the coherence function made it possible to verify the linear behavior of the system and the absence of noises that would have invalidated all the operations discussed hereinafter.
To evaluate how much the response of a measurement point of the tower at the various frequencies is amplified in comparison to a reference measurement point the pseudo transfer function H(ω) was used, that is:
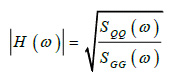 |
(6) |
Eq. (6), which provides information about the linearity dependence between two signals, has a physical meaning where the coherence function assumes unit values and therefore, before being used, it has to be compared with the power spectral density functions, as in Fig. (9).
To get any information about the phase ratio between two signals it is important to note that the pseudo transfer function H(ω) can be written as:
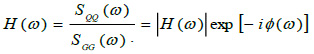 |
(7) |
where ϕ is the phase ratio at an assigned frequency ω. Calculating SQQ, SGG, SGQ through Eq. (6) and Eq. (7) it is possible to find the amplitude ratio and phase ratio between the signals Q(t) and G(t) at the different frequencies and therefore to construct the shape of the system at the i-th frequency. Fig. (10) shows two of the dominant shapes (normalized with respect to the reference point) and the associated frequencies detected experimentally.
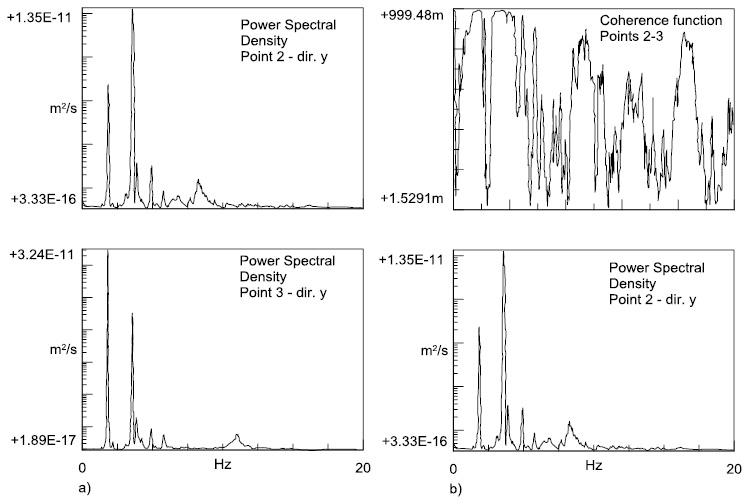
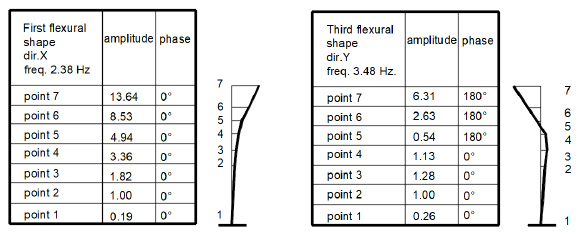
To define the most important flexural shapes, point 2 of the measurement grids was taken as a reference. This means that all comparisons in terms of amplitude of the response and phase ratio were made with respect to point 2. Likewise, in the case of the torsional shape, points 8, 9 and 10 were taken as a reference (see Fig. (7) for location of the measurement points).
All the quantities involved (Fourier transform, correlation functions, power spectral density) were calculated numerically once the signals were digitalized.
4. INTERPRETATION OF THE STRUCTURAL RESPONSE
The analysis of the recorded signals with different dispositions of the measuring instruments made it possible to identify eight frequencies and the associated modal shapes (6 mainly flexural and two torsional). During oscillation of the bells, the tower maintained linear behavior: no variations of the frequencies associated with the main shapes were observed with variation of the input intensity.
Interesting observations were made regarding the structural response related to oscillation of the major bell (dir. y). The latter is supported by a steel frame connected to a reinforced concrete slab placed at a height of 35.30 m inside the tower. It is possible to observe (Fig. 11a) that the amplitude of the response suddenly increases as the clapper hits the bell. Moreover, the amplitude of the response is not further amplified at each subsequent toll. This indicates that the structure that supports the bell filters the actions due to the motion of the bell in such a way that the highest powers occur at frequencies which are different from the dominant ones and that the tower can suddenly dissipate all the energy that is supplied to each toll. Fig. (11b) shows that during movement of the major bell the tower moves mainly according to the flexural shape having a frequency equal to 1.72 Hz, while the remaining shapes make no significant contribution.
During every survey carried out in a week, no variations of the dynamic behavior of the tower were observed and therefore no evident damage phenomena happened due to service loads. The measured values constitute a reference to verify any degradation phenomena that may take place in the future.
5. STRUCTURAL IDENTIFICATION
After the acquisition and analysis of the structural response, a mathematical model for the tower was formulated. The latter was used to evaluate the response to excitations of strong intensity. With the analytical tools available it was possible to calibrate a finite element model obtaining the eight prevailing modal shapes of the tower and the related frequencies, so it was also possible to identify the stiffness distribution and to characterize the external constraints (connections between arches and tower).
The calibration was carried out using the modal response obtained from the Abaqus/CAE software compared with the experimental response. The mean square error was minimized through a code written in MATLAB.
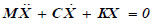
The discrete mathematical model selected for the unforced system has the form:
 |
(8) |
where M is the mass matrix, C the dissipation matrix, K the stiffness matrix, and Ẍ, Ẋ, X are respectively the vector of the accelerations, the velocities and the displacements of the model nodes. In the Eq. (8), C and K are unknown.

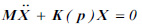
For the evaluation of K it was supposed that it depended on a certain number of parameters pi. The strategy was to minimize the square between the modal values obtained by solving the eigenvalue problem, that is the solutions of the Eq. (9):
 |
(9) |
Therefore, the vector of the modal displacements being named Y(p), where p is the vector containing the unknowns pi, and YR is the vector containing the corresponding quantities obtained from the experimental analysis, the difference was defined in Eq. (10) as:
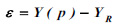 |
(10) |
and its square as in Eq. (11):
 |
(11) |
The solution to the problem was obtained from the system of Eq. (12):
 |
(12) |
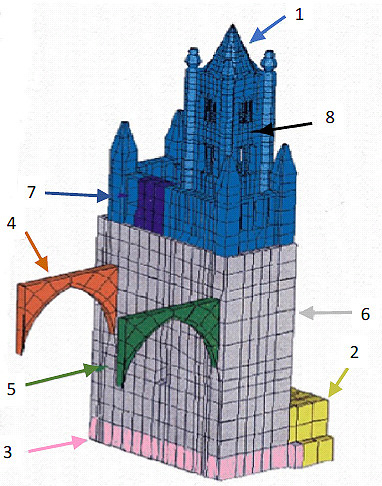
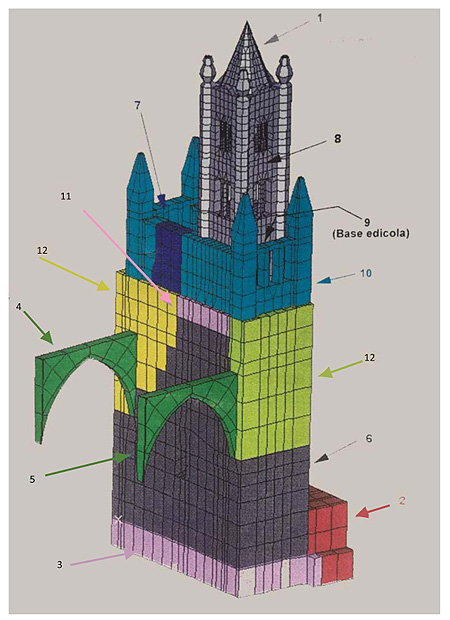
In the case in object for the unknowns pi, first the elastic Young moduli of eight homogeneous volumes of the tower (homogeneous from the point of view of the materials) were chosen, then the results were improved by increasing the number of homogeneous volumes to 13 and introducing, as unknowns, the stiffnesses of the support provided by each of the two arches connected to the Cathedral. The homogeneity was recognized by the investigations in a study [20]. Figs. (12 and 13) show the abovementioned volumes in the FE model. The rigidity moduli of the materials were obtained in agreement with a study [22].
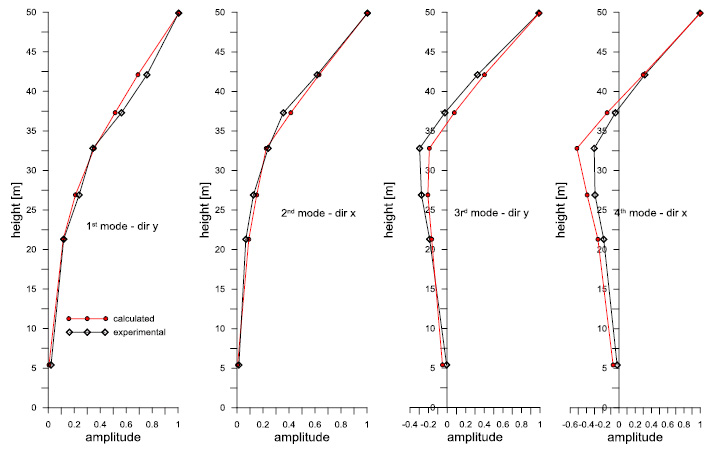
Table 1 reports the values of the frequencies related to the prevailing shapes and the modal frequencies achievable from the FE model, while Fig. (14) shows two of the mode shapes in question obtained by the FE model. In Table 1 good agreement can be noticed between the frequency values obtained experimentally and using the FE calibrated model. The same agreement was found between the prevailing shapes experimentally obtained and the modal shapes obtained from the mathematical model (Fig. 15).
| – | 1° flex. y | 2° flex. x | 3° flex. y | 4° flex. x | 5° tors. | 6° tors. |
|---|---|---|---|---|---|---|
| Experimental Frequencies [Hz] | 1.72 | 2.38 | 3.48 | 3.95 | 4.76 | 5.60 |
| Identified Modal Frequencies [Hz] |
1.743 | 2.281 | 4.125 | 4.443 | 4.649 | 5.364 |
In conclusion, the material elastic Young moduli of the homogeneous volumes defining the stiffness matrix K were estimated in such a way as to reproduce the stiffness of the real structure.

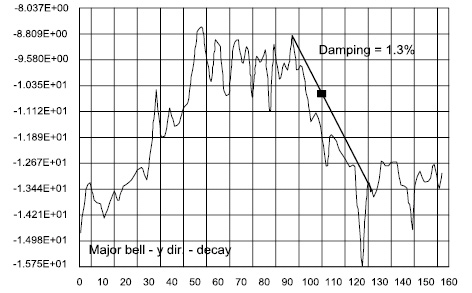
As for the dissipative characteristics many difficulties were encountered, mainly because it was not easy to achieve univocal dissipation parameters. The dissipative characteristics were summarized with a single parameter ζ, such that ϕiTCϕi=2ςωi, in which ϕi is the i-th modal shape and ωi the associated frequency. The parameter ζ was estimated in an approximate way observing the decay of the amplitude of the tower’s response at the end of the sound of the major bell. In detail, the damping coefficient was evaluated by a/the logarithmic decay law applied to the amplitude of the resonant frequency, calculated by a Short-Time Fourier Transform (STFT) for a time window of two seconds. The value of the damping coefficient proved to be 1.3% (Fig. 16).
The mathematical tool obtained also made it possible to verify the structure under seismic loads. The seismic verification was carried out using response spectrum analysis, whose results are not presented in this paper for the sake of brevity.
CONCLUSION
The paper presents the survey carried out to evaluate the health state of the Bell Tower of Palermo Cathedral and its identification. The campaign for the acquisition of the structural response is described in detail as is its processing for the formulation of an FE model to be used for assessment of the structure.
Considering that the response to environmental excitations was observed and that the structures’ own frequencies did not undergo modifications with variation in the level of the external loads, a linear behavior was recognized. Hence a procedure for the identification of linear systems was applied. The identification procedure was applied in two stages:
- In the first one, the experimental modal shapes and the associated frequencies were determined.
- In the second one, the stiffness matrix of the structure was identified by imposing the minimum of the difference between the theoretical modes and the experimental ones. The viscous dissipation characteristics were identified by observing the decrement of the response after the bells rang.
After the identification procedure, it can be concluded that the tower presents a suitable behavior under service loads.
CONSENT FOR PUBLICATION
Not applicable.
AVAILABILITY OF DATA AND MATERIALS
Not applicable.
FUNDING
None.
CONFLICT OF INTEREST
The authors declare no conflict of interest, financial or otherwise.
ACKNOWLEDGEMENTS
Declared none.

