All published articles of this journal are available on ScienceDirect.

Empirical Model Of Unreinforced Beam-column RC Joints With Plain Bars
Abstract
Background:
Nonlinear behaviour of beam-column joints might significantly affect seismic performance of typical existing buildings, especially in the case of poor structural detailing, as the lack of an adequate transverse reinforcement in the joint panel or deficiencies in the anchorage details. A very limited number of studies deals with beam-column joints reinforced with plain hook-ended longitudinal bars, widespread in Mediterranean building stock, or with the analysis of local aspects, such as the evaluation of joint shear strain capacity. The almost totality of the models proposed in the literature for simulating the cyclic behaviour of RC joints was calibrated by means of tests performed on elements with deformed bars. Such models may be not suitable for elements with hook-ended plain bars, due to their peculiarities in terms of failure mode and concrete-to-steel interaction mechanisms.
Objective:
An empirical macro-modeling approach is proposed in this work for exterior unreinforced joints with hook-ended plain bars, suitable for extensive nonlinear analyses.
Methods:
A dedicated database of experimental tests is first collected. Based on this dataset, a shear strength model is developed. The joint panel constitutive parameters are also defined to reproduce the cyclic experimental joint shear stress-strain behaviour.
Results:
The whole modeling approach is validated through the comparison with the collected experimental data. It well reproduces the global response, in terms of elastic stiffness, global deformability, softening stiffness, unloading and reloading stiffness degradation and pinching effect for all the investigated tests.
Conclusion:
The proposed model thus results reliable for the investigated typology of beam-column joints.
1. INTRODUCTION
Past and more recent earthquakes in the Italian and Mediterranean area have shown a high vulnerability of the existing building stock subjected to ground shaking [1-3]. The overwhelming majority of the existing Reinforced Concrete (RC) buildings is “non-conforming” to the most recent and updated technical and seismic codes. The design of such buildings was often proposed only for gravity loads or according to old seismic codes. In these cases, no strength hierarchy principles have been applied by the designers, so that, generally, shear failures are very likely, especially in beam-column intersections without a proper transverse reinforcement, thus limiting the achievement of the flexural capacity of the ductile elements [4, 5].
In the last decades, a significant amount of experimental studies has been performed to assess the seismic performance of unreinforced beam-column intersections (e.g., [6-8]). These studies often analyzed the beneficial or detrimental effect of some parameters (for example column axial load, concrete strength, joint aspect ratio, or beam longitudinal reinforcement ratio) on joint shear strength. Few researchers try to experimentally assess the seismic performance of joints without stirrups in the joint core and with plain hook-ended longitudinal reinforcing bars in beams and columns, widespread in the existing RC building stock of the Mediterranean region. Some of them tested beam-column joints with a minimum amount of transverse reinforcement in the joint panel [9-11], or assessed the effect of axial load ratio [9, 11] or different anchorage details [9, 11, 12] on joint shear strength and hysteretic dissipation capacity. Other works in the literature also compared the experimental performance of interior and exterior joints with plain bars without stirrups in the joint core [13-15] or tested possible retrofitting strategies mainly to increase the shear strength of this joint typology (e.g [16].). These experimental studies proved that exterior joints are more vulnerable to shear failures with respect to interior joints [15] and highlighted (i) the influence of the slippage of longitudinal bars on the response of such elements [15, 17], and (ii) a typical failure mode that exhibits the detachment of a concrete wedge from column cover especially for exterior joints (mainly due to the stress concentration at the hook anchorage location after the shear cracking of the joint panel) [13]. Finally, eight tests were performed by the authors [18-21] on unreinforced exterior beam-column joints, comparing the performance of joints with plain and deformed bars, and investigating about the effect of beam longitudinal reinforcement amount and joint aspect ratio on joint shear strength, failure mode, and deformability contributions.
The number of tests performed on RC joints without a proper transverse reinforcement with hook-ended plain bars in beams and columns is certainly very low if compared with the amount of data available for unreinforced RC joints with deformed bars [19]. Furthermore, these few tests are generally designed and realized to reproduce different constructive practices, typical of different countries, resulting in a great inhomogeneity in terms of main features of the specimens (e.g. anchorage details, or presence of a minimum amount of ties in the joint core). Researchers often focused their attention mainly on the joint shear strength; thus, only a few of them provided experimental values for joint shear strains, nevertheless the crucial role of these data to reproduce the seismic behaviour of joints through numerical modelling in a reliable way.
Furthermore, only two strength models exist in literature properly for this joint typology. The first one was proposed by Pampanin et al. [13]. On the basis of two tests on T-joints, they proposed a limitation of the traditional shear strength model adopted for joints with deformed bars [22], which appeared to be necessary due to the peculiarities of the observed failure mode (with the above-mentioned detachment of a concrete cover wedge). The resulting joint shear strength only depends on concrete compressive strength, not taking into account the effects of other parameters such as joint aspect ratio or longitudinal reinforcement of the adjacent members (often defined as key parameters, for example, by Park and Mosalam [23] for joints with deformed bars). The second model was more recently proposed by Metelli et al. [24], on the basis of a modification of the mechanical-based approach by Hwang and Lee [25] and a validation phase based on five tests with plain bars.
Certainly, more experimental data are necessary to assess and validate the existing models or to propose a new model for this kind of elements due to their peculiarities in failure mode and steel-concrete interaction quality. Furthermore, a complete characterization of the nonlinear local response of the joint panel and fixed-end-rotation contribution is necessary to clearly understand the joint behavior under cyclic loading and to reliably model this element for structural analyses of non-conforming RC frames. Therefore, in this work, an empirical macro-modeling approach is proposed for exterior unreinforced joints with hook-ended plain bars in beam and columns, suitable for extensive nonlinear analyses. A dedicated database of experimental tests is first collected. Based on this dataset, a proper shear strength model is carried out, starting from the analysis of previous proposals from the literature. The joint panel constitutive parameters are also defined to reproduce the cyclic experimental joint shear stress-strain behaviour. Finally, the whole modeling approach is validated through the comparison with experimental results.
2. EXPERIMENTAL DATABASE
Data about tests on exterior unreinforced RC joints with plain hook-ended longitudinal bars are first collected from the literature. In the literature, there are a very small number of tests about this structural typology. Some of them reproduce the presence of the RC slab or of the transverse beam (e.g [26].); some others also consider the presence of welded (not hook-ended) longitudinal bars of the beam [11]. Nevertheless, in this study, a homogeneous subset of tests has been analyzed, namely only tests without transversal beams or slab and hook-ended bars are considered; therefore, 16 tests belong to the presented database, on the whole. Main geometrical and mechanical properties of these specimens are reported in Table 1.
| # | Reference | ID | ν | bc | hc | bb | hb | fc | As,b,bot | As,b top | As,c | Lb | Lc |
|---|---|---|---|---|---|---|---|---|---|---|---|---|---|
| (-) | (mm) | (mm) | (mm) | (mm) | (MPa) | (mm2) | (mm2) | (mm2) | (mm) | (mm) | |||
| 1 | Genesio [33] |
pre1970s | 0.21(+) | 230 | 230 | 230 | 330 | 17.7 | 314 | 314 | 236 | 1409 | 835 |
| 2 | JT2-1 | 0.00 | 350 | 300 | 300 | 400 | 24.4 | 829 | 829 | 943 | 1700 | 1415 | |
| 3 | Bedirhanoglu et al. [11] | JO5 | 0.13 | 250 | 500 | 250 | 500 | 8.3 | 804 | 804 | 804 | 1360 | 1250 |
| 4 | Pampanin et al. [13] and Moratti [42] |
T1 | 0.13(+) | 200 | 200 | 200 | 330 | 23.9 | 327 | 327 | 151 | 1500 | 1000 |
| 5 | T2 | 0.13(+) | 200 | 200 | 200 | 330 | 23.9 | 214 | 214 | 151 | 1500 | 1000 | |
| 6 | Melo et al. [12] |
TPA-1 | 0.13 | 250 | 250 | 250 | 400 | 24.2 | 339 | 339 | 226 | 1875 | 1300 |
| 7 | TPA-2 | 0.12 | 250 | 250 | 250 | 400 | 25.8 | 339 | 339 | 226 | 1875 | 1300 | |
| 8 | TPB-1 | 0.20 | 250 | 250 | 250 | 400 | 15.8 | 339 | 339 | 226 | 1875 | 1300 | |
| 9 | TPB-2 | 0.12 | 250 | 250 | 250 | 400 | 27.3 | 339 | 339 | 226 | 1875 | 1300 | |
| 10 | TPC | 0.13 | 250 | 250 | 250 | 400 | 23.8 | 339 | 339 | 226 | 1875 | 1300 | |
| 11 | Ricci et al. [19] |
1P | 0.10 | 300 | 300 | 300 | 500 | 28.7 | 1257 | 1257 | 1257 | 1650 | 1450 |
| 12 | 2P | 0.10 | 300 | 300 | 300 | 500 | 28.7 | 616 | 616 | 616 | 1650 | 1450 | |
| 13 | De Risi and Verderame [20] |
1bP | 0.10 | 300 | 300 | 300 | 400 | 17.7 | 1257 | 1257 | 1257 | 1650 | 1500 |
| 14 | 2bP | 0.10 | 300 | 300 | 300 | 400 | 17.7 | 804 | 804 | 1257 | 1650 | 1500 | |
| 15 | 1cP | 0.10 | 300 | 300 | 300 | 600 | 17.7 | 1257 | 1257 | 1257 | 1650 | 1400 | |
| 16 | 2cP | 0.10 | 300 | 300 | 300 | 600 | 17.7 | 804 | 804 | 1257 | 1650 | 1400 |
All of these tests were (i) characterized by low-medium concrete compressive strength (fc) and weak beam-strong column hierarchy and (ii) generally performed by applying a constant axial load (N) on the column (except than for tests #1, 4, 5), and an imposed displacement history on the beam (loading scheme (LS) “beam”) or column (LS “column”) tip. In Table 1, Lb and Lc represent the beam and column clear length, respectively. The parameters bb and bc are the beam and column width, respectively; hb and hc are the beam and column height, respectively. As,b,bot, As,b,top are bottom and top longitudinal reinforcement in beam; As,c represents longitudinal reinforcement in the column. Finally, ν is the column axial load ratio (ν=N/(bc·hc·fc)).
For each collected test, Table 2 shows the maximum beam shear measured during the test (Vb,TEST), the shear corresponding to beam yielding (Vb,yield) and the “observed” failure mode (FM) - namely, joint failure after beam yielding, BJ-mode, or without beam yielding, J-mode - which can be determined by comparing these two values. The shear corresponding to the flexural strength of the beam (Vb,flex) - evaluated only for BJ-failure modes - is also reported. In particular, the yielding moment and the flexural strength are evaluated on a fibre section by assuming Mander et al. [27] constitutive relationship for concrete and elastic-plastic with strain hardening relationship for reinforcing steel.
| Test | Vb,TEST (*) | Vb,yield | Vb,flex |
FM obs (**) |
 |
 |
 |
Experimental Joint Shear Strain |
|---|---|---|---|---|---|---|---|---|
| # | (kN) | (kN) | (kN) | (MPa0.5) | ||||
| 1 | 24.80 | 26.82 | - | J | 0.49 | 0.53 | - | no |
| 2 | 41.50 | 47.89 | - | J | 0.44 | 0.50 | - | no |
| 3 | 51.50 | 82.86 | - | J | 0.39 | 0.63 | - | no |
| 4 | 16.00 | 22.91 | - | J | 0.38 | 0.55 | - | no |
| 5 | 16.10 | 15.16 | 18.87 | BJ | 0.39 | 0.36 | 0.45 | no |
| 6 | 28.20 | 25.26 | 31.57 | BJ | 0.44 | 0.39 | 0.49 | no |
| 7 | 29.40 | 25.29 | 31.60 | BJ | 0.44 | 0.38 | 0.47 | no |
| 8 | 27.75 | 24.97 | 31.47 | BJ | 0.53 | 0.48 | 0.60 | no |
| 9 | 29.55 | 25.35 | 31.56 | BJ | 0.43 | 0.37 | 0.46 | no |
| 10 | 27.30 | 25.25 | 31.59 | BJ | 0.42 | 0.39 | 0.49 | no |
| 11 | 79.24 | 109.38 | - | J | 0.57 | 0.78 | - | yes |
| 12 | 52.82 | 50.59 | 77.94 | BJ | 0.38 | 0.36 | 0.55 | yes |
| 13 | 51.70 | 89.58 | - | J | 0.62 | 1.41 | - | yes |
| 14 | 50.30 | 52.50 | - | J | 0.60 | 0.80 | - | yes |
| 15 | 68.40 | 165.50 | - | J | 0.50 | 1.47 | - | yes |
| 16 | 46.90 | 83.56 | - | J | 0.34 | 0.82 | - | yes |
(*) Vb,TEST is the maximum experimental beam shear. When LS is “column”, Vb,TEST is obtained from the rotational equilibrium of the (iso-static) sub-assemblage
(**) FM obs. = observed failure mode: “J”=joint shear failure without beam yielding; “BJ”=joint shear failure after beam yielding.
Joint shear (Vjh) is obtained from beam shear (Vb) through equilibrium equations, based on the geometrical characteristics of the specimens, by using Eq. (1):
 |
(1) |
where d* is the internal lever arm of the beam, defined as d*.d, and d is the effective depth. Fiber section analyses provide, on average, k=0.90 at beam yielding [19]. Hence, the shear stress values corresponding to peak strength (τj,TEST/√fc), beam yielding (τj,yield/√fc) and beam flexural strength (τj,flex/√fc) can be calculated by dividing the corresponding joint shear Vjh by the horizontal joint area, Ajh (Table 2).
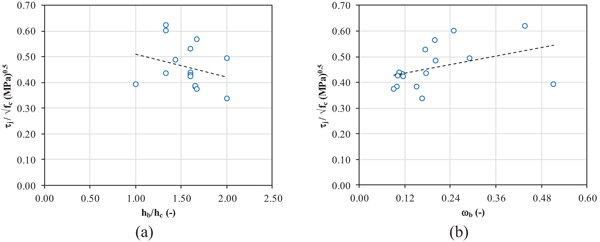
It is worth noting that τj,TEST/√fc results to increase if mechanical reinforcing percentage in the beam (ωb) increases, whereas τj,TEST/√fc decreases when joint aspect ratio (hb/hc) increases (Fig. 1), as also observed in [19, 20].
Furthermore, note that in only six cases (i.e., tests by [19, 20]), joint shear strain evolutions under cyclic loading are experimentally obtained and explicitly presented by the Authors (see the last column in Table 2).
3. SHEAR STRENGTH MODEL
Experimental peak shear strength for the collected tests is compared with the prediction of some of the main capacity models from literature and codes for unreinforced beam-column exterior joints, thus evaluating their effectiveness, also depending on the observed failure mode. Four of the most consolidated existing capacity models, namely models by Priestley [28], ASCE-SEI 41 [29], Park and Mosalam [23] and Jeon et al. [30], are analysed in Section 3.1, together with the model proposed by Pampanin et al. [13], which is specifically obtained from tests related to joints with hook-ended plain bars, as explained in Section 1. Then a new empirical model is proposed and presented in Section 3.2 to improve the accuracy of the predicted shear strength for the investigated joint typology.
3.1. Models From Literature
The experimental values of maximum joint shear stress (τj,max/√fc) are compared with shear strength predictions by some of the main and most recent predictions from literature.
One of the mainly adopted shear strength models for unreinforced joints in literature was proposed by Priestley [28]. Such a proposal limits the maximum allowable value of the principal tensile stress to 0.42√fc, so that joint shear strength can be computed as shown in Eq. (2):
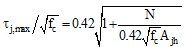 |
(2) |
More recently, also Park and Mosalam [23] proposed a mechanical approach for exterior unreinforced joints. According to this model, joint shear strength decreases if beam yielding occurs due to the detrimental effect on the bond quality between concrete and steel after yielding. In this case, joint shear strength can be obtained from Eq. (3):
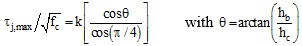 |
(3) |
In Eq. (3), τj,max depends on the joint aspect ratio (hb/hc) and the coefficient k accounts for the effect of the beam longitudinal reinforcement ratio (it also provides a failure mode prediction [23]).
A regression-based shear strength model has been also proposed by Jeon et al. [30] on the basis of a huge amount of collected experimental data on beam-column joints. Jeon et al. [30] proposed a probabilistic model for unreinforced exterior joints assuming that joint shear strength depends on (Eq. 4): concrete compressive strength (fc), maximum joint shear demand (τd), in-plane and out-of-plane geometry factors JP (assumed equal to 0.75 for exterior joints, respectively) and TB (equal to 0 if less than two transverse beams are present), joint aspect ratio, column-to-beam nominal moment strength ratio (MR), and ratio of intermediate column reinforcement strength to design joint shear demand (β).
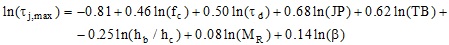 |
(4) |
For all the above-mentioned models, the totality of experimental data adopted for the calibration or the validation of the proposals was related to joints with deformed longitudinal reinforcing bars.
Vice-versa, specifically for exterior joints with hook-ended plain longitudinal rebars and without transverse reinforcement in the joint core, only Pampanin et al. [13] and Metelli et al. [24] carried out two proposals for joint shear strength, even if (necessarily) calibrated-on/compared with a very small number of experimental tests from literature. In particular, Pampanin et al. [13] suggest to modify the proposal by Priestley [22] by limiting the principal tensile stress (pt) at the first joint cracking, namely at 0.20√fc. Therefore, according to this joint strength model, peak strength is assumed to be equal to the cracking strength, as shown in Eq. (5):
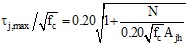 |
(5) |
Metelli et al. [24] also adopted the latter model and concluded that the mean relative error evaluated on some experimental tests from literature is, on average, the closest to zero.
The results of the comparisons between experimental shear strength and predicted values according to the above-mentioned models are reported in Table 3 and graphically shown in Fig. (2).
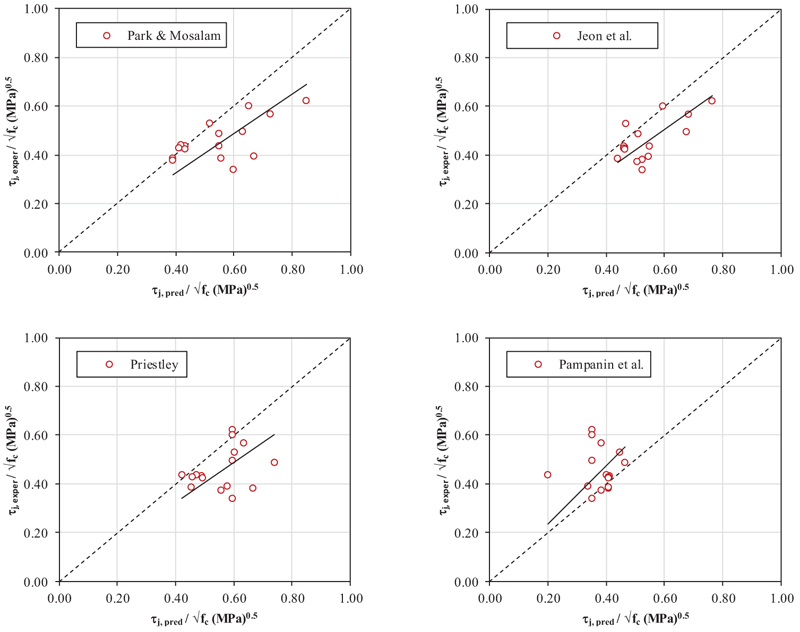
For each one of the capacity models mentioned above the predicted shear strength (τj,pred/√fc) is calculated for all tests. It is worth noting that, since the joint shear demand cannot exceed the joint shear compatible with beam flexural capacity (in cases of weak beam/strong column), τj,pred/√fc should be limited to τj,flex/√fc. This limitation is already implicit for models by Park and Mosalam [23] and Jeon et al. [30], since their definition of joint shear strength. When τj,pred/√fc has been limited to τj,flex/√fc the predicted-to-experimental ratio is highlighted in grey in Table 3.
Generally speaking, joint shear strength capacity models proposed for unreinforced joints with deformed longitudinal reinforcement, like [23] and [30], overestimate the shear strength of joints with plain bars (by 20% and 19%, respectively). Such an overestimation is observed, in particular, in the case of J-failure mode (+37% and +27% respectively, for models by [23] and [30], respectively), and less significantly in the case of BJ-failure mode (-1% and +10%, respectively). This result, according to the approach of Park and Mosalam [23], can be likely explained by the higher strength contribution developed by the bond resistance of the concrete surrounding the beam reinforcement in joints with deformed longitudinal reinforcement, compared to joints with plain longitudinal reinforcement [19].
Similarly, also the model by Priestley [28] overestimates the shear strength of joints with plain bars, by 24%; again, such an overestimation is higher in the case of J-failure mode (+30%) and lower in the case of BJ-failure mode (+17%). In the case of observed BJ-mode, it has to be noted that, for Priestley’s [28] model, the predicted shear strength has to be limited to the beam flexural strength in all cases. In these cases, the predicted-to-experimental ratio does not depend on the joint shear strength predicted by the model, but rather on the predicted beam flexural strength; thus, the predicted-to-experimental ratio does not represent the predictive capacity of the model. On the contrary, the model by Pampanin et al. [13], proposed as a modification of the model by Priestley [28] for joints with plain bars, underestimates the joint shear strength on average by 15%, showing, in particular, a good predictive capacity in the case of BJ-failure mode.
3.2. Proposed model
In the previous Section, it has been observed that main shear strength models proposed in the literature for unreinforced beam-column joints with deformed bars overestimate, on average, the experimental joint shear strength. Such an overestimation is likely due to the overestimation of the strength contribution developed by the bond resistance of the concrete surrounding the beam reinforcement, compared to joints with plain longitudinal reinforcement, as already observed in [19]. On the contrary, the lonely model proposed for unreinforced joints with hook-ended plain bars underestimates the experimental strength. Joint shear strength predicted by such a model does not depend on joint aspect ratio or beam longitudinal reinforcement, thus resulting in not being able to reproduce the experimental trends found and presented in Fig. (1). Therefore, a new simple shear model, empirically-based, is proposed herein starting from the analysis of the tests results from the collected database.
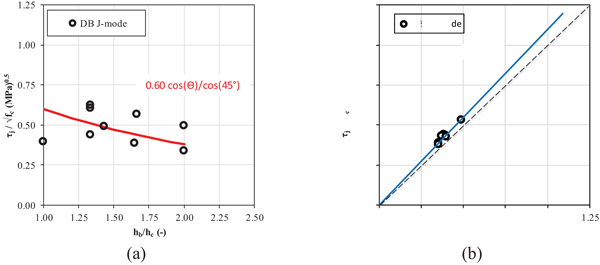
First of all, it has been already observed that joint shear strength decreases when the joint aspect ratio decreases. This behavior can be ascribable to a compressive-strut mechanism developing in the unreinforced joint core, which is able to provide a higher horizontal shear strength when its inclination with respect to the horizontal direction (Ɵ) decreases [23, 28]. If tests characterized by a J-failure mode are first analyzed, such a trend can be described by means of the red regression curve reported in Fig. (3a). A similar trend has been found for joints with deformed bars by Park and Mosalam [23], which finally proposed a relationship between joint aspect ratio and joint shear strength where the proportionality factor k (see Eq. 4) is assumed equal to the unity (instead than 0.6, as proposed herein for joints with plain bars, based on the experimental evidence). Furthermore, it was observed that when the mechanical longitudinal reinforcement ratio of the beam decreases, joint shear strength also decreases (Fig. 1b), in particular for the tests characterized by a BJ-failure mode, for which τj,TEST necessarily ranges between τj,y and τj,flex. More in details, if tests with a BJ-failure mode are analysed, it can be observed that the joint shear strength can be assumed as proportional to τj,y, in particular through a proportionality factor evaluated by means of the linear regression shown in Fig. (3b) and equal to 1.10, on average. Such a coefficient results higher than the unity likely due to a possible beam hardening that allows an increase in joint shear demand with respect to τj,y up to the achievement of joint shear strength.
In summary, joint shear strength can be predicted according to Eq. (6):
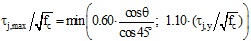 |
(6) |
| Experimental | Priestley (1997) |
Park and Mosalam (2012) |
Jeon et al. (2014) | Pampanin et al. (2002) | ||||||||||||
|---|---|---|---|---|---|---|---|---|---|---|---|---|---|---|---|---|
| # | Obs FM |
|
|
|
 |
pred FM |
pred/ test |
|
pred FM |
pred/ test |
|
pred FM |
pred/ test |
|
pred FM |
pred/ test |
| (MPa)0.5 | (MPa)0.5 | (MPa)0.5 | (MPa)0.5 | (MPa)0.5 | (MPa)0.5 | (MPa)0.5 | ||||||||||
| 1 | J | 0.49 | 0.53 | - | 0.74 | BJ | 1.52 | 0.55 | BJ | 1.13 | 0.51 | J | 1.05 | 0.47 | J | 0.96 |
| 2 | J | 0.44 | 0.50 | - | 0.42 | J | 0.96 | 0.55 | BJ | 1.26 | 0.55 | BJ | 1.26 | 0.20 | J | 0.46 |
| 3 | J | 0.39 | 0.63 | - | 0.58 | J | 1.47 | 0.67 | BJ | 1.70 | 0.54 | J | 1.39 | 0.34 | J | 0.86 |
| 4 | J | 0.38 | 0.55 | - | 0.67 | BJ | 1.75 | 0.56 | BJ | 1.45 | 0.52 | J | 1.36 | 0.41 | J | 1.06 |
| 5 | BJ | 0.39 | 0.36 | 0.45 | 0.45 | BJ | 1.17 | 0.39 | BJ | 1.01 | 0.44 | BJ | 1.14 | 0.41 | BJ | 1.06 |
| 6 | BJ | 0.44 | 0.39 | 0.49 | 0.49 | BJ | 1.12 | 0.43 | BJ | 0.99 | 0.46 | BJ | 1.07 | 0.41 | BJ | 0.94 |
| 7 | BJ | 0.44 | 0.38 | 0.47 | 0.47 | BJ | 1.07 | 0.42 | BJ | 0.96 | 0.46 | BJ | 1.05 | 0.40 | BJ | 0.92 |
| 8 | BJ | 0.53 | 0.48 | 0.60 | 0.60 | BJ | 1.13 | 0.52 | BJ | 0.97 | 0.47 | J | 0.89 | 0.45 | J | 0.84 |
| 9 | BJ | 0.43 | 0.37 | 0.46 | 0.46 | BJ | 1.07 | 0.41 | BJ | 0.96 | 0.46 | BJ | 1.08 | 0.41 | BJ | 0.95 |
| 10 | BJ | 0.42 | 0.39 | 0.49 | 0.49 | BJ | 1.16 | 0.43 | BJ | 1.02 | 0.46 | BJ | 1.09 | 0.41 | BJ | 0.96 |
| 11 | J | 0.57 | 0.78 | - | 0.63 | J | 1.12 | 0.73 | J | 1.28 | 0.69 | J | 1.21 | 0.38 | J | 0.68 |
| 12 | BJ | 0.38 | 0.36 | 0.55 | 0.55 | BJ | 1.48 | 0.39 | BJ | 1.04 | 0.51 | BJ | 1.35 | 0.38 | BJ | 1.02 |
| 13 | J | 0.62 | 1.41 | - | 0.59 | J | 0.95 | 0.85 | J | 1.36 | 0.77 | J | 1.23 | 0.35 | J | 0.57 |
| 14 | J | 0.60 | 0.80 | - | 0.59 | J | 0.99 | 0.65 | BJ | 1.08 | 0.60 | J | 0.99 | 0.35 | J | 0.59 |
| 15 | J | 0.50 | 1.47 | - | 0.59 | J | 1.20 | 0.63 | J | 1.28 | 0.68 | J | 1.37 | 0.35 | J | 0.71 |
| 16 | J | 0.34 | 0.82 | - | 0.59 | J | 1.76 | 0.60 | BJ | 1.77 | 0.53 | J | 1.55 | 0.35 | J | 1.04 |
| ALL | mean | 1.24 | – | mean | 1.20 | – | mean | 1.19 | – | mean | 0.85 | |||||
| CoV | 0.21 | CoV | 0.22 | CoV | 0.15 | CoV | 0.23 | |||||||||
| J | mean | 1.30 | – | mean | 1.37 | – | mean | 1.27 | – | mean | 0.77 | |||||
| CoV | 0.25 | CoV | 0.17 | CoV | 0.14 | CoV | 0.29 | |||||||||
| BJ | mean | 1.17 | – | mean | 0.99 | – | mean | 1.10 | – | mean | 0.96 | |||||
| CoV | 0.12 | CoV | 0.03 | CoV | 0.13 | CoV | 0.07 | |||||||||
The proposed empirical model described above is finally applied to all the collected tests presented in the previous section thus evaluating its accuracy (Table 4). It can be noted that the mean predicted-to-experimental shear strength ratio is equal to 1.00 if all the tests are considered. Also, if only tests that exhibited a J-failure mode or a BJ-failure mode are considered separately, the mean relative error is very close to zero. As a matter of fact, a very slight underestimation is observed for BJ-mode tests (-3%) and a slight overestimation is obtained for tests with a J-failure mode (+2%). Coefficient of variation of such prediction results is quite limited (19%), especially for BJ-mode tests (7%), thus finally confirming a good accuracy of the proposed model.
| # |
Observed FM |
|
|
Pred FM |
Pred/ test |
|---|---|---|---|---|---|
| (MPa)0.5 | (MPa)0.5 | ||||
| 1 | J | 0.49 | 0.51 | J | 1.00 |
| 2 | J | 0.44 | 0.55 | J | 1.17 |
| 3 | J | 0.39 | 0.54 | J | 1.53 |
| 4 | J | 0.38 | 0.52 | J | 1.14 |
| 5 | BJ | 0.39 | 0.44 | BJ | 1.03 |
| 6 | BJ | 0.44 | 0.46 | BJ | 0.99 |
| 7 | BJ | 0.44 | 0.46 | BJ | 0.95 |
| 8 | BJ | 0.53 | 0.47 | J | 0.85 |
| 9 | BJ | 0.43 | 0.46 | BJ | 0.95 |
| 10 | BJ | 0.42 | 0.46 | BJ | 1.01 |
| 11 | J | 0.57 | 0.69 | J | 0.77 |
| 12 | BJ | 0.38 | 0.51 | BJ | 1.05 |
| 13 | J | 0.62 | 0.77 | J | 0.82 |
| 14 | J | 0.60 | 0.60 | J | 0.85 |
| 15 | J | 0.50 | 0.68 | J | 0.77 |
| 16 | J | 0.34 | 0.53 | J | 1.12 |
| ALL | mean | 1.00 | |||
| CoV | 0.19 | ||||
| J | mean | 1.02 | |||
| CoV | 0.25 | ||||
| BJ | mean | 0.97 | |||
| CoV | 0.07 | ||||
4. Stress-strain nonlinear behavior of the joint panel
Together with the joint shear strength assessment, a complete characterization of the nonlinear local response of the joint panel is certainly necessary to clearly understand the joint behavior under cyclic loading and to reliably model this element for structural analyses of non-conforming RC frames. Therefore, herein the shear behavior of the joint panel is empirically defined. In particular, the nonlinear shear stress (τj)-strain (γjoint) response of the joint panel has been characterized by means of four characteristic points, as proposed by previous studies (e.g [4, 5, 31]): cracking, pre-peak, peak and residual points (Fig. 4).
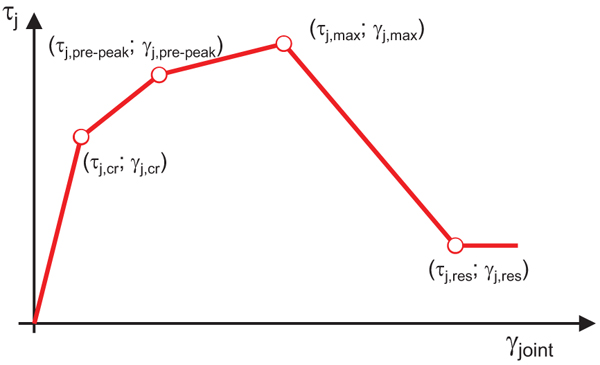
The (τj - γjoint) relationship for the joint panel is obtained through the experimentally measured joint shear stress-strain responses, by means of experimental tests conducted on the investigated joint typology that reported these data, namely by means of the (four) tests presented in [20] and the (two) tests by [19]. The experimental joint envelopes for these six tests have been first made symmetric (since specimens were all symmetrically reinforced) by averaging experimental shear stress and strain values between positive and negative loading directions at each drift level. Then, these responses were quadri-linearized, clearly identifying the four required characteristic points introduced before (Fig. 4).
About the ascending branch of behavior, cracking and peak points of this quadri-linearized response correspond to the first significant change in its slope and to the peak condition, respectively. Moreover, joint stress corresponding to joint cracking can be well predicted by the model proposed by Uzumeri [32], as highlighted in [19, 20]. The pre-peak point is selected to obtain the best-matching with the experimental envelopes for tests in which joint shear failure occurs without the yielding of longitudinal rebars (J-failure); whereas, the pre-peak joint stress can be assumed equal to the joint shear stress corresponding to beam yielding (τj,y) if joint shear failure occurs after the yielding of longitudinal rebars (BJ-failure).
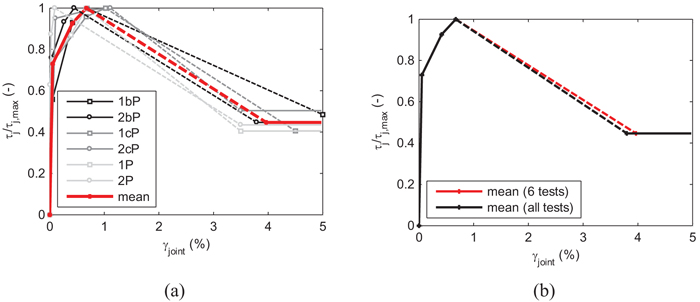
For each test, it is assumed that the softening branch starts from the peak-load point and goes on up to the joint shear value corresponding to the beam load at the last imposed drift level (residual strength). The corresponding (residual) joint shear strain should be defined. To this end, note that, generally, the experimental response of the joint panel was considered reliable only until the peak load is reached. Therefore, the slope of the softening branch or, equivalently, the joint shear strain corresponding to the end of the softening branch, should be empirically calibrated to reproduce the experimentally observed softening stiffness on the global response. The calibration phase of this key parameter can be extended also to other tests from literature belonging to the collected database and similar to the six tests adopted to calibrate the ascending branch, for which the Authors did not provide any experimental measures about joint shear strains, and with different anchorage details of beam bars, axial load level or buckling slenderness ratio of column rebars passing through the unreinforced joint region. On the whole, ten tests have been considered to investigate about the variability of the softening slope of the joint response due to such parameters, considering tests by Melo et al. [12] (TPA2, TPB2, TPC) and Genesio [33] (2D-pre1970s), together with tests presented in [19] and [20]. Basically, first, flexural deformability and fixed-end-rotation contribution are mechanically obtained (according to the monotonic bond strength model by [34]), for each test, as better clarified in Section 6, and then the softening slope of the joint spring is empirically calibrated in order to numerically reproduce the experimental global softening branch of the experimental response (similarly to [35]). This calibration procedure of the softening branch finally provides the softening stiffness shown in Fig. (5a), with dotted lines. In particular, in Fig. (5a), the six tests adopted to calibrate also the ascending branch of behavior of the joint shear behavior are reported, together with their mean curve (in red); whereas in Fig. (5b) such a mean curve is compared with the mean curve of the joint shear behaviour for which the softening slope is evaluated considering all the (ten) analysed tests. The curves reported in Fig. (5b) are exactly coincident until peak load is achieved (since the ascending branch is always calibrated on the basis of the tests shown in Fig. (5a), whereas, their softening branches are only slightly different. Anyway, the mean joint shear stress-strain relationship (in black in Fig. (5b)) is finally adopted in numerical simulations reported in Section 6.
Finally, the coordinates of the four obtained characteristic points of the joint panel response are reported in Table 5.
| Backbone Point | τj | γjoint |
|---|---|---|
| cracking | Model by Uzumeri [32] | 0.05% |
| pre-peak | 0.93·τj,max (if J-failure); τj,y (if BJ-failure) | 0.42% |
| peak | Eq. (6) | 0.67% |
| residual | 0.42·τj,max | 3.80% |
5. CYCLIC BEHAVIOUR
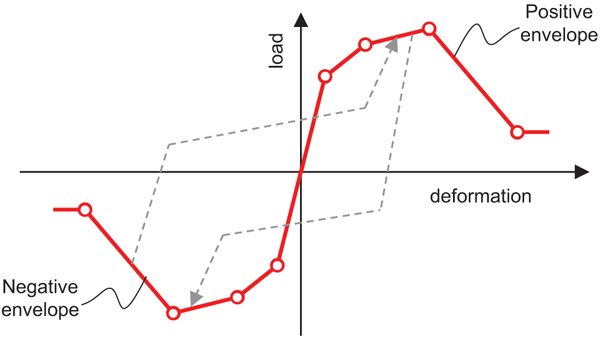
The same tests adopted for the calibration of the (ascending part of the) backbone described above are used to calibrate the cyclic behaviour of the joint shear stress-strain response. The calibration is performed in OpenSees software [36] on the basis of the hysteresis rules characterizing the Pinching4 uniaxial material (Fig. 6). The backbone of this material is defined by four points in negative and in positive directions. Pinching4 also allows modeling the cyclic degradation of unloading and reloading stiffness (through the parameters gk and gD, respectively), degradation in strength (through the parameters gF) and pinching effects (through the parameters rDisp, rForce and uForce).
The calibration-phase of these key parameters was performed starting from the experimental shear stress-strain backbones and minimizing the error in terms of dissipated energy between the numerical and the experimental responses. No degradation in strength was introduced (namely all gF parameters were set equal to zero) since it is already included in the backbone of the joint response obtained from experimental data. Fig. (7) shows the comparison between numerical and experimental cyclic responses in terms of joint shear stress-strain for two of the analysed tests. Finally, Table 6 reports the mean values of the calibrated parameters adopted to fit the experimental response of the analyzed non-ductile exterior beam-column joints.
| Test # | 1P | 2P | 1bP | 2bP | 1cP | 2cP | mean |
|---|---|---|---|---|---|---|---|
| rDispP | 0.2 | 0.2 | 0.30 | 0.30 | -0.30 | 0.30 | 0.23 |
| rDispN | 0.3 | 0.3 | 0.30 | 0.30 | 0.30 | 0.30 | |
| rForceP | 0.25 | 0.25 | 0.25 | 0.25 | 0.05 | 0.30 | 0.23 |
| rForceN | 0.25 | 0.25 | 0.25 | 0.25 | 0.25 | 0.20 | |
| uForceP | -0.2 | -0.2 | -0.20 | -0.20 | -0.30 | -0.20 | -0.21 |
| uForceN | -0.2 | -0.2 | -0.20 | -0.20 | -0.20 | -0.20 | |
| gK1 | 0.75 | 0.75 | 0.85 | 0.85 | 0.70 | 0.60 | 0.75 |
| gKlim | 0.96 | 0.96 | 0.96 | 0.96 | 0.96 | 0.96 | 0.96 |
| gD1 | 0.4 | 0.4 | 0.50 | 0.50 | 0.30 | 0.30 | 0.40 |
| gD3 | 0.3 | 0.25 | 0.50 | 0.50 | 0 | 0 | 0.25 |
| gDlim | 0.7 | 0.7 | 0.70 | 0.70 | 0.70 | 0.70 | 0.70 |
| gFi (i=1,..4) | 0 | 0 | 0 | 0 | 0 | 0 | 0 |
| gE | 100 | 100 | 100 | 100 | 100 | 100 | 100 |
| gK2 = gK3 = gK4 = 0; gD2 = gD4 = 0; dmgType=cycle | |||||||
6. VALIDATION OF THE PROPOSAL
Experimental tests belonging to the collected database have been reproduced through numerical simulations performed in OpenSees platform [36].
The flexural response of beams and columns is modelled in a fiber approach. Concrete and steel properties were obtained from the test programs for each test. In particular, Mander et al., model [27] was adopted for concrete, and an elastic-plastic-hardening stress-strain relationship [37] steel model was used for steel (Concrete04 and Reinforcing Steel uniaxial materials in OpenSees, respectively). The response of the beam-column joint is modeled through the adoption of two kinds of rotational springs see Fig. (8): the first one is located in the centreline of the joint panel and it represents its shear behaviour; the other ones are located at the interfaces between the joint and the adjacent beam/columns and represent the bond-slip contribution.
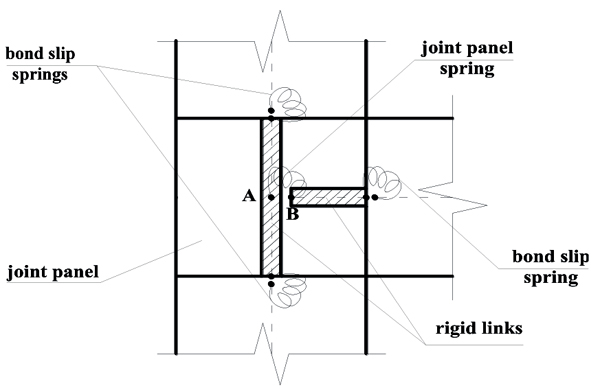
The joint panel zone model is the so-called “scissors” model [38], implemented by defining rigid offsets spreading within the joint region and two nodes (A and B in Fig. (8)) overlapped at the center of the joint panel, connected by means of a zero-length rotational spring that allows only relative rotations. The joint panel spring is implemented with a zero-length element defined by a four-point backbone moment-rotation relationship by the adoption of the Pinching4 uniaxial material in OpenSees. The deformability parameter “rotation” described by this spring coincides with the shear deformation of the joint panel zone (γjoint). Finally, from equilibrium equation, for each characteristic point of the backbone of the joint panel spring (defined in Section 4), the moment transferred through the rotational spring Mj can be calculated as a function of the joint shear stress τj, as shown in Eq. (7):
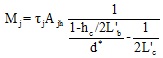 |
(7) |
where L′b and L′c are the beam and column length, respectively.
The deformability contribution due to the slippage of beam/columns longitudinal rebars anchored into the joint core (fixed-end-rotation) is reproduced through another zero-length element introduced at the beam/columns-joint interfaces. The related M-Ɵslip relationship is calculated in a mechanical approach by using analytical bond-slip models from literature. The procedure described above requires the selection of a proper bond strength model for plain bars and the definition of the (τs,h - sliph) relationship related to the end-hook. Unfortunately, a very limited number of studies is available in the literature on bond–slip mechanisms in structural elements with plain bars with respect to deformed bars. Certainly, very low values for the bond strength (τb,max) are proposed in literature and codes due to the bad quality of the concrete-steel interaction. As a matter of fact, τb,max=0.15√fc or τb,max=0.30√fc are suggested by CEB-Fib [39] in “poor” and “good” bond conditions, respectively.
Herein, the fixed-end-rotation contribution is reproduced as in De Risi et al. [40]. More in details, in order to calculate the M-Ɵs relationship, the cyclic moment-curvature relationship (M-ϕ) is calculated first, under a given imposed cyclic path of curvatures. Then, for each value of ϕ, the slip (s) at the loaded end of the anchored bars is evaluated at the top and bottom layers as a function of the corresponding strain (ε) in the reinforcement. To this end, the finite difference method is applied, discretizing the straight portion (ld) of the anchored bar in a number of sub-portions of equal length; then, the problem is solved using equilibrium and compatibility equations at each section of the discretized bar, employing the stress-strain constitutive relationship of the reinforcement steel and the bond strength-slip cyclic relationship proposed by [34]. The hook deformability contribution is taken into account by means of the τs,h-sh relationship by [41]. Then, the rotation Ɵs corresponding to the calculated slip in the top and bottom reinforcement layers is evaluated as the difference between the two slip values (sin-sout) divided by the distance between the reinforcement layers.
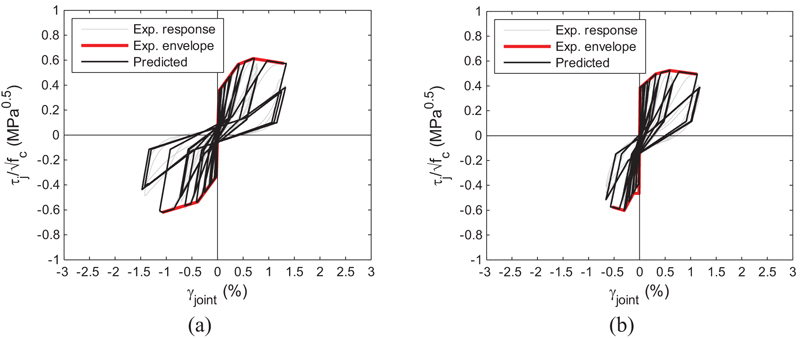
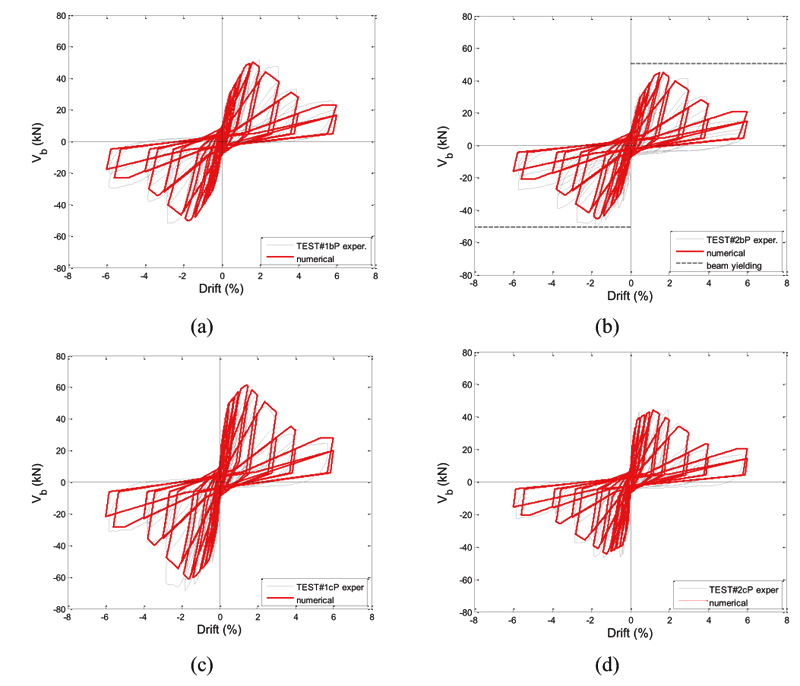
The comparison between experimental responses and numerical simulations based on the assumptions explained above is finally shown in Fig. (9) for some of the analyzed tests belonging to the collected database. Note that, in Fig. (9), the numerical joint shear strength has been scaled up to the experimental strength (the mean value between positive and negative loading directions), in order to deprive the comparison from the evaluation of predictive capacity of the strength model (issue already analysed in Section 3), and to focus the attention on deformation predictive capacity and hysteretic behaviour. From these comparisons, it can be observed that:
- - elastic stiffness is well reproduced;
- global deformability is only slightly underestimated at peak load;
- the numerical responses well reproduce also softening stiffness and residual strength, thanks to the calibration of such parameters (graphically reported in Fig. (2b).
- numerical hysteretic responses well predict unloading and reloading stiffness degradation and pinching effect for all the investigated tests.
CONCLUSION
In this work, an empirical macro-modeling approach was proposed for these elements, suitable for extensive nonlinear analyses.
First, a specific homogeneous database of (sixteen) experimental tests about exterior unreinforced joints with hook-ended plain bars in beam and columns was collected and analysed. Based on this dataset, the prediction capacity of the main existing joint strength models from literature was evaluated, thus concluding that: (i) main shear strength models proposed in literature for unreinforced beam-column joints with deformed bars overestimate, on average, the experimental joint shear strength; (ii) the lonely strength model proposed for unreinforced joints with hook-ended plain bars underestimates the experimental results and fails in considering the role of joint aspect ratio and beam longitudinal reinforcement ratio on joint shear strength.
Therefore, a new simple shear model, empirically-based, was proposed herein and validated by means of the experimental data. It was noted that the mean predicted-to-experimental shear strength ratio is equal to 1.00 if all the tests are considered with a quite limited coefficient of variation (19%), thus finally confirming a good accuracy of the proposed model. Together with the joint shear strength assessment, a complete characterization of the nonlinear local response of the joint panel was calibrated on the basis of tests which experimentally measured and provided the joint shear strain evolution. Therefore, the joint panel constitutive parameters were defined to reproduce the experimental joint shear stress-strain behavior, also considering its hysteretic behavior and reproducing it by means of the Pinching4 uniaxial material in OpenSees platform.
The whole proposal was finally validated by means of numerical-versus-experimental comparisons, proving that: (i) elastic stiffness and global deformability are well reproduced; (ii) the numerical responses also reproduce softening stiffness and residual strength; (iii) numerical hysteretic responses well predict unloading and reloading stiffness degradation and pinching effect for all the investigated tests.
CONSENT FOR PUBLICATION
We obtained the written informed consent from each subject or subject's parent.
CONFLICT OF INTEREST
The authors declare no conflict of interest, financial or otherwise.
ACKNOWLEDGEMENTS
This work was developed under the financial support of METROPOLIS (“Metodologie e tecnologie integrate e sostenibili per l'adattamento e la sicurezza di sistemi urbani” - PON 'Ricerca e Competitività 2007 - 2013) and “ReLUIS-DPC 2014-2018 PR 2- Linea Strutture in cemento armato”, funded by the Italian Department of Civil Protection (DPC). These supports are gratefully acknowledged.

