All published articles of this journal are available on ScienceDirect.
Experimental Comparison Between Three Types of Opaque Ventilated Facades
Abstract
Background:
The growing interest for the energy efficiency of building technologies has led the construction sector towards the adoption of Opaque Ventilated Facades (OVFs) as high-performance solutions for building systems.
Objective:
The aim of this study is to determine the optimal thermal inertia of the outer surface of ventilated facades with respect to the indoor comfort and the reduction of the outdoor overheating.
Method:
An experimental study was carried out in Central Italy (Mediterranean climate), by comparing the thermo-physical performance of three opaque ventilated façades, characterized by different positions of the mass (hollow bricks) within the air cavity. One has no mass and is enclosed by a Lightweight (L) cladding; one has an Internal Mass (IM) right adjacent to the insulation layer and an external lightweight cladding; the last one has an External Massive cladding (EM). The three prototypes (L, IM and EM walls), were installed on a test room and simultaneously monitored in the summer season.
Result:
The experimental outcomes demonstrate that the EM wall outperforms the others in terms of cooling efficiency, as the incoming heat fluxes towards the indoors are considerably reduced. Moreover, such a configuration led to the lowest surface temperatures on the outer slab, thus contributing to the mitigation of the external environmental overheating.
Conclusion:
Overall the External Mass (EM) solution was found to be the best choice, being beneficial for mitigating the outdoor surrounding temperatures and enhancing the buoyancy-driven ventilation.
1. INTRODUCTION
Recently, the raising environmental awareness has led to a new approach towards the design of the building envelope: it is no more a mere static component that separates the internal environment from the external one, but also a dynamic filter interacting with indoor and outdoor climatic factors. With new building skin materials appearing on the market, such as fiber cement panels, high pressurized laminates and metallic claddings, the Opaque Ventilated Facades (OVFs) have been widely adopted both in new constructions and in refurbishment projects. Indeed, they enhance the thermal resistance while offering a broad spectrum of architectural expressions.
Their characteristic is the presence of an external cladding anchored to the wall surface of the building through a metal frame, detached from the insulation layer, thus creating a ventilated air gap [1, 2]. This multi-layer constructive technology achieves high energy performance with respect to conventional facades [3, 4]. The air gap activates an airflow between the lower inlet and the upper exhaust openings driven by the buoyancy effect and the wind force [5]. However, even if all the ventilated facades work upon this physic principle, their behavior under the same boundary conditions could greatly differ for the unequal thermo-physical features of the materials adjacent to the air chamber.
In the past years, many researches have focused their attention on the key factors that influence the energy saving outcome of OVFs, by investigating the air cavity thermal behavior [6]. Overall, their effectiveness depends on the location and the weather variables, namely the solar radiation hitting the external coating [7], the outdoor air temperature [8] and the wind velocity and direction [9]. It was established that among the outdoor boundary conditions, the solar radiation on the façade was the most influential variable on the ventilation efficacy [10]. Moreover, ventilated walls in the same locations could have very different behavior depending on the façade constructive features such as type of external cladding with either open [11] or closed joints [12], internal/external layer materials [13] and air gap thickness [14].
Most of the above mentioned researches regard numerical simulations with the aim of tuning mathematical models [9, 10, 13]. Nonetheless, many authors have highlighted that the study of ventilated facades is complex and difficult to tackle, remarking the need to rely on extensive experimental databases. Various authors faced the experimentation of ventilated facades considering either a prototype or a real case study. Investigated OVFs are considerably different, having alternatively massive [15, 16] or lightweight [17] outer claddings.
No study has addressed the experimental comparison between walls in the same geographical location and geometries but characterized by different position of the mass within the air gap, either external (massive cladding) or internal (adjacent to the insulation layer). Accordingly, the aim of the present research was to understand how different layering affects the thermal performance of the ventilated facades. The study focused on the simultaneous monitoring of three prototypes of OVFs under the same boundary conditions (Central Italy) and characterized by the same materials but different massive layers position. All configurations shared the same thermal transmittance U and optical features of the external finishing layer (analogous absorbance α and emission ε).
2. STAGES AND METHODS
2.1. Phases
The experimental study was carried out on a test cell, and encompassed the following activities:
- design and construction of three west-facing OVFs prototypes, one with External Mass (EM), one with Internal Mass (IM) and one lightweight ventilated façade without mass (L);
- simultaneous summer in-field monitoring of the walls;
- data collection and processing in order to evaluate the thermal behavior of the ventilated walls.
2.2. Case Study
The test room, located in Ancona, central Italy (latitude: 43° 62’ N; longitude: 13°37’ E; altitude 12 m) is a single room, compact environment, as shown in Fig. (1).
The load bearing structure is Cross-Laminated Timber (CLT), with a 10-cm-thick superinsulation layer on the outside and a 5-cm-thick insulation layer on the inside. The internal finishing is a plasterboard panel. Three opaque ventilated façades (OVFs) were installed on the West-facing wall:
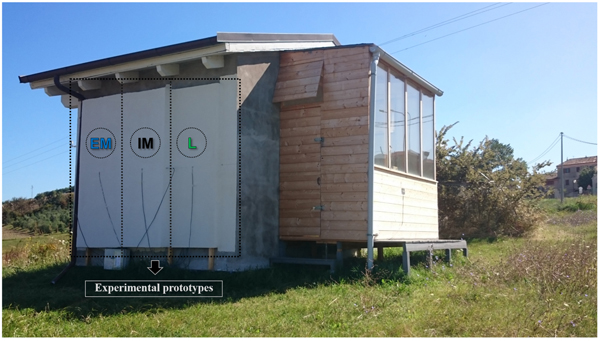
- OVF with no mass (L). It represents the lightweight typology; the air gap is enclosed by a white plastered OSB panel (total thickness of 37 cm);
- OVF with Internal Mass (IM). The massive layer is adjacent to the insulation material; the external gap is enclosed by a white plastered OSB panel (total thickness of 49 cm);
- OVF with External Mass (EM). It features an outer mass with external white plaster (total thickness of 48 cm).
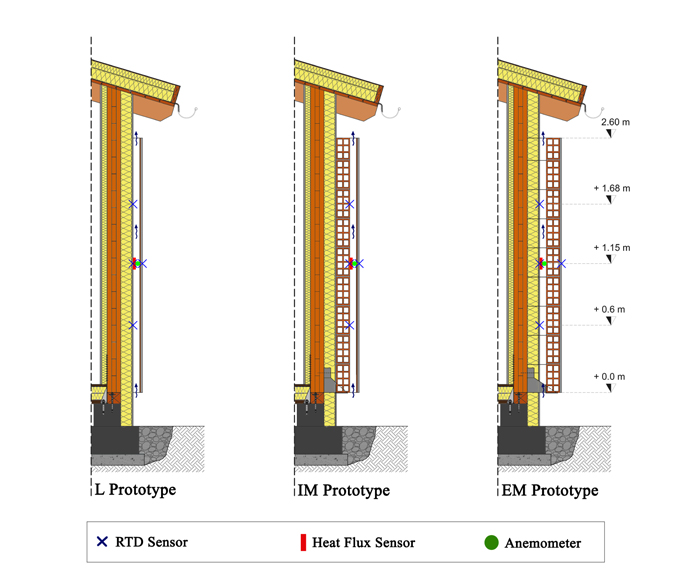
Section drawings of the walls are shown in Fig. (2). The three OVFs design features are listed in Table 1 while the thermo-physical properties of the materials adopted are included in Table 2.
| OVF With No Mass | OVF With Internal Mass | OVF With External Mass | |||
|---|---|---|---|---|---|
| Layer | (cm) | Layer | (cm) | Layer | (cm) |
| Internal Plasterboard | 1.25 | Internal Plasterboard | 1.25 | Internal Plasterboard | 1.25 |
| Vapour Barrier | - | Vapour Barrier | - | Vapour Barrier | - |
| Internal Insulation | 5 | Internal Insulation | 5 | Internal Insulation | 5 |
| CLT | 12 | CLT | 12 | CLT | 12 |
| External Insulation | 10 | External Insulation | 10 | External Insulation | 10 |
| Shaving | 1.5 | Shaving | 1.5 | Shaving | 1.5 |
| Air Cavity | 6 | Hollow Bricks | 12 | Air Cavity | 6 |
| OSB Panel | 0.9 | Air Cavity | 6 | Hollow Bricks | 12 |
| External Plaster | 1.2 | OSB Panel | 0.9 | External Plaster | 1.2 |
| - | - | External Plaster | 1.2 | - | - |
| Materials | Thermal Conductivity (W/(mK)) | Specific Heat Capacity (J/(kgK)) | Density (kg/m3) |
|---|---|---|---|
| Internal Plasterboard | 0.2 | 837 | 760 |
| Vapour Barrier | 0.17 | 1500 | 425 |
| Internal Insulation | 0.035 | 1030 | 70 |
| CLT | 1.4 | 2700 | 500 |
| External Insulation | 0.036 | 1030 | 90 |
| Shaving | 0.48 | 1000 | 1150 |
| Hollow Bricks | 0.292 | 1000 | 920 |
| External Plaster | 0.33 | 1110 | 1150 |
| OSB Panel | 0.1 | 1700 | 600 |
Each wall has a rectangular shape of 1.00 m x 2.30 m. The air cavity is 0.06 m wide. The lower inlet and upper outlet are completely open and protected by a steel honey-combed mesh.
Steady-state and dynamic thermal parameters for ventilated facades were calculated according to EN ISO 6946:2008 and EN ISO 13786:2008 considering still air in the ventilation chamber. The thermal parameters of the envelopes are reported in Table 3. Even though the three walls have approximately the same thermal transmittance U, they present increasing levels of external areal heat capacity k2. The Lightweight solution (L) has the lowest k2 value at 28 kJ/(m2K), while the one with the External Mass (EM) reaches the highest one (60 kJ/(m2K)). The wall with the Inner Mass (IM) represents the intermediate solution.
| Thermal Properties | Wall Typology | ||
|---|---|---|---|
| L | IM | EM | |
| Thermal Trasmittance U* (W/(m2K)) | 0.207 (0.22)* | 0.19 (0.20) | 0.19 (0.22) |
| Decrement Factor f | 0.07 (0.08) | 0.02 (0.04) | 0.03 (0.08) |
| Time Lag Δt (h) | 9.7 (8.4) | 15.8 (13.9) | 14.9 (8.4) |
| Periodic Thermal Trasmittance Y12 (W/(m2K)) | 0.014 (0.017) | 0.003 (0.07) | 0.006 (0.017) |
| External Areal Heat Capacity k2(kJ/(m2K)) | 28 (16) | 40 (60) | 60 (16) |
| *thermal parameters between brackets are calculated according to EN ISO 6946:2008 and EN ISO 13786:2008 for well ventilated facades | |||
Moreover, the thermal parameters were obtained considering a well-ventilated air chamber, according to the same standards. The calculation was done by disregarding the thermal resistance of the air layer and all other layers between the air layer and external environment, and including an external surface, resistance corresponding to still air. The values are reported in Table 3 within round brackets. In this case, L and EM typologies have the very same thermal characteristics. The three walls show similar steady-state values, having thermal transmittance U values (around 0.20-0.22 W/(m2K)) whereas the dynamic thermal parameters greatly differ for the presence/position of the massive layer. Again, this difference is clearly visible in the external areal heat capacity k2 value that is around 60 kJ/(m2K) when the mass is on the inner side of the gap (IM) and goes down to near 16 when the mass is outside of the gap (EM).
The mass was realized with hollow bricks (12 cm thick). The massive layers were supported by individual brackets provided with an L-shaped plate. The brackets were anchored to the CLT panel and equipped with a thermal cutting plate to minimize the thermal bridges. To ensure the wall stability, steel anchors were adopted at different heights. The three prototypes were vertically separated from each other with a sealed insulation layer.
2.3. Experimental Methods
The monitoring campaign was carried out during the summer months. A set of sensors (Fig. 2) were installed on the ventilated facades in accordance with UNI EN ISO 7726:2002. Equipment details are listed below:
- external weather station for the acquisition of the external boundary conditions (temperature, relative humidity, global radiation, speed and direction of the wind);
- RTD sensors measuring the surface temperatures of the different layers at various heights (60 cm, 115 cm and 168 cm) and heat flux sensors registering the incoming and outgoing heat fluxes;
- hot-sphere thermo-anemometers, placed at 115 cm (channel mid-height), recording the air velocity and the air temperature inside the air cavity.
Thermo-resistances sensors provide an accuracy of ± 0,05 °C, heat flux sensors provide an accuracy within ± 3% and hot-sphere anemometers have a tolerance of ± 0,03 m/s.
All probes were connected to National Instruments data acquisition systems and real-time data were processed through LabVIEW software. The acquisition was set at 5 minutes rate.
3. RESULTS AND DISCUSSION
3.1. Climate Conditions
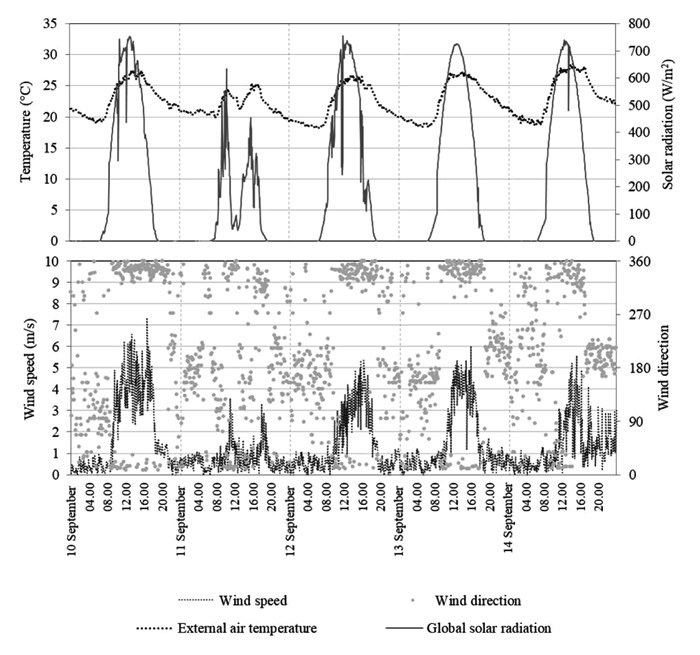
This section presents the outdoor environmental conditions of 5 continuous days extrapolated from the yearly monitoring (September, from 10th to 14th). The external air temperature and the global radiation are reported in Fig. (3a) while the wind speed and direction are shown in Fig. (3b). The period is characterised by sunny days and only one cloudy day (September 11) and the global radiation is around 750 W/m2. The external air temperature varies between 18 °C and 27 °C. The wind reaches values between 4 and 7 m/s in the central hours of the days, whereas it is absent overnight.
3.2. Effectiveness on the Mitigation of Potential Outdoor Overheating
The outer surface temperatures measured at mid-height for the three walls and the external air temperature are plotted in Fig. (4). All OVFs surface temperatures were significantly higher than the outdoor air temperature (dashed line) during the central hours of the day (12.00 a.m. - 04.00 p.m.) and slightly lower during the night (08.00 p.m. - 08.00 a.m.). On typical warm and sunny days (solar radiation around 700 W/m2), the external surface temperatures rose over 34°C. The two facades characterized by the same external layer, namely IM and L walls, with white outer shaved OSB panel, exhibited the same external surface temperature trend.
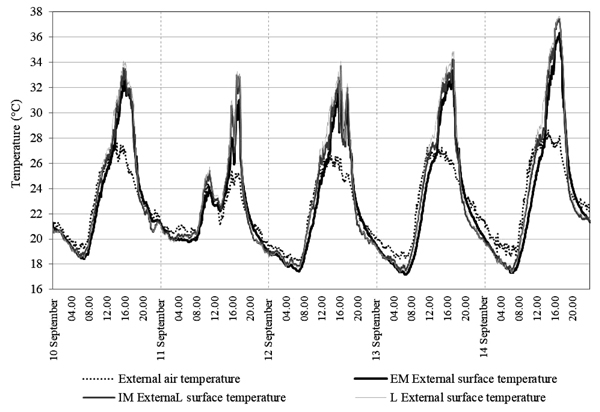
The façade with the EM cladding reached the lowest temperatures (approximately 2 °C lower than the other two) in the day hours. Surface temperatures directly impact the microclimate of the surroundings, especially during the summer months. Hence, EM façade, with its lower external surface temperature, could contribute to mitigating the overheating, especially where Urban Heat Island phenomena occur.
3.2. Mass Position Effect on Ventilation Efficacy
This section compares the temperature and the air velocity in the ventilation channels in the facades, measured at a mid-height position. From September 5th to 14th, the hot-sphere anemometers were installed in the massive walls (EM and IM) to verify the effect of different external mass positions on airflow rates. Fig. (5) reports the results extrapolated for 5 days.
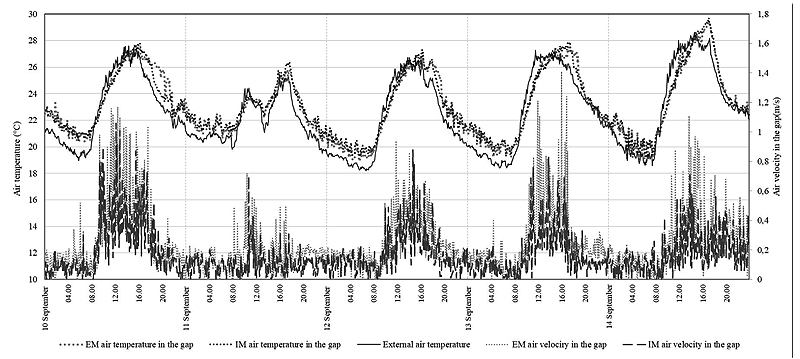
For both wall configurations, the air velocity in the ventilation channel peaks in the middle of the day (from 12:00 a.m. to 06:00 p.m.) when the external temperature is higher (even if slightly) than the temperature in the cavity at middle height. This reveals that in such period the ventilation flow could be inverted, from the upper outlet to the bottom inlet. The airflow is instead reduced for both walls when the external air temperature is lower than the one measured within the air gap. Despite similar temperature trends, the air flow rates in the air chambers are very different. Notably, in sunny days, (all the days except September 11) the EM typology triggered a significant daily chimney effect, as demonstrated by the higher air mean velocity reached inside its air chamber (0.25 m/s against 0.17 m/s of the IM solution).
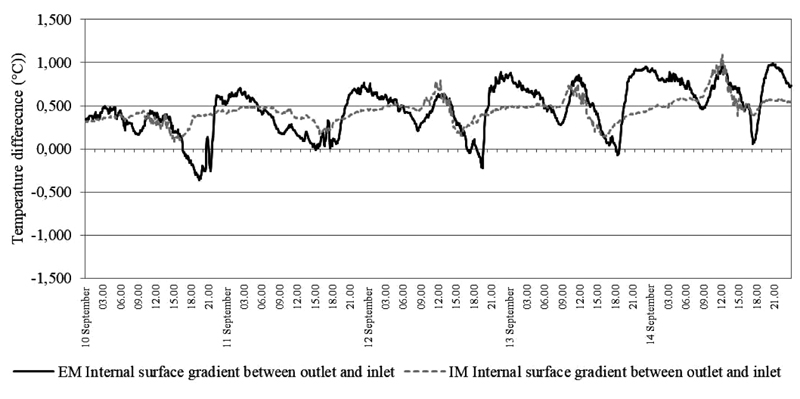
The inverse direction of the airflow in the central hours is also confirmed for wall EM by the graph in Fig. (6), that reports the thermal gradient between the outlet (h=168 cm) and inlet (h=60 cm) openings of the air cavity. The gradient is decreasing for both walls in the central hours, becoming negative at around 03:00 – 06:00 p.m. This demonstrates that the temperature values in the upper part of the wall are lower than the ones at its bottom with an inverted buoyancy driven flow for about three hours.
The graph in Fig. (7) reports the data of the day with the highest solar radiation (September 10th, maximum solar radiation of 735 W/m2) by plotting also the external surface temperatures (relevant probes positioned at the same height of the anemometers) for the two walls. It is clearly visible that the external surface temperature trends influence the shape of the air temperatures curves within the gap.
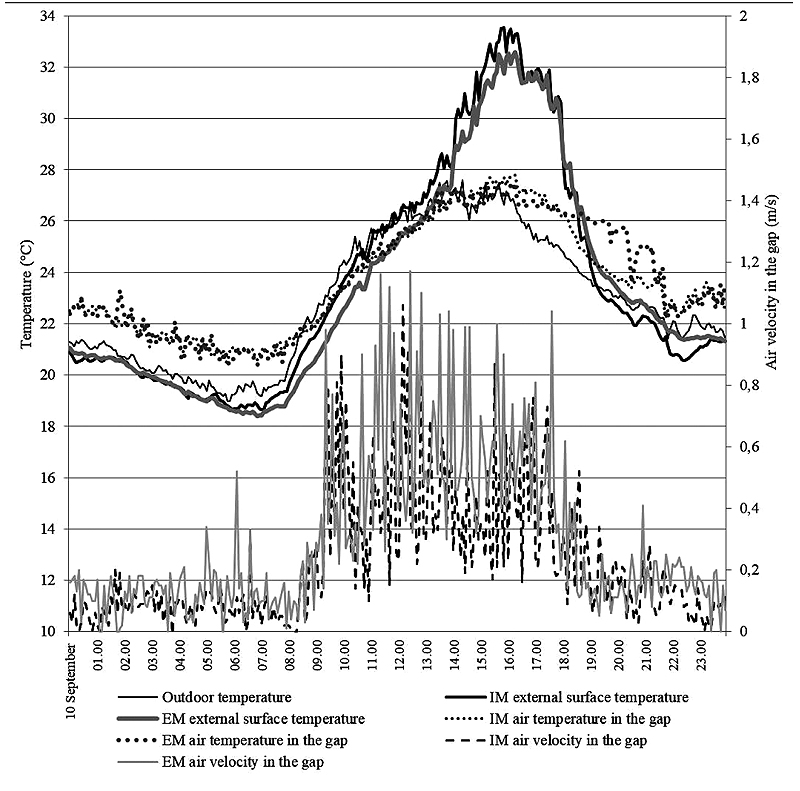
In details, the air temperatures in the ventilation chamber track their respective external surface temperatures, just with a smoother profile. In particular, for case EM, (mass positioned outside), the air temperature trend inside the ventilated cavity has a less pronounced bell-shaped (and thus more flattened) curve, typical of massive materials. By contrast, for case IM (mass placed within the air gap, adjacent to the external insulation), the air temperature ascending and descending slope is emphasized.
In the central hours, IM has higher external and gap temperatures than EM but a lower airflow. This depends on the different inertial effects of the respective façade. Indeed, the internal mass (IM configuration) stores the heat inside the ventilation channel thus flattening the thermal gradient at different heights (Fig. 6). The external mass (EM configuration) is instead able to dissipate the heat outside. This generates a diversity in the walls boundary conditions for the internal blowing airflow. The air in the gap is subjected to a major thermal gradient that triggers the updraft. It can be noted that around 03:00 p.m. the air flow velocity of EM wall diminishes and suddenly increases till 06:00 p.m. This can be related to the inversion of flow direction occurring at about 03:00 p.m., as previously highlighted.
After the sunset (06:00 p.m.), the IM and EM external temperatures invert their reciprocal position so that EM’s outer surface stays warmer than IM’s one. This is because the external massive cladding (EM) retains more heat than the plastered OSB of IM. The thermal gradient within the gap of EM strongly increases as previously shown in Fig. (6) and therefore the air velocity substantially rises up. So, the thermal difference among the air in the gap (EM wall) and external temperature greatly increases thus activating an effective airflow. As a consequence, from approximately 06:00 to 11:00 p.m. EM’s internal air circulation is accentuated compared to IM’s one.
3.5. Mass Presence Effect on Ventilation Efficacy
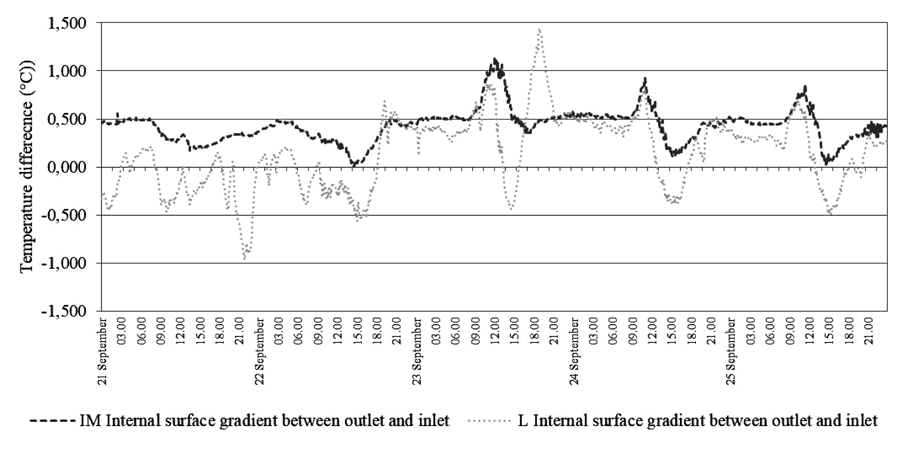
From September 21th to 25th, the hot-sphere anemometers were installed in the wall with an internal massive layer (IM) and in the lightweight wall without mass (L). The comparison between IM and L allows to observe whether the removal of the massive layer within the gap influences the airflow (Fig. 8).
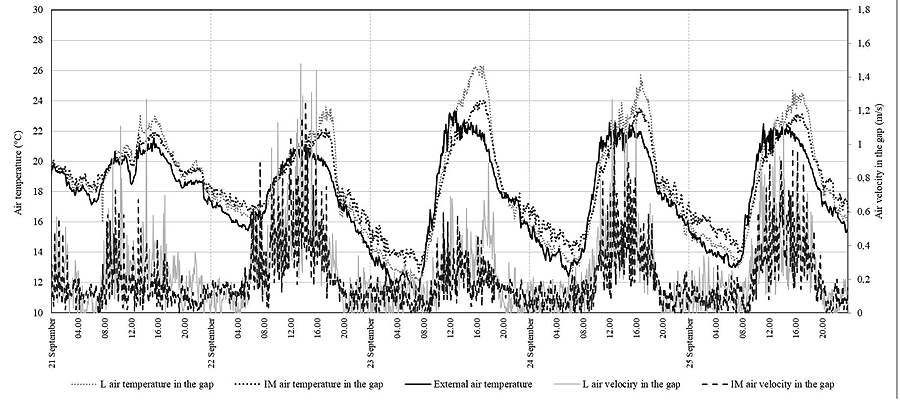
The external air temperature is higher than the values recorded in both gaps in the morning and lower in the rest of the day with possible phenomena of inverse circulation, as previously highlighted. The two prototypes temperature fluctuations clearly differ. The L wall reaches the highest temperature within the gap at peak hours but the values drop overnight. The IM wall exhibits milder daily peaks thanks to the presence of the storing mass, whose retained heat is released later at night towards the cavity, thus resulting in higher air temperature values than the L solution.
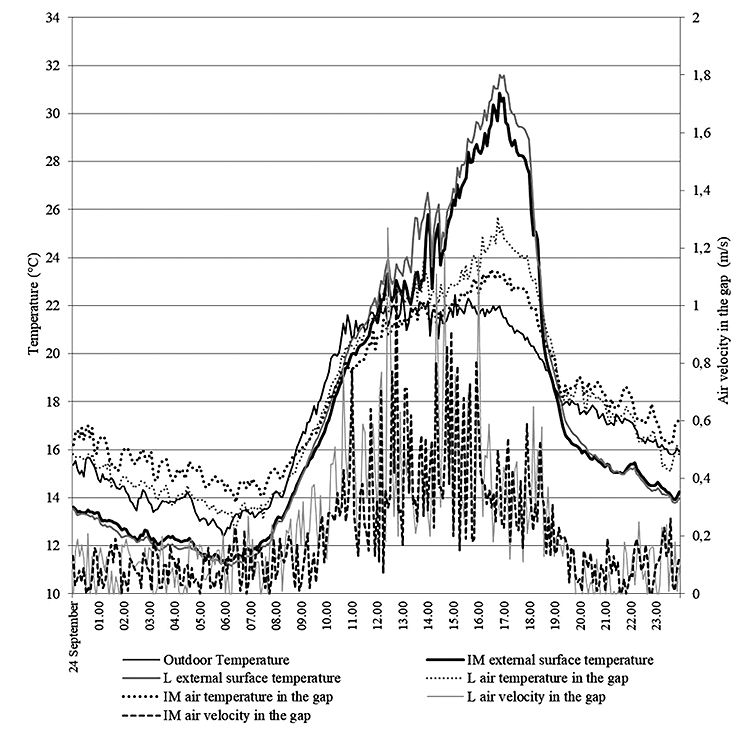
With reference to the air-speeds in the ventilation chamber, it can be noted that L wall measures the highest mean airflow rate, (approximately 0.23 m/s) than the one recorded by the IM one, (namely 0.20 m/s). However, for the L typology, as it can be seen in Fig. (9), the thermal gradient between the internal surface temperatures of the upper and lower openings has a less uniform behavior than the IM one, reaching negative values between 12:00a.m.-03:00 p.m. with a reversed ventilation.
This is more evident in Fig. (10), which focuses on the ventilation channel behaviour (airflow rates and air temperature within the gap) and external surface temperatures, plotting the data measured for a single day (September 24th, maximum solar radiation of 850 W/m2). The differences between the massive and lightweight configuration are evident, with higher airflow values for the lightweight wall. The latter, in central hours, maximizes the difference with external temperature, with consequent more effective airflow.
3.3. Thermal Fluxes Analysis
Fig. (11) reports the temperatures in the gap for the three walls. They are measured in all the cavities on the surface of the internal layer at mid-channel height (h=115 cm). Lightweight wall (L) registers the highest and lowest temperature values in the ventilation channel respectively during the day and night with the greatest thermal range. IM and EM walls have a very similar trend since the values are influenced by air gap temperatures, mitigated by the presence of the same massive bricks, even though in a different position. On days characterized by high solar radiation (approximately between 700 and 800 W/m2) their internal surface temperatures peak at around 26 °C during the hottest hours while they cool down to 20 °C during the night. The EM wall reaches lower minimum peaks at night-time since the mass is placed adjacent to the outdoors, thus it dissipates more effectively the stored heat.
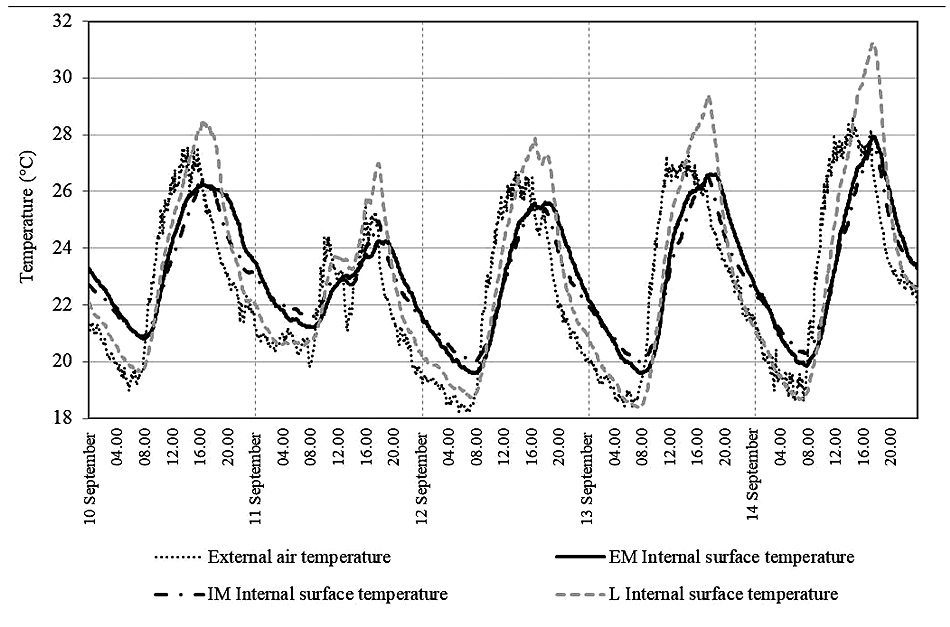
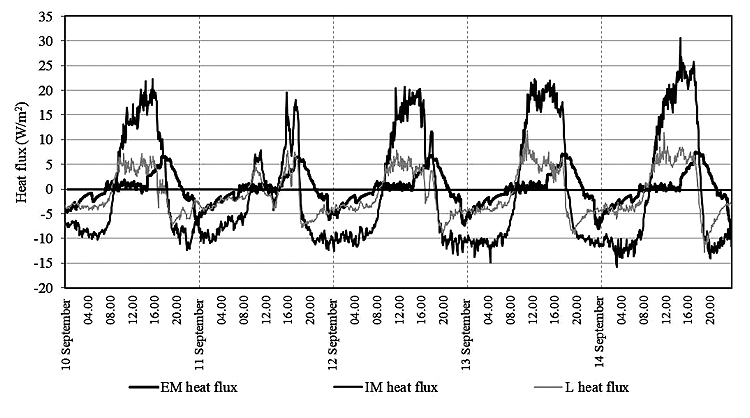
This different behavior of the masses according to their position, is clearly visible in Fig. (12) where the monitored thermal fluxes of the OVFs are presented. The heat sensors are positioned at mid-height of the air gap on the surface of the innermost layer for the three walls (as for the internal surface temperatures). The heat fluxes are assumed as positive with the inward direction (during the day), while they are considered negative towards the outdoor environment (at night).
During the central hours of the day (11 am - 4 pm), the walls with the External Mass (EM) and the lightweight one (L) are characterised by reduced thermal fluxes with respect to the IM one. This is related to the fact that, only for the IM wall, the heat flux sensor is positioned directly on the hollow bricks. Hence, it measures the storing action. In detail, in the day hours, the heat fluxes of the L wall have always an incoming direction whereas EM’s are close to zero in the morning and increase during the afternoon (about 01:00 -02:00 p.m.).
The EM peculiar heat flux trend could be justified by the fact that the external mass acts as a thermal buffer between the outdoor and the air chamber boundary conditions. Hence, it needs more time before an appreciable thermal gradient occurs on the edge of the air gap and triggers the heat flow.
At night, the heat fluxes are inverted for all the walls and always negative, with a sudden reduction for L wall (with the same slope of IM) and a gradual one for EM wall for the slow release of the heat. As expected, the presence of a massive cladding determines a more conservative behavior of the wall that is less influenced by the external environment variations.
In summary, the EM wall provides attenuated temperatures within the air cavity and reduced heat fluxes towards the indoor.
CONCLUSION
The present research investigates three Opaque Ventilated Walls (OVFs) with different external claddings by varying the position of the mass inside the wall and using as reference the lightweight solution without massive components. The aim is to outline the configuration that behaves better for both indoor configuration and outdoor temperature mitigation in the summertime.
A series of monitoring activities were carried out on a test cell (Central Italy) to record the weather variables, the facades surface temperatures and the air velocities and temperatures in the gaps.
The experimental outcomes reveal that the wall with the massive External Cladding (EM) is the best option with respect to the other configurations. Indeed, it guarantees the lowest external surface temperature thus limiting the implications in terms of local outdoor overheating. Moreover, it has the lowest air gap temperatures during the day thus activating an effective airflow and showing reduced incoming heat fluxes. Instead, during the night, both external surface and air gap temperatures are the lowest since the mass positioned outward could benefit from the nighttime cooling effect of the external environment. Our future studies will address the evaluation of the performance of the walls under a forced airflow with increasing air velocities.
CONSENT FOR PUBLICATION
Not applicable.
CONFLICT OF INTEREST
The authors confirm that this article content has no conflict of interest.
ACKNOWLEDGEMENTS
The authors want to express their gratitude for the brickwork support systems provided by HALFEN Company and to Stil Casa Costruzioni, and in particular to Eng. Andi Celaj, for the construction of the ventilated prototypes. The authors, also, are very grateful to CENTROLEGNO, and in particular to its administrator Roberto del Bianco, for having provided the test room in CLT.


