All published articles of this journal are available on ScienceDirect.

Project Delivery Systems and Project Performance: A Causal Relationship Analysis of Indonesian Stakeholders
Abstract
Background
The Indonesian construction industry is a key factor that drives economic growth, but it is plagued by unresolved project delivery issues that can yield lower levels of project performance. Project delivery systems (PDSs) have faced traditional barriers to successful projects. This study aimed to demonstrate how each stakeholder manages and participates in the activities of PDSs and how different factors affect project performance. It further explored the multifaceted association between individual aspects of PDSs and overall project performance.
Materials and Methods
A comprehensive literature review identified nine aspects of PDS and nine project performance indicators. A questionnaire was used to gather data clarifying the relationship between PDSs attributes and project performance, as analyzed through multivariate regression according to stakeholder input.
Results
The results showed that the dependence on the design-bid-build (DBB) model of PDSs in Indonesia is quite high. It was found that PDSs should provide justification for their choice of cooperation contract model, particularly regarding compensation and rewards, as these factors significantly affect cost performance (β 0.850, p-value 0.0312*) based on the owner's point of view.
Discussion
The unexplored pre-construction phase might reduce numerous risks in Indonesia‘s construction. It was found that Indonesia's construction industry lacks IPDS contractual norms and that DBB PDS operates poorly.
Conclusion
The findings require further investigation, which is essential for stakeholders and Indonesian regulators, highlighting the need for optimal PDS management to improve building construction performance in the Indonesian context. They also aid in refining contracts and clarifying the scope of construction projects.
1. INTRODUCTION
The Indonesian economy has long relied on construction. According to Statistics Indonesia, GDP increased by 2.01% in 2022, 4.9% in 2023, and 7.49% in 2024 after the pandemic [1]. Despite this growth, Indonesia's construction sector has inefficiencies in project execution, notably in building construction. Information system flaws and external effects, including political, economic, social, and technological settings, contribute to low performance [2].
Insufficient management capacity, traditional relationship models, procurement regulations, and barriers to project completion impede the international competitiveness of local construction companies [3]. The prevalence of “waste,” which encompasses design changes, slow decision-making, inadequate trading skills, improper construction methods, poor stakeholder coordination, delays in material delivery, and ineffective planning and scheduling, exacerbates Indonesia's subpar construction performance [4].
The construction industry's delayed adoption of new technology and conventional concepts has also affected its performance in the past decade [5]. Industry reform and progress require stakeholders to adapt [6]. This issue is largely caused by the continued use of traditional project delivery systems (PDSs). Low performance in the Indonesian construction industry is symptomatic of structural issues, including managerial restrictions, obsolete relationship models, regulatory restraints, and project completion barriers. Addressing these important issues is essential for industry efficiency and global competitiveness.
It has been observed that stakeholder involvement is closely linked to project performance. The assignee/owner (O), designer/engineer (D/E), quantity surveyor/quantity estimator (QS/QE), construction management (CM), and contractor (C) are key stakeholders, and contractual and geographical conditions affect them. A detailed study of scholarly sources supports this conclusion. Based on the literature study [7, 8], it was found that the most common construction restrictions were Technical, socio-economic, administrative, financial, and legal. Analyzing the frequency of project performance restrictions by stakeholders has been done simultaneously. Several factors, including subcontractors, owners, construction management, consultants (procurement; QS/QE), designers-engineers, operations (Ops), and social, political, and economic obstacles beyond the control of stakeholders, have been recognized. Relationships among construction project participants often fail to account for change and uncertainty, a shortcoming of conventional contracts that do not account for these factors [9].
This constraint must be recognized for construction contractual frameworks to become more adaptable and resilient, enhancing project performance and stakeholder involvement. A stakeholder perspective analyzes the relationship between the construction of PDSs and their performance. This study aims to explore the participation and management of each stakeholder in the performance of PDS aspects and how these factors influence project performance [10], which highlights the importance of stakeholder engagement and management in project success. The involvement of key project stakeholders, including owners, designers, contractors, and subcontractors, has a significant impact on project performance and is crucial to project success [11].
Indonesian research focuses on PDS within a specific system framework, such as design-build (DB) and design-build-build (DBB), to identify issues that cause poor project performance during implementation. These assessments have not addressed the direct impact of PDS features in the construction contract framework on construction performance, preventing the recurrence of previous research's problematic issues. Therefore, this study thoroughly examines PDS and project performance indicators by identifying all related aspects. Each PDS aspect will be an independent variable (x) that affects project performance (y). Based on stakeholder viewpoints, this research investigates each aspect's regression and determines which variables most affect project performance. The findings of this research could help Indonesian stakeholders prioritize PDS, improving project performance.
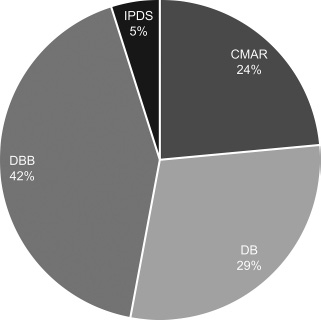
Condition of the PDS in Indonesia. The image illustrates the percentile comparison of DBB kinds as the predominant PDS, whereas CMAR and DB are the least utilized PDS.
1.1. Parameters of PDS
The organization of stakeholder interactions and project timeframes for effective facility development is facilitated by the PDS [12]. The Project Delivery Institute in Moore [13] asserts that establishing roles, responsibilities, and activity sequences is essential for success in a project. The implementation of PDS has a substantial influence on the pace, expenses, excellence, and administration of building projects [14-17]. Choosing the wrong PDS can negatively impact project performance [18]. According to Gajurel [19], the DBB approach is a conventional procurement procedure in which contractors submit bids based on complete blueprints. The DB approach allocates design and construction responsibilities to a single company [20]. The construction manager at risk (CMAR) approach encompasses the involvement of a development team across the whole project lifecycle, providing a high degree of flexibility [21]. The DBB methodology continues to be extensively employed on a global scale, including in Indonesia, for public projects [18, 19, 22-26]. A survey reported (Fig. 1) that 42% of construction in Indonesia relies on DBB, followed by DB and CMAR. Despite the integrated project delivery system (IPDS) being used (5%), a separate contract system is still used, which is unique in Indonesia, where BIM defines IPDS.
According to Morton and Thompson [27], the IPDS and standard PDS undergo stages from conceptualization to construction. However, IPDS distinguishes itself by focusing on early design decisions, contributing to improved efficiency and cost-effectiveness through collaborative endeavors. IPDS, DB, DBB, and CMAR are distinct contract types that differ in their stages and legal elements.
1.2. Variables in PDS Aspects
Previous studies have identified PDS aspects globally [12, 19, 20, 28-35], but these aspects have not been realigned with Indonesian ones to offer thorough iterations on the elements that contribute to and enhance project performance. Therefore, this study first confirms the presence of PDS aspects and identifies commonalities, despite Hansen [8] and Yasin [7] categorizing them by technical, legal, and administrative considerations in Indonesian construction contracts (Table 1). Afterward, it examines PDS variables as independent variables (x).
1.3. Project Performance Indicators
Project performance indicators have been developing over time. For instance, Zimmermann [32] identified safety as an essential prerequisite for the achievement of a PDS, whereas Barnes and Wearne [36] highlighted the importance of cost, quality, and time [37]. According to Freeman and Beale [38], project managers still rely on their instincts regarding these criteria despite attempts to change this behavior. This research examines the dependent variable (y) through a comprehensive literature analysis. The variables considered include time, cost, quality, safety (K3), user satisfaction, party satisfaction, function, environmental performance, and profits [39-49]. Ongoing research and development are being conducted to explore and create additional indicators, which may vary based on the project's size and complexity.
| Var. | Aspects of PDS | Literature/Refs. | Aspects of Contract in Indonesia | Contract Components | Literature/Refs. |
|---|---|---|---|---|---|
| X1 | Project Scope | [12, 19, 20, 29, 31, 32, 33, 35] | Technical | Term Of Reference | [7, 8] |
| •Work plan | Specification | ||||
| •Specification | Drawing | ||||
| •Project requirements | Time | ||||
| •Cost estimation | Method | ||||
| •Time frame | Schedule | ||||
| - | Scope of works | ||||
| - | Finance | Cost | |||
| X2 | Execution of design and construction | [19, 32, 33, 35] | Technical | Forms of agreement of design and construction | |
| X3 | Project phases | [19, 31, 32, 33, 35] | Technical | Sequences of project | |
| Sequences of design and construction process | - | ||||
| X4 | Organization of team (designers, construction and various consultants) |
[12, 19, 29, 31, 32, 33, 35] | Administration | Interrelations among the participants | |
| Key parties | |||||
| Interrelations among the participants | |||||
| X5 | Documentation | [31, 32, 33] | Administration | Progress report | |
| Communication | |||||
| Technology | Communication and technology | ||||
| X6 | Obligations and responsibilities | [12, 29, 31, 32, 33] | Legal | Obligations and responsibilities | |
| X7 | Management | [28, 30, 31, 32, 33, 34] | Legal | Project management (managing time, cost, safety, and quality) | |
| Cost, quality, time, and safety | |||||
| X8 | Compensation and rewards | [33] | Legal | Punishment, compensation for delay | |
| X9 | Closeout of the project | [19, 20, 32, 35] | Legal | Closeout of the project | |
| Inspection of works Hand over |
- | Inspection of works Hand over |
- |
2. METHODS
This study employed the grouping sources technique to examine contract aspects, PDS variables, and project performance indicators to select the research variables [50]. The narrative synthesis of quantitative data [51] was carried out to investigate factor data and variables. This analysis used a correlational study design to find relationships and synthesize PDS variables and project performance indicators, as outlined in Table 2.
2.1. Data Collection using Semantic Differential Scale Questionnaire
Data was gathered from the owner, designer, QS/QE, construction management, contractor, subcontractor, and operations as individuals. The participants were not Indonesian committees or organization members. Individuals consented to be respondents, and the data was presented anonymously. Thus, explicit consent was not needed. As demonstrated above, quantitative variables from direct content literature were utilized to develop questions using a 5-point semantic difference scale to measure each variable's impact on project performance [52]. The snowballing sampling was employed to target architecture engineering construction participants involved in building construction projects across Indonesian cities [53, 54]. Despite not representing all construction members, the quantity of respondents strongly implies the initial preferences that will be examined using linear regression in the preliminary study [55]. This technique took several stages to decrease bias. Questionnaires were sent to numerous initial connections to get non-relative respondents with different viewpoints and experiences. According to Andrieux et al. [56], this approach reduces bias. Second, the respondents who provided linear replies were identified, assuming the questions in Table 3 are irrelevant. Finally, Cronbach's alpha reliability assessment was carried out to check all replies for linearity. However, this preliminary phase requires more research with a larger sample size to support and cross-validate the findings.
This study did not account for the duration of work experience, which could serve as a confounding variable for the subsequent study, and regression could be conducted using ANOVA. After identifying underlying latent variables that explain the observed correlations among multiple variables, factor analysis was carried out [57]. Multivariate regression analysis was then performed to examine the relationships between various independent variables and a dependent variable [58].
2.2. Analysis of Data Distribution
Data were gathered from 102 respondents between October 2022 and March 2023 across various cities in Indonesia. The distribution of respondents by city, ranked by percentage, is as follows: Jakarta 45%, Bandung 32%, Bandar Lampung 7%, with the remaining respondents from other cities, as shown in Fig. (2a). As stated before, this data is initial, and more extensive research is required to encompass several regions that have not been included. The predominant respondents were contractors, constituting the highest percentage, succeeded by D/E. The additional percentages of other stakeholders are depicted in Fig. (2b). Distribution analysis (fit y by x) was carried out among stakeholders regarding the use of PDS types to examine which type is most widely used based on the percentages given in Fig. (3).
The figure shows the distribution of development projects throughout Indonesian cities, with Jakarta as the leading city (Fig. 2a).
The most prominent stakeholders in construction projects include contractors (38%), designers/engineers (28%), owners (16%), construction managers (14%), operations (3%), and quantity surveyors/quality control (1%) (Fig. 2b).
| - | PDS Aspects | - | Project Performance Aspects |
|---|---|---|---|
| X1 | Project closeout | y1 | User’s satisfaction |
| X2 | Organization | y2 | Functionality |
| X3 | Documentation | y3 | Environment performance |
| X4 | Project management | y4 | Stakeholder’s satisfaction |
| X5 | Project scope | y5 | Value and profit |
| X6 | Obligations and responsibilities | y6 | Time |
| X7 | Project phases | y7 | Safety |
| X8 | Execution of design and construction | y8 | Quality |
| X9 | Compensation and rewards | y9 | Cost |
| Aspects | Validation | Scale | ||
|---|---|---|---|---|
| Scope of Work | How does your project determine and implement technical specifications? | Completely unsuitable | 1-2-3-4-5 | Highly suitable |
| Requirements | How are general and special conditions formed and implemented in your project? | Completely unsuitable | 1-2-3-4-5 | Highly suitable |
| Specification | How does your project determine and implement technical specifications? | Completely unsuitable | 1-2-3-4-5 | Highly suitable |
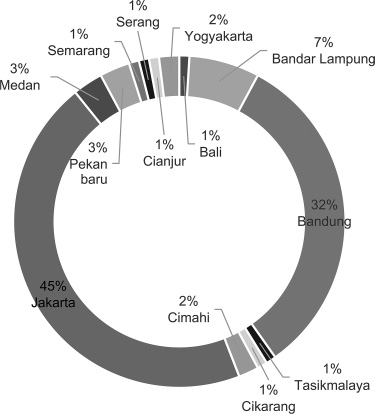
Project location.
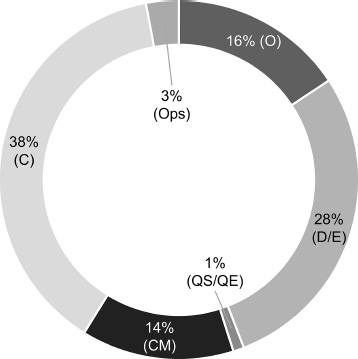
Respondent's position when filling out the questionnaire.
The highest usage of the DBB type was based on D/E experience, making up 16%, while the DB type was primarily derived from contractor experience, accounting for 15%. Based on the owner, the most frequently used PDS type was DBB, which was 8%. For IPDS, it was found that 2% and 3% of contractors and operations have had experience using this type of PDS. The results of this distribution test are very significant, with a Prob> Chisq value of <0.0001.
The most experienced DBB users on construction projects are designers/engineers (16%), contractors (14%), CMAR for construction management (8%), and IPDS for operations (3%) (Fig. 3).
The assessments of stakeholders of the lowest-performing stage of building projects were evaluated based on actual issues. The participants were queried regarding the phase that presented the most significant challenges impeding the project's progress. Fig. (4) shows the design/engineering (D/E), pre-construction, and construction phase results. These results indicated potential difficulties that require additional discussion and thorough scope clarification in future studies (Prob> ChiSq = 0.0048).
2.3. Data Reliability
To assess the reliability of the utilized component data, a Cronbach's α reliability test was conducted, employing a coefficient range interpretation as follows: 0.7 to <0.8 (good), 0.8 to <0.9 (very good), and 0.9 (excellent). This evaluation preceded the multivariate correlational analysis stage [58]. The reliability outcomes for the PDS aspect variable yielded an average Cronbach's α of 0.8484 (indicating very good reliability). At the same time, the project performance variable exhibited a Cronbach's α of 0.8982 (also denoting very good reliability).
2.4. Factor Analysis (FA), Principal Components Analysis (PCA), and Multivariate Regression Analysis
After data reliability was established, principal component analysis (PCA) and varimax rotation were carried out in factor analysis (FA) to identify latent variables from nine PDS aspects and project performance variables. Three factors, which exceeded a cumulative percentage of 75%, showed project performance, while four components represented PDS aspects. This approach maintained the independence of variables. Using JMP Pro, correlation and causation linkages were investigated between PDS aspect variables (χ) and project performance variables (y). This robust PCA effectively replaced missing values based on the patterns observed. In the meantime, utilizing JMP Pro's “explore missing values” showed zero missing results.
3. RESULTS AND DISCUSSION
Following the application of PCA to the PDS-contract variables, four latent variables were identified, which together accounted for nine measurable variables and explained 76.884% of the cumulative variance (Table 4). The latent factors encompassed in this study included management, legal, technical implementation, and reward aspects. According to PCA, which is in line with previous research, legal and technical implementation aspects are most closely associated with project planning and realization. In contrast, technical and implementation aspects have the lowest level of realization.
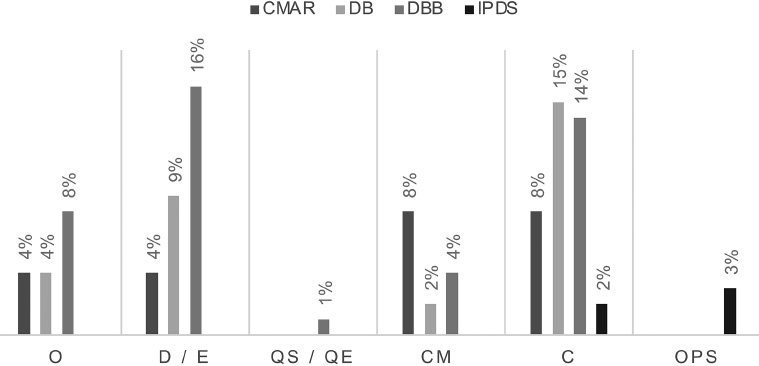
Types of PDS based on stakeholder experience.
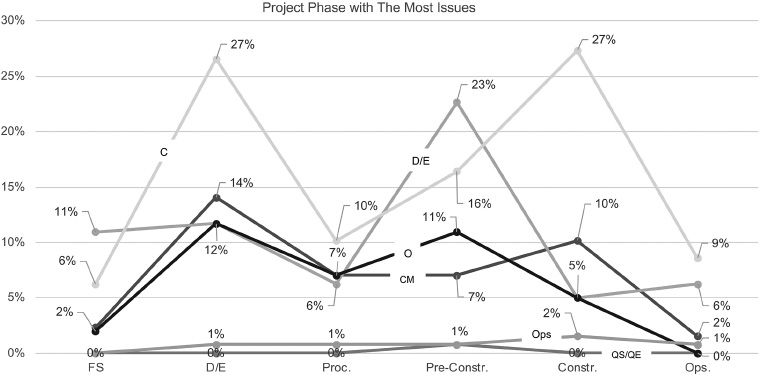
The project phase with the most issues by stakeholders. The data above shows that contractors are more vulnerable to issues during design (27%) and construction (27%), although designers/engineers (23%) require the pre-construction period as a legal requirement.
| Measured Variables | Mean | Factor Loading | Std. Deviation | Eigen Value | % of Variance | Cum % | Cronbach’s Alpha |
|---|---|---|---|---|---|---|---|
| Factor 1: Management aspect | 3.806 | - | 0.688 | 2.351 | 26.124 | 26.124 | 0.816 |
| Project closeout | 3.814 | 0.834 | - | - | - | - | - |
| Organization | 3.912 | 0.717 | - | - | - | - | - |
| Documentation | 3.863 | 0.678 | - | - | - | - | - |
| Project management | 3.637 | 0.674 | - | - | - | - | - |
| Factor 2: Aspects of legal and technical implementation | 3.840 | - | 0.725 | 2.286 | 25.404 | 51.528 | 0.808 |
| Project scope | 3.833 | 0.228 | - | - | - | - | - |
| Obligations and responsibilities | 3.912 | 0.304 | - | - | - | - | - |
| Project phases | 3.775 | 0.244 | - | - | - | - | - |
| Factor 3: Aspects of execution method | 3.353 | - | 1.031 | 1.216 | 13.513 | 65.040 | - |
| Execution of design and construction | 3.353 | 0.136 | - | - | - | - | - |
| Factor 4: Rewards aspect | 3.363 | - | 1.051 | 1.066 | 11.843 | 76.884 | - |
| Compensation and rewards | 3.363 | 0.071 | - | - | - | - | - |
| Measured Variables | Mean | Factor Loading | Std. Deviation | Eigen Value | % of Variance | Cum % | Cronbach's Alpha |
|---|---|---|---|---|---|---|---|
| Factor 1: Satisfaction aspect | 4.268 | - | 0.730 | 3.314 | 36.826 | 36.826 | 0.908 |
| User’s satisfaction | 4.402 | 0.897 | - | - | - | - | - |
| Functionality | 4.196 | 0.767 | - | - | - | - | - |
| Environment performance | 4.118 | 0.703 | - | - | - | - | - |
| Stakeholder’s satisfaction | 4.314 | 0.685 | - | - | - | - | - |
| Value and profit | 4.147 | 0.632 | - | - | - | - | - |
| Time | 4.431 | 0.587 | - | - | - | - | - |
| Factor 2: Quality aspect | 4.353 | - | 0.779 | 2.328 | 25.864 | 62.690 | 0.731 |
| Safety | 4.167 | 0.207 | - | - | - | - | - |
| Quality | 4.539 | 0.385 | - | - | - | - | - |
| Factor 3: Cost aspect | 4.098 | - | 0.990 | 1.255 | 13.946 | 76.636 | - |
| Cost | 4.098 | 0.156 | - | - | - | - | - |
The PCA of correlations revealed three latent variables, quality, satisfaction, and cost aspects for the project performance variables, accounting for 76.636% of the variance (Table 5). The quality aspect was the best according to respondents' answers. Conversely, the cost aspect was the least performed among all the building projects, as reported by Alwi [4].
3.1. Regression of PDS Aspect Variables on Project Performance Variables
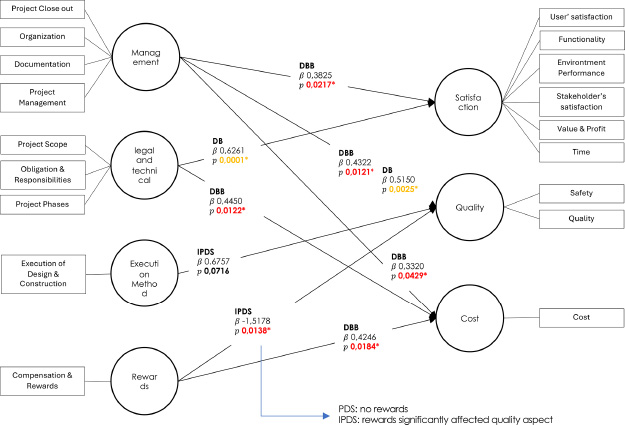
In the next step, the regression analysis was performed between variables χ1-4 and y1-3. The results revealed a regression relationship with an R-squared value of 0.26, a parameter β value of 0.4108, and a significance level (p-value) of <0.0001*, mainly observed in the management aspect of the quality aspect (Table 6).
This phenomenon elucidates that the management aspects, encompassing project management, organization/team, documentation of activities, and project completion, are pivotal in enhancing project performance, particularly regarding quality aspects, such as quality and K3. The subsequent significant cause-and-effect relationships (regression) were sequentially observed in the legal and technical implementation aspects toward the satisfaction aspect, the management aspect toward the satisfaction aspect, and the execution method aspect toward the quality aspect. This association indicated that these three criteria significantly affect Indonesian building project performance. The owner's legal and technical obligations are often unclear, resulting in extra work during the project. This suggests that the feasibility study and design are not mature enough to be the leading cause.
3.2. Regression of PDS Aspect Variables on Project Performance Variables Based on PDS Type
Regression analysis examined the link between project performance and PDS aspect variables for various PDS types. It sought to determine how the project development strategy elements, considering the particular PDS in use, predict project performance. According to Azhar et al. [23], this PDS type promotes efficiency and cooperation, which are critical for excellent project performance. The results demonstrate a cause-and-effect link in PDS-DB's legal and technical aspects (Table 7).
Moreover, in the PDS-DBB type, the management aspect has the highest regression. This aligns with the findings of theoretical studies, as discussed by Azhar et al. [23], which emphasized that the DBB type, characterized by multiple entities, exhibits a higher level of fragmentation and may not inherently promote teamwork. This underscores the significance of prioritizing elements, such as project management, organization/team, documentation of activities, and collaborative efforts in project completion to enhance project performance within the PDS-DBB context. This supports prior results that contractual system-isolated stakeholder connections are often the cause of problems in terms of diverse interests and objectives. Indonesian national, organizational, and professional cultural diversity affects stakeholder relationships. These differences can affect numerous parties’ communication, decision-making, and conflict resolution [59, 60].
The regression analysis of the impact of PDS aspects on quality aspects demonstrated the strongest causal relationships, particularly between management aspects related to the quality aspects of PDS-DB type (β 0.51 and a p-value of 0.0025*) and DBB type (β 0.43 and 0.0121*) (Table 8). Previous studies have stressed the importance of management, supervision, and collaboration in attaining high-quality project outputs, especially when the contractor's management engagement begins during design [23]. In the Indonesian context, project control techniques like internal control systems are important for quality management. Indonesian higher education institutions have found that internal control systems promote communication, cooperation, and leadership, which are necessary for quality improvement [61].
The inverse regression coefficient (β -1.52, p-value 0.0138) of IPDS exhibits value-based commonalities rather than individual pursuits in older PDS, thus supporting the reward aspect of the theoretical framework by AIA [33]. In typical PDS rewards, this standard of transparency is lacking, with only increasing penalties for lower labor quality (the opposite of PDS rewards) being standard offerings. However, IPDS incentivizes parties to share their experiences with fines, prizes, and compensation. This statistic, which accounts for only 5% of respondents, highlights the impact contract compensation and rewards have on project quality. Indonesia's construction industry is booming and growing in workload. The challenges and long working hours faced by construction workers in Indonesia can lead to work-family issues, so improving motivation concerning incentives is important [62]. However, IPDS's small sample size (N=5) makes the regression unreliable, necessitating further causality research.
PDS-DB type has substantial causal correlations between legal and technical implementation (β 0.45, p-value 0.012*) and management aspects (β 0.33, p-value 0.043*), which affect project success and cost. The reward aspect correlates with a parameter β value of 0.42 and a significant p-value of 0.018* (Table 9). This suggests that rewards and sanctions improve project performance, especially cost, in the Indonesian DBB type.
| Project Performance Variable (y1-3) / PDS Variable (x1-4) | Satisfaction Aspect | Quality Aspect | Cost Aspect | |||
|---|---|---|---|---|---|---|
| R-Square 0,16 | R-Square 0,26 | R-Square 0,10 | ||||
| p-value 0,0017 | p-value <0,0001 | p-value 0,0409 | ||||
| β | p-value | β | p-value | β | p-value | |
| Management aspect | 0.28 | 0.0032* | 0.41 | <.0001* | 0.16 | 0.09 |
| Aspects of legal and technical implementation | 0.28 | 0.0031* | 0.16 | 0.06 | 0.18 | 0.07 |
| Aspects of the execution method | 0.06 | 0.52 | 0.22 | 0.0120* | -0.10 | 0.30 |
| Rewards aspect | 0.01 | 0.91 | -0.14 | 0.12 | 0.17 | 0.09 |
| Project Performance Variable / PDS Variable | Contract Type | |||||||||||
|---|---|---|---|---|---|---|---|---|---|---|---|---|
| CMAR | DB | DBB | IPDS | |||||||||
| R-Square | β | p-value | R-Square | β | p-value | R-Square | β | p-value | R-Square | β | p-value | |
| Management aspect | 0.01 | 0.09 | 0.62 | 0.11 | 0.30 | 0.07 | 0.13 | 0.38 | 0.0217* | 0.00 | 0.03 | 0.99 |
| Aspects of legal and technical implementation | 0.10 | 0.30 | 0.13 | 0.41 | 0.63 | 0.0001* | 0.02 | 0.15 | 0.35 | 0.49 | -0.69 | 0.19 |
| Aspects of execution Method |
0.05 | 0.21 | 0.31 | 0.01 | 0.07 | 0.71 | 0.00 | 0.01 | 0.96 | 0.34 | -0.42 | 0.31 |
| Rewards aspect | 0.14 | 0.32 | 0.07 | 0.07 | -0.20 | 0.16 | 0.00 | 0.05 | 0.79 | 0.58 | 1.11 | 0.14 |
| Project Performance variable / PDS Variable | Contract Type | |||||||||||
|---|---|---|---|---|---|---|---|---|---|---|---|---|
| CMAR | DB | DBB | IPDS | |||||||||
| R-sq | β | p-value | R-sq | β | p-value | R-sq | β | p-value | R-sq | β | p-value | |
| Management aspect | 0.10 | 0.26 | 0.13 | 0.28 | 0.51 | 0.0025* | 0.15 | 0.43 | 0.0121* | 0.01 | 0.26 | 0.89 |
| Aspects of legal and technical implementation | 0.09 | 0.26 | 0.15 | 0.09 | 0.33 | 0.11 | 0.00 | 0.01 | 0.93 | 0.00 | 0.01 | 0.99 |
| Aspects of execution method | 0.00 | 0.00 | 0.99 | 0.06 | 0.27 | 0.20 | 0.05 | 0.22 | 0.17 | 0.71 | 0.68 | 0.07 |
| Rewards aspect | 0.01 | -0.07 | 0.67 | 0.02 | 0.48 | 0.01 | 0.01 | -0.13 | 0.51 | 0.90 | -1.52 | 0.0138* |
| Project Performance Variable / PDS Variable | Contract Type | |||||||||||
|---|---|---|---|---|---|---|---|---|---|---|---|---|
| CMAR | DB | DBB | IPDS | |||||||||
| R-sq | β | p-value | R-sq | β | p-value | R-sq | β | p-value | R-sq | β | p-value | |
| Management aspect | 0.06 | 0.20 | 0.25 | 0.14 | 0.33 | 0.043* | 0.00 | 0.05 | 0.76 | 0.00 | 0.95 | 0.95 |
| Aspects of legal and technical implementation | 0.00 | 0.05 | 0.80 | 0.20 | 0.45 | 0.012* | 0.03 | 0.18 | 0.26 | 0.62 | -0.43 | 0.11 |
| Aspects of the execution method | 0.01 | -0.09 | 0.67 | 0.01 | -0.09 | 0.63 | 0.01 | -0.08 | 0.62 | 0.17 | -0.16 | 0.50 |
| Rewards aspect | 0.0 | -0.04 | 0.83 | 0.00 | 0.04 | 0.78 | 0.13 | 0.42 | 0.018* | 0.31 | 0.44 | 0.33 |
These findings are significant in the context of Indonesia, as Dewi et al. [63] reported comparable results in a specialized construction firm, along with two additional studies conducted in Indonesian general firms and in developing nations [64-66]. The result corroborates the traditional premise that incentives can enhance performance, but they must be meticulously designed to prevent negative consequences, supporting the theory of motivation [67, 68]. DBBs struggle with unclear stakeholder compensation and rewards. The legal component of the contract turns this ambiguity into cost-driven, individualized endeavors to avoid late punishments or fines, aligning with the findings of a study by Yasin [7]. The subsequent regression model illustrates the causal relationship between PDS aspects and performance aspects (Fig. 5).
Fig. (5). PCA derives four latent variables (x) representing PDS aspects and three latent variables (y) representing project performance aspects, with the highest regression on appreciation towards quality β -1.5178 with statistically significant results.
The regression model of execution method aspects (parameter=0.6757) is IPDS-specific. However, the regression's p-value is not significant, and the number of respondents (n = 5) (5% of 100%) for the IPDS type might be a confounding factor in determining significant causality from other aspects. However, this IPDS factor is still necessary as a comparative variable for causal relationships with conventional PDS. Obtaining causal facts in further research may be challenging, as this IPDS is still rarely utilized as a construction contract in Indonesia. With a larger IPDS sample, like DBB and DB, the p-value may become substantial, corroborating research on collaborative project management as a risk-reduction method [33]. On the other hand, this compensation and reward phenomenon can be a long-term risk for DBB if it is not addressed in a legal contract, for which it is obvious that IPDS is the mitigation solution. According to regression research, PDS quality has the highest R-squared value and contributes most to project performance. This indicates the extent to which management influences the current condition of Indonesian construction and project quality.
3.3. Regression of PDS Aspect Variables on Project Performance Variables Based on Stakeholders
Regression analysis of the impact of PDS aspect variables on project performance variables by stakeholders examines the relationship between these variables. This analysis examines how the PDS affects and predicts project performance, taking into account stakeholders' perspectives and roles. This regression analysis, focused on stakeholders, identifies aspects that significantly impact project performance from their perspectives. The regression model analysis identified significant connections between distinct stakeholder groups, which are as follows (Fig. 6):
3.3.1. Owners
a. A significant relationship was observed between legal and technical implementation aspects, i.e., reward and cost aspects.
3.3.2. D/E
a. A significant relationship was demonstrated between legal and technical implementation aspects and satisfaction and cost aspects.
b. A significant relationship was found between management aspects and quality aspects.
Regression model of PDS variable – project performance of PDS type.
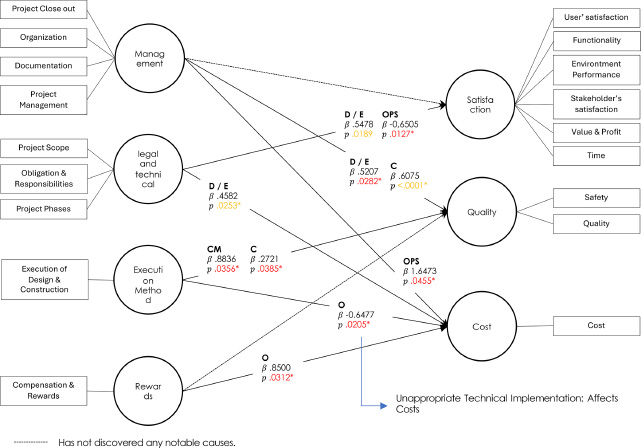
A regression model of PDS variable – Project performance variable by stakeholders. The stakeholder's regression between (x) and (y) shows a maximum β value of 1.6473 between management aspects and costs from the operational perspective, along with further regression levels for each stakeholder.
3.3.3. CM Stakeholders
a. A significant relationship was found between the execution method aspect and the quality aspect.
3.3.4. Contractor
a. A significant relationship was demonstrated between the management aspect and the quality aspect.
b. A significant relationship was reported between the execution method aspect and the quality aspect.
3.3.5. Operational Stakeholders
a. A significant relationship was demonstrated between the legal and technical implementation aspects and the satisfaction aspect.
b. A significant relationship was found between the management aspect and the cost aspect.
These findings underscore the nuanced and varied impacts of project development strategies on project performance, contingent upon the distinct perspectives and priorities of different stakeholder groups involved in the project.
CM has the highest parameter β value of 0.8836 due to the execution method aspect and a p-value of 0.356* in the quality (project performance) aspect. CM is usually performed separately through a contractual agreement, which is typical of Indonesian construction PDS, which might hamper project performance [19, 33]. This emphasizes the importance of CM in the execution method aspect, which affects project performance, notably quality. CM leads project completion, coordinates with engineers/experts, and procures and oversees each construction phase as allocated by the owner. As stated in the literature, CM requires good communication skills to coordinate multiple construction parties [69, 70].
C and D/E present a regression analysis focusing on quality elements (project performance) influenced by management aspects. Particularly, under the DBB type, contractors have a higher level of responsibility compared to designers/engineers. This is particularly pertinent in the context of PDS in Indonesia, where contractors are legally obligated to handle documentation and ensure project completion. This conclusion is corroborated by prior research elucidating the obligations and accountabilities of contractors [69, 70].
From a cost perspective, project performance shows that operational stakeholders have the greatest and most favourable robust regression, with a β value of 1.6473 and a significant p-value of 0.0455*. The β value above 1 is acceptable and consistent with earlier theories [71]. This shows how important the operational team is to project performance during completion. The operational team facilitates commissioning, system training, and operational mode construction with other project teams to transfer all operating and maintenance systems to the owner [72]. Empirically, these operational stakeholders are classified as users in the Indonesian setting. Although building operations are not included in the project phase, it is important to prioritize the involvement of stakeholders from the first stages of the project when determining the direction of contractual development in traditional PDS.
Considering the owner, another significant association was found in cost performance pay and awards (β 0.85; p-value 0.0312*). Traditional PDS contracts often unbalance compensation and rewards. Considering no integration processes exist, the contractor is exclusively liable for delays and specification discrepancies. This is caused by the isolation of other project parties [73-75]. Moreover, it has been observed that compensation and rewards motivate all construction project participants [76, 77]. The above findings strengthen and validate several kinds of literature. Although the research locations differ, this serves as a novel contribution to the construction context in Indonesia. Thus, traditional PDS must consider equity and justice. However, these findings would be more valuable if they were incorporated into the contractual components of traditional PDS in Indonesia, particularly DBB, where the contract is hierarchically separated, making it challenging to effectively support compensation and reward aspects.
CONCLUSION
A stakeholder-based relationship model was derived from regression results. From the owner's perspective, the reward aspect greatly affects the cost aspect (project performance). Rewards and compensation motivate parties, whereas sanctions prevent and encourage cooperation. The award factor in the construction contract may increase costs but improve project performance. Legal and technical implementation aspects are moderately associated with satisfaction and cost aspects for designers/engineers. Moreover, clarity about the scope of work, specifications, project stages, and project obligations and responsibilities affects project performance.
CM greatly affects project performance (quality) and execution method. CM during implementation is essential for overseeing and assessing each stage and preventing non-conformities. The contractor considers the management aspect to affect the quality aspect (project performance) strongly. This supports the claim that the contractor is crucial to construction execution and specification compliance.
Owners, designers/engineers, and contractors mainly observe the use of DBB in PDS. Constant modification in projects leads to challenges during each implementation phase. The design phase presents the most issues, while the pre-construction phase emerges as a project stage with numerous unexplored problems in existing literature, which require further investigation since literature and regulations in Indonesia have not yet recognized it as a contractual stage.
The findings confirm that the conventional PDS type (DBB) performs poorly and that Indonesia's construction industry lacks IPDS contractual norms. Therefore, further projects and research should evaluate the practicality of applying this DBB system to unify parties, establish roles, and ensure fair compensation and team performance based on value, which are the principles of IPDS success. Additionally, a comprehensive strategy integrating human resource development and management can significantly enhance the quality of Indonesian projects. The data used in this study is relatively limited compared to the number of construction projects, particularly concerning the IPDS study object, across major cities in Indonesia. As a result, comparative studies may prove more effective. This study examines the latent variables and their relationships within the context of Indonesia, as the respondents were construction professionals with experience shaped by the local culture and natural conditions of the country. However, PDS and its performance aspects discussed in this study can be used in different countries. Future research should expand and combine the data set with other methods to better represent Indonesian stakeholders, particularly in construction.
AUTHORS’ CONTRIBUTIONS
It is hereby acknowledged that all authors have accepted responsibility for the manuscript's content and consented to its submission. They have meticulously reviewed all results and unanimously approved the final version of the manuscript.
LIST OF ABBREVIATIONS
| PDSs | = Project Delivery Systems |
| DBB | = Design-bid-build |
| D/E | = Designer/engineer |
| CM | = Construction Management |
| DB | = Design-build |
| CMAR | = Construction Manager at Risk |
| IPDS | = Integrated Project Delivery System |
| PCA | = Principal Component Analysis |
| FA | = Factor Analysis |
AVAILABILITY OF DATA AND MATERIALS
The data supporting the article's findings is available in Zenodo.org at https://zenodo.org/records/15307243, reference number 15307243.
FUNDING
This study was funded by School of Architercture, Planning and Policy Developments, Bandung Institute of Technology (Funder ID: SAPPK.PPMI-1-01-2025; Awards Number: 525a/IT1.C08/TA/2025).
ACKNOWLEDGEMENTS
The authors would like to acknowledge the support provided by the Architecture Study Program, the ITB School of Architecture Planning and Development, and the ITB Institute for Research and Community Service.

