All published articles of this journal are available on ScienceDirect.

An Investigation of a Post-tension Problem in a Conference Hall Roof
Abstract
Introduction:
Post-tensioning is a technique for strengthening concrete members by embedding tendons into the concrete before casting. When the concrete has acquired the desired strength, these tendons are tensioned using hydraulic jacks. This study deals with structurally analyzing and designing a 21 m × 25 m conference hall without interior columns contained within eleven stories building.
Methods:
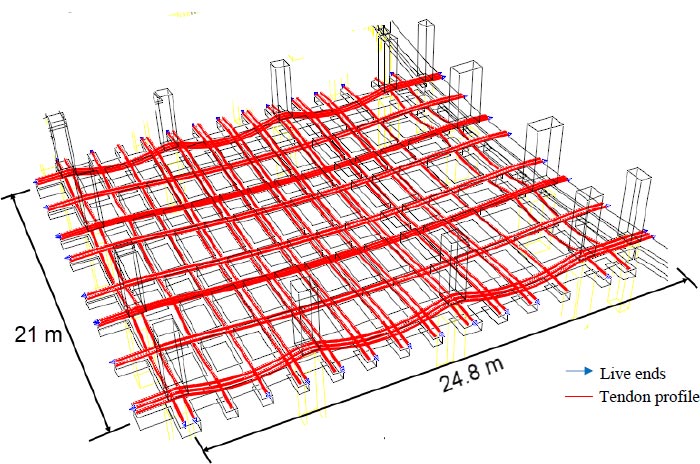
The hall was located on the 9th floor. Many structural floor systems were proposed for the hall such as composite steel-concrete, waffle concrete, and post tensioned girder slab. The structural system of post-tensioned concrete girders with a top reinforced slab was chosen due to its advantages: low deflection and low risk of cracking, and increase of net floor height. Stressing of strands (live ends) was applied from the four sides of the concrete slab. Twenty-three live ends were placed in north-south direction and 20 live ends in east-west direction.
Results:
The ultimate strength of the stands was 1860 MPa. The jacking force, 209 kN, was applied in each strand which represented 75% of ultimate strength. The post-tension concrete slab was analyzed with Ram concept software, which revealed that the total elongation of strands in the E-W direction ranged from 116 mm to 152 mm, and the total elongation of strands in the N-S direction ranged from 120 mm to 172 mm.
Conclusion:
The problem of warping of nine live anchorage ends in the south-north direction was encountered during post-tensioning, which resulted in the movement of strands from their original locations. A rehabilitation plan was proposed to overcome the aforementioned problem.
1. INTRODUCTION
Selecting the appropriate structural system is one of the most integral parts of structural design. This selection has an important effect on the financial, constructional and visual aspects of the structure. Post-tension (PT) slabs are being used extensively in commercial and administration buildings and bridges worldwide. Post-tensioned structures have various advantages over conventionally reinforced buildings.
Firstly, they can span greater distances without intermediate supports, allowing for more versatile and effective design. Secondly, post-tensioning helps to reduce deflection, or bending, which can reduce the risk of concrete cracking, thereby enhancing the structure's durability. Moreover, post-tensioned structures are usually more structurally efficient than traditionally reinforced structures, requiring less material and being more cost-effective. Finally, post-tensioned structures can be designed with thinner and more elegant members, resulting in a more aesthetic appearance [1-3]. The long-term deflection and service behavior of tendons are greatly influenced by the reduction in tension over time, which has been widely recognized as a major contributing factor. Earlier research has revealed that the major contributors to the overall stress reduction in PT concrete were the rheological properties (such as creep and shrinkage) and the relaxation of strands [4, 5]. Additionally, various other factors, such as the time-dependent characteristics of concrete, external loads, and environmental conditions, were found to impact the process of post-tension stress loss [6, 7].
Chróścielewski et al. [8] conducted a study on the factors contributing to extensive cracking in concrete around anchors during the tensioning process. Their findings suggested that the use of different types of reinforcement grids and an inadequate amount of concrete between the tensioning ducts might have resulted in the deterioration of the bridge's tensioning cable anchorages.
The application of post-tensioning force to a concrete section is regarded as a crucial step that demands extreme care. During this procedure, there is a possibility of bursting occurring near the end zone. As a result, a study was performed to determine the variation of stress and bursting force in the end region. The results indicate that the equation recommended by IS 1343 tends to underestimate the bursting force. As a result, a revised design equation is proposed to resolve the problem [9].
He Z. et al. [10] developed a method to predict post-tensioned end anchorage zone bursting cracking stresses. The proposed approach explicitly determines critical stresses in the anchorage zone and accurately assesses the concrete's tensile strength, considering the biaxial stress state and bursting reinforcement.
Ronanki et al. [11] conducted an integrated experimental and analytical investigation to create feasible end zone reinforcement details to minimize end zone cracking in a 78-inch-deep BT girder made of 10 ksi SCC mix.
Lie et al. [12] developed an explicit bearing capacity calculation for anchorage zones, which are susceptible to distributed tension subfield yielding or fan subfield crushing failure.
Numerous studies investigated the bonding properties between tendons and grouting material, which are influenced by various factors, including the type of wire, depth of concrete cover, and the compressive strength of the concrete upon release [13, 14]. The process of post-tensioning concrete slabs can be carried out with either unbounded or bonded tendons. When tendons are bonded, they are entirely bound by the surrounding materials. However, for unbounded systems, the tendons are lubricated and then insulated with a plastic tube to prevent corrosion and reduce friction with the concrete [3-15].
Xie Jian et al. [16] investigated the bonding characteristics of steel strands and concrete at ambient and cryogenic temperatures. The test findings show that temperature fluctuations affect steel strand-concrete bonding. As the temperature drops, the bond stress, which corresponds to a 1 mm steel strand slip in concrete, and the ultimate bond strength initially increase and then decline at the inflection point of -80 °C. Ha Minh et al. [17] studied how chloride-induced corrosion impacted post-tensioned concrete (PC) beams. They tested post-tensioned concrete beams using the electrically accelerated corrosion method with different grout conditions. They found that the corrosion crack width in PC beams grows as the level of grout filling inside the sheath increases.
Clay Naito et al. [18] investigated the reason behind the collapse of the third span of Lake View Drive Bridge, and it was found that the failure was likely caused by a chloride attack on the prestressing strand.
Vehovar et al. [19] investigated a bridge 22 years after it was opened for traffic, they observed that many wires in the prestressing cables had become fragile and had broken, while others had varying degrees of damage caused by corrosion and stress corrosion. The presence of hydrogen at the crack tips was the main cause of that damage.
Wang Lie et al. [20] studied how the flexural behavior of prestressed concrete beams is affected by insufficient grouting and strand corrosion. The findings indicated that strand corrosion occurring in ungrouted ducts can cause a notable decline in the ultimate strength of the beam.
PT concrete structures are considered to have high durability and are commonly used in infrastructures, and also in Nuclear power plant structures. In recent years, however, many degradation problems have been found, which raises serious concerns about the long-term performance of these structures. Chloride-induced strand corrosion has been identified as one of the most predominant degradation factors in these structures [21-23].
In the past 50 years, the use of externally post-tensioned (EPT) steel tendons in the structural rehabilitation of concrete, and steel bridges has been a common practice [24-26]. External post-tension is typically used to decrease the fatigue stresses and deflection [27] Plastic sheaths filled with grease are frequently used to encase steel tendons in an effort to reduce corrosion. However, this protective technique can result in increased costs and inspection difficulties for tendons [27].
Fiber-reinforced polymer (FRP) composite tendons are the most effective solution to counter the corrosion problem. These composite materials are gaining popularity for structural rehabilitation due to their non-corrosive properties and high strength-to-weight ratio. Sun Y et al. [28] performed a parametric analysis to determine how the FRP reinforcement quantity influences the overall performance of beams. The study discovered that decreasing the amount of bonded FRP bars and increasing the amount of unbonded prestressed FRP tendons improved flexural capacity, serviceability, and ductility. Lou et al. [29] compared the short-term behavior of external FRP and steel tendon beams. The analysis demonstrates that beams prestressed with external CFRP and steel tendons behave similarly, while external GFRP tendon beams have lower flexural strengths but improved ductility. Kim and Lee [30] performed flexural tests on three concrete flat plate specimens to analyze the flexural behavior and deflection according to tendon layout. Flexural cracks were found evenly throughout the slabs when the tendons were placed in two directions, and several deep cracks were observed when the tendons were placed in one direction compared to those in two directions. Rare research in the literature reported the difficulty of post-tensioning strands and the methodology for retrofitting them. Retrofitting post-tensioning strands can be a complex task in general since it necessitates an in-depth investigation of the existing structure as well as the selection of appropriate materials and techniques.
In this study, the post-tensioned concrete girders with a top reinforced slab were chosen as the structural roof system for the hall with dimensions of 21m×25 m as shown in Fig. (1).
The analysis and design of the post-tensioned slab were conducted with the Ram Concept program. The stresses at the upper and lower portions of the structure were assessed across different loading scenarios, including initial service loads, service loads, and factored loads. The differences between actual and hypothetical extensions of strands were investigated to verify their compliance with the constraints outlined in the ACI code. While post-tensioning the strands, it was noticed that nine anchor blocks (five on the east side and four on the west side) were out of place, indicating a skewing issue. A repair plan for the nine live ends was developed to address this issue and ensure that the anchor blocks are properly positioned. To the best of our knowledge, no previous rehabilitation plan for this type of problem has been published.
2. MATERIALS AND METHODS
The compressive strength of concrete was measured after 4 and 28 days of curing. Cylindrical concrete samples with dimensions of 300 mm in height and 150 mm in diameter were used for the measurement of compressive strength, following the guidelines outlined in ASTM C39 [31]. The loading rate was maintained at 0.2 MPa/s during the examinations. A compression testing machine with a capacity of 2000 kN was utilized for conducting these tests. The average compressive strength of the concrete, denoted as fc', for the post-tensioned slabs and beams, was measured at 28 days to be 35 MPa. At 4 days (time of post-tensioning), the average compressive strength of concrete was 25 MPa.
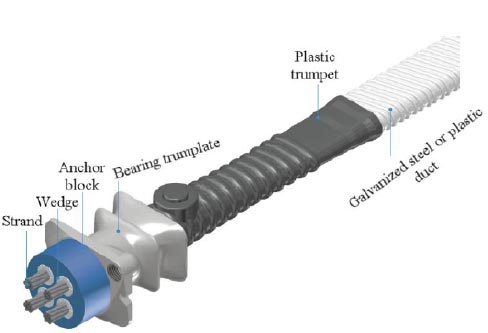
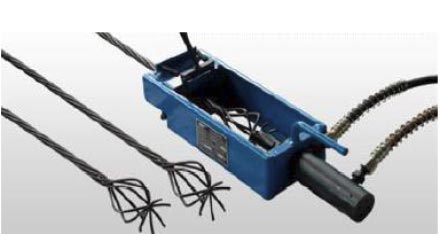
The strands utilized had a diameter of 15.7 mm and a tensile strength of 1860 MPa.The European CON A® CM F post-tensioning system was used as shown in Fig. (2). This system is suitable for thin-concrete sections and having corrugated round or flat tendon ducts utilizing either galvanized steel or plastic material. It has fixed and movable couplers for joining tendons. Table 1 shows the properties of the tendon system. A storage room with a minimum dimension of 12m x 3m was designated for the purpose of storing the PT coils. A maximum of two coils can be vertically stacked on top of one another. The coils were stored on wooden Pallets to avoid soil contact and must be coated with sheeting for further corrosion protection. All anchors, heads, and wedges were stored in a place or container that was not exposed to sunlight, dust, or water.
| System Name | 15.7 Bonded |
|---|---|
| Type | Bonded |
| Aps (mm2) | 150 |
| Eps (MPa) | 195000 |
| Efficive stress, fse (MPa) | 1100 |
| Yeild sress , Fpy (MPa) | 1680 |
| Ultimate stress Fpu (MPa) | 1860 |
| Duct width (mm) | 70 |
| Max. strands per Duct | 4 |
| Jacking stress (MPa) | 1480 |
| Combination | Load Type and Factor | |||||
|---|---|---|---|---|---|---|
| Self–dead | Balance | Hyperstatic | Temporary Construction | Other Dead | Live Load | |
| Self–Dead+ Balance LC | 1 | 1 | 0 | 0 | 0 | 0 |
| Dead+ Balance LC | 1 | 1 | 0 | 0 | 1 | 0 |
| Initial service LC | 1 | 1.15 | 0 | 1 | 0 | 0 |
| Service LC: D + L | 1 | 1 | 0 | 0 | 1 | 1 |
| Factored LC: 1.4D | 1.4 | 0 | 1 | 0 | 1.4 | 0 |
| Factored LC: 1.2D + 1.6L | 1.2 | 0 | 1 | 0 | 1.2 | 1.6 |
3. LOADS
The load type and combinations used in this study are listed in Table 2. The balance load of a tendon is the force applied to the tendon in a post-tensioning system in order to achieve equilibrium and balance the external loads on the structure throughout its service life. A post-tension member undergoes hyperstatic actions as a result of the constraint freedom of movement caused by the supports. The balanced load was used in the service design, whereas the hypostatic load was used in the strength design. As a result, the balance load and the hypostatic load serve different functions in the design of a structure, with the former focusing on the structure's long-term stability and the latter on its ability to withstand high stresses.
In the service load combinations, RAM Concept always considers initial post-tension in tendons as external forces. Changes in tendon stress (from effective stress levels) are deemed internal forces. Consequently, the balanced loading should always be included in the service load combinations, whereas the hyperstatic loading should never be included.
In the design load combinations, the entire force exerted by the tendon is considered an internal force, whereas any additional effects caused by the tendons are considered external forces. It is important to exclude balanced loading from strength load combinations. In contrast, hyperstatic loading should always be included in strength calculations as an external load. The applied superimposed dead load and live load were 3 kN/ m2 and 5 kN/ m2, respectively. The applied superimposed dead load and live load were 3 kN/ m2 and 5 kN/ m2, respectively.
4. ROOF STRUCTURAL SYSTEM
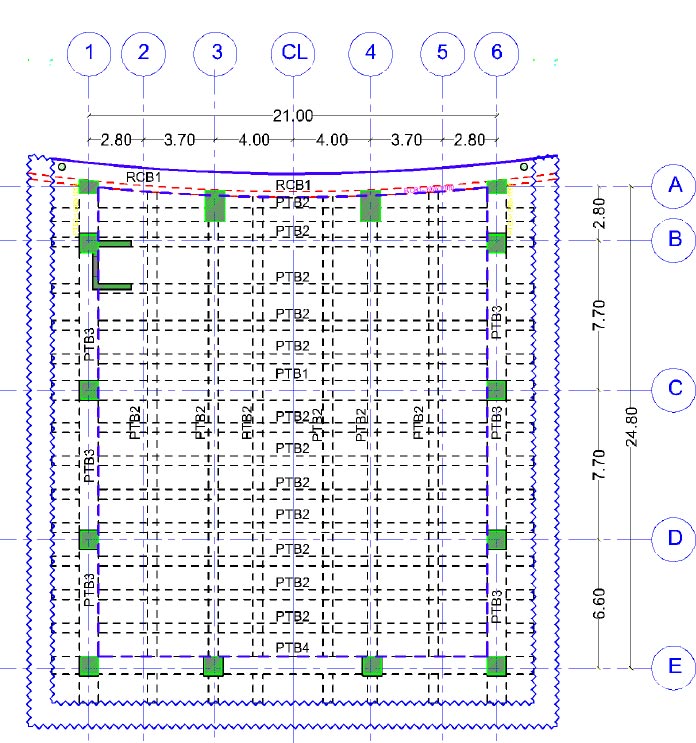
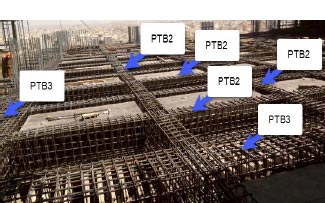
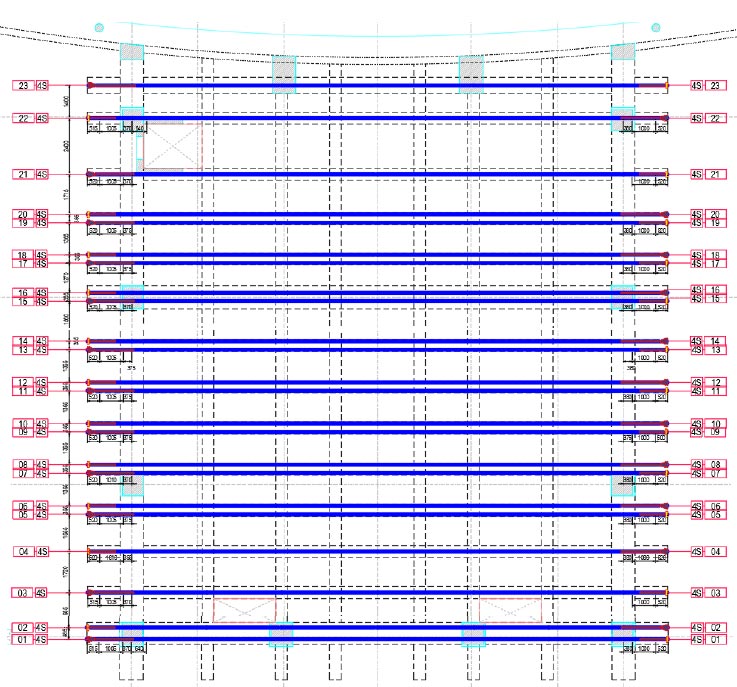
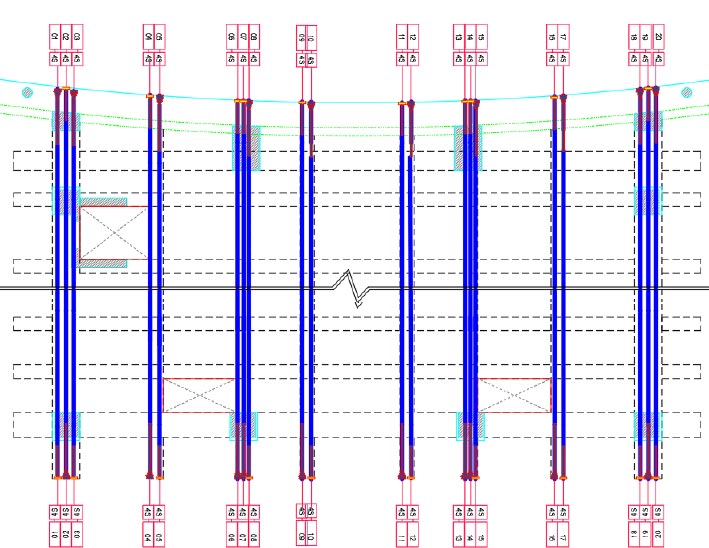
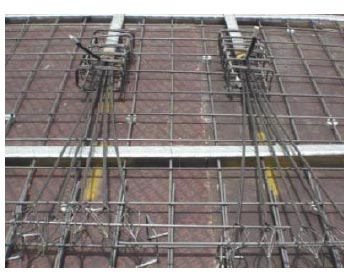
The structural system of the hall roof consists of grid post-tension beams with a top 15 cm thick concrete slab as shown in Fig. (3). The spacing between beams in the west-east direction was 1.75 m whereas the spacing between beams in the north-south direction was 3 m. The dimensions and the number of steel reinforcement bars of post tension beams are shown in Table 3. The top concrete slab is reinforced with top and bottom layers (5#16 /m). Fig. (4) shows the general view of the steel reinforcement of the hall roof before and after installing the slab reinforcement. The configuration of tendons directed east-west is shown in Fig. (5). According to Fig. (5), a total of 23 endpoints were constructed along the east-west direction, including both life and dead ends. The layout of tendons in the north-south direction is shown in Fig. (6). Twenty live and dead ends were installed in the N-S direction as shown in Fig. (6).
| Beam NO# | Dimensions | Bottom Reinforcement | Top Reinforcement | |||||||||||
|---|---|---|---|---|---|---|---|---|---|---|---|---|---|---|
|
B (mm) |
H (mm) |
Continuous (A) | Additional (B) | Continuous (C) | Additional (D) (Left) | Additional (E) (Right) | Side Bars (EF) | |||||||
| NO. | DIA. | NO. | DIA | NO. | DIA. | NO. | DIA. | NO. | DIA. | NO. | DIA. | |||
| RCB1 | 300 | 1000 | 6 | 25 | - | - | 6 | 25 | 2 | 25 | 2 | 25 | 4 | 12 |
| PTB1 | 1000 | 750 | 10 | 25 | 2 | 25 | 10 | 20 | - | - | - | - | 2 | 16 |
| PTB2 | 500 | 750 | 5 | 25 | - | - | 5 | 20 | - | - | - | - | 2 | 16 |
| PTB3 | 1000 | 1000 | 10 | 20 | - | - | 10 | 20 | - | - | - | - | 3 | 16 |
| PTB4 | 900 | 900 | 8 | 20 | - | - | 8 | 20 | - | - | - | - | 3 | 16 |
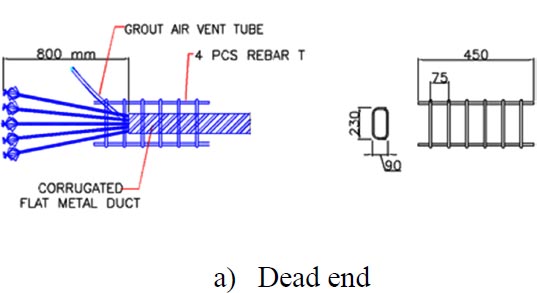
An anchor or termination point where the post-tensioning cable is anchored and cannot be further changed or tensioned is referred to as a “dead end” in a post-tensioning system. A “live end” on the other hand is an anchor or termination point where the cable can still be tensioned or modified after installation. The details of the dead and live ends are shown in Fig. (7). The dead end is often made out of an anchor block or wedge that holds the post-tensioning cable in place. A specific tool is used to wedge the cable tightly in place once it has been threaded through the anchor block. When a cable becomes wedged, it cannot be tensioned further and is considered a fixed point. The live end, on the other hand, is made up of an anchor block or wedge that is used to tension and adjust the post-tensioning cable. This is usually accomplished by using a hydraulic jack that can apply a tension force to the cable, pushing it tighter and increasing the tension. In addition to the anchor block or wedge, both dead and live ends may include other components such as ducts or sheathing to protect the post-tensioning cable from corrosion or damage, as well as grout or other materials to ensure a secure and stable anchorage.
5. POST-TENSION INSTALLATION PROCEDURES
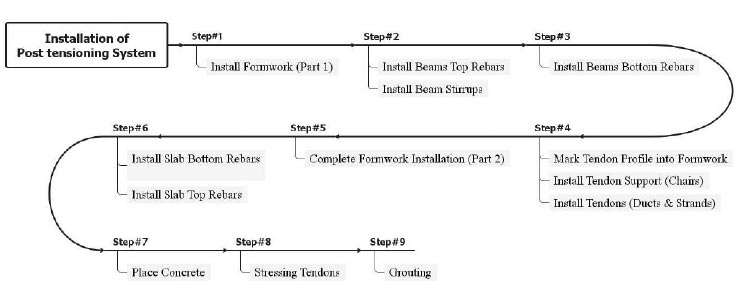
The sequence of installing post-tension system in the hall roof is summarized in Fig. (8). The anchorage positions were marked out on the shutters of the beam side from shop drawings, then the tendon line, and chair positions were marked on the beam soffit, then the shutter was drilled and cut to accommodate the anchorage fixing bolts and strand protrusions.
Flat corrugated galvanized ducts with a width of 70 mm, height of 20 mm and thickness of 0.3 mm were uses for the flat anchorages of the post-tensioned slab and beams. The tendon Duct chair/Support was tied to the stirrups to achieve the required heights. At the end of every duct, there is a steel coupler for connecting to another duct. Couplers should be properly covered with tape to prevent grout from getting in. The duct coupler is made of a bigger size so that a regular-sized duct can fit through it. Most couplers are between 150 and 200 mm long. The strands were pushed into ducts by hand. At least 1.2m length of strand protrudes from the dead end of the duct as shown in Fig. (9). The ends of strands were formed in an onion Shape to increase the bonding capacity of dead ends as shown in Fig. (10). Duct tape was used to fasten the tendon ducts to anchorage.
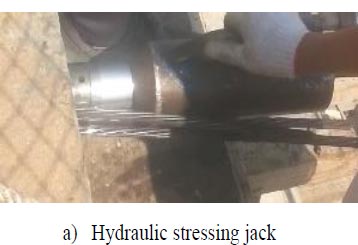
After 4 days from casting the beams and slabs, the formwork was removed to allow installation of barrel and wedges or bearings blocks before the concrete gained its strength. The wedges were installed for each live end. The barrels or bearing blocks were tightly fixed to the face of anchorage casting. The protrusion length of each strand was measured and recorded. The jacking stress was applied smoothly to each strand in turn using a hydraulic jack with a capacity of 300 kN as shown in Fig. (11a). A hydraulic pump with a capacity of 80 MPa was used to provide the pressure for the jack as illustrated in Fig. (11b). Each strand was locked off after stressing and the new protruding length was recorded. If the extension length which the difference between the initial and final extruding length is within limits, the strands were cut.
6. SHORT- AND LONG-TERM LOSSES OF POST-TENSIONED STRANDS
Friction losses are one of many possible sources of prestress losses, both short-term and long-term. When the strands are tensioned, they come into contact with one another, resulting in friction losses. Angle friction and wobble friction are two types of friction that might occur. Angle friction is friction produced at a duct's curved segment, whereas wobble friction is friction induced by unintentional contact at a duct's deformed part (Kim et. al.,2019). The friction losses can be determined using Eq. (1):
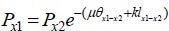 |
where Px1 and Px2 (Px2 > Px 1) represent the prestressing forces at locations xl and x2 on a tendon, with x2 being closer to the tensioning point. The angle friction coefficient is denoted by µ, while the wobbling friction coefficient is represented by k. Additionally, θ x1-x2and lx1-x2 refer to the variations in angle and distance between xl and x2, respectively. According to the limits provided by ACI, the angle friction coefficient that was utilized in this study was 0.2 (1/rad), while the wobble friction coefficient was set at 0.0017 (1/ m). The long-term losses such as creep and shrinkage of concrete, as well as relaxation of strand, were considered to be about equivalent to 150 MP, which is approximately 10% of the jacking stress. The elastic shortening of concrete was included in the long-term losses, even though it is a short-term loss.
7. GROUTING OPERATION
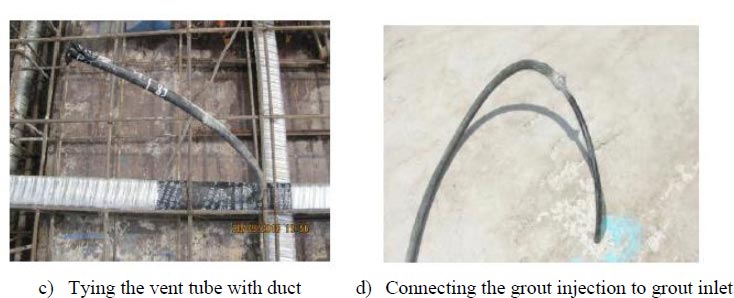
Sika grout was used as grouting material. The grout mix proportions are shown in Table 4. Sika Intraplast Z-HV was used in the mix as an admixture for reducing the bleeding and delaying the setting time. Sikament NN was used as water reducer agent (superplastizer). Many holes were drilled/cut through the top surface of the duct, then plastic vent tubes were inserted in the holes for the passage of the grout through the duct. The plastic vents were fixed by tie and sealed using tape as shown in Fig. (12a).The vent tubes should be extended 300mm outside the concrete surface for future grouting. The water-cement ratio of the grout mix was 0.45. The grout was mixed for a minimum of 2 minutes and then pumped through an injection hose until a good consistency of grout was apparent. The grout injection was connected to the grout inlet to commence pumping the grout to the tendon’s duct as shown in Fig. (12b). The spacing of grout vents should not be more than 12 to 15 m.
| Cement | Water | Sika Intraplast Z-HV | Sikament NN |
|---|---|---|---|
| 100 kg | 34 lit | 0.6 kg | 1.0 lit |
The compressive strength of grout was 43 MPa at the age of 7 days and 55 MPa at 28 days. The grouting was performed about 6 weeks after the stressing operation.
8. RESULTS AND DISCUSSIONS
8.1. Jacking Force and Elongation of Strands
Ram concept was used for the post-tensioning beam to comply with ACI-code requirements in which the flexure members are classified into three classes: uncracked(U), transition (T) and cracked (C) based on the computed extreme fiber stress in tension in the pre-compressed tensile zone at service loads. The tension stress should be less than 7.5
 in the uncracked section, between 7.5
and 12
in the transition section and greater than 12
in the cracked section ACI 18.3.4. In this study, the section was designed as a T class in which the stresses at service load are determined using uncracked section properties. The ultimate strength of stands was 1860 MPa. The jacking force, 209 kN, was applied in each strand which represented 75% of ultimate strength. The Ram concept results of the total average elongation of the four strands in the 23 live ends of EW direction are shown in Table 5. The total elongation of strands in the E-W direction varied between 116 mm to 152 mm. Table 6 shows the average total elongations obtained from the Ram concept for strands in the N-S direction. The total elongation of strands in the N-S direction varied between 120 mm to 172 mm.
in the uncracked section, between 7.5
and 12
in the transition section and greater than 12
in the cracked section ACI 18.3.4. In this study, the section was designed as a T class in which the stresses at service load are determined using uncracked section properties. The ultimate strength of stands was 1860 MPa. The jacking force, 209 kN, was applied in each strand which represented 75% of ultimate strength. The Ram concept results of the total average elongation of the four strands in the 23 live ends of EW direction are shown in Table 5. The total elongation of strands in the E-W direction varied between 116 mm to 152 mm. Table 6 shows the average total elongations obtained from the Ram concept for strands in the N-S direction. The total elongation of strands in the N-S direction varied between 120 mm to 172 mm.
| Type-No | No-of-Strands | Length-m | No-of-Live-End | Strand-Type | Jacking-Force-kN | Total-Elongation-mm |
|---|---|---|---|---|---|---|
| 01 | 4S | 24.8 | 1 | 15.7 | 209 | 116 |
| 02 | 4S | 24.8 | 1 | 15.7 | 209 | 116 |
| 03 | 4S | 24.8 | 1 | 15.7 | 209 | 118 |
| 04 | 4S | 24.7 | 1 | 15.7 | 209 | 152 |
| 05 | 4S | 24.8 | 1 | 15.7 | 209 | 152 |
| 06 | 4S | 24.8 | 1 | 15.7 | 209 | 152 |
| 07 | 4S | 24.8 | 1 | 15.7 | 209 | 152 |
| 08 | 4S | 24.8 | 1 | 15.7 | 209 | 152 |
| 09 | 4S | 24.7 | 1 | 15.7 | 209 | 152 |
| 10 | 4S | 24.8 | 1 | 15.7 | 209 | 152 |
| 11 | 4S | 24.8 | 1 | 15.7 | 209 | 152 |
| 12 | 4S | 24.8 | 1 | 15.7 | 209 | 152 |
| 13 | 4S | 24.8 | 1 | 15.7 | 209 | 152 |
| 14 | 4S | 24.7 | 1 | 15.7 | 209 | 152 |
| 15 | 4S | 24.8 | 1 | 15.7 | 209 | 152 |
| 16 | 4S | 24.8 | 1 | 15.7 | 209 | 152 |
| 17 | 4S | 24.8 | 1 | 15.7 | 209 | 152 |
| 18 | 4S | 24.8 | 1 | 15.7 | 209 | 152 |
| 19 | 4S | 24.8 | 1 | 15.7 | 209 | 152 |
| 20 | 4S | 24.8 | 1 | 15.7 | 209 | 152 |
| 21 | 4S | 24.8 | 1 | 15.7 | 209 | 152 |
| 22 | 4S | 24.8 | 1 | 15.7 | 209 | 118 |
| 23 | 4S | 24.8 | 1 | 15.7 | 209 | 118 |
| Type-No | No-of-Strands | Length-m | No-of-Live-End | Strand-Type | Jacking-Force-kN | Total-Elongation-mm |
|---|---|---|---|---|---|---|
| 1 | 4S | 27.7 | 1 | 15.7 | 209 | 131 |
| 2 | 4S | 27.7 | 1 | 15.7 | 209 | 120 |
| 3 | 4S | 27.6 | 1 | 15.7 | 209 | 131 |
| 4 | 4S | 27.5 | 1 | 15.7 | 209 | 172 |
| 5 | 4S | 27.5 | 1 | 15.7 | 209 | 169 |
| 6 | 4S | 27.3 | 1 | 15.7 | 209 | 171 |
| 7 | 4S | 27.3 | 1 | 15.7 | 209 | 171 |
| 8 | 4S | 27.3 | 1 | 15.7 | 209 | 169 |
| 9 | 4S | 27.2 | 1 | 15.7 | 209 | 170 |
| 10 | 4S | 27.2 | 1 | 15.7 | 209 | 169 |
| 11 | 4S | 27.2 | 1 | 15.7 | 209 | 170 |
| 12 | 4S | 27.2 | 1 | 15.7 | 209 | 169 |
| 13 | 4S | 27.2 | 1 | 15.7 | 209 | 170 |
| 14 | 4S | 27.2 | 1 | 15.7 | 209 | 170 |
| 15 | 4S | 27.3 | 1 | 15.7 | 209 | 169 |
| 16 | 4S | 27.4 | 1 | 15.7 | 209 | 172 |
| 17 | 4S | 27.5 | 1 | 15.7 | 209 | 169 |
| 18 | 4S | 27.7 | 1 | 15.7 | 209.0 | 131 |
| 19 | 4S | 27.7 | 1 | 15.7 | 209.0 | 121 |
| 20 | 4S | 27.7 | 1 | 15.7 | 209.0 | 131 |
Table 7.
| Tendon Reference | Average Actual Extension (mm) | Theoretical Extension (mm) | Tolerance % | Tendon Reference | Average Actual Extension (mm) | Theoretical Extension (mm) | Tolerance % |
|---|---|---|---|---|---|---|---|
| Type X-1 | 116.3 | 116 | 0.22 | Type X-17 | 144.3 | 152 | -5.10 |
| Type X-2 | 117.0 | 116 | 0.86 | Type X-18 | 138.0 | 148 | -6.76 |
| Type X-3 | 124.0 | 118 | 5.08 | Type X-19 | 142.3 | 152 | -6.41 |
| Type X-4 | 141.7 | 152 | -6.80 | Type X-20 | 141.0 | 150 | -6.00 |
| Type X-5 | 135.0 | 145 | -6.90 | Type X-21 | 148.8 | 152 | -2.14 |
| Type X-6 | 153.3 | 152 | 0.82 | Type X-22 | 117.8 | 118 | -0.21 |
| Type X-7 | 145.0 | 152 | -4.61 | Type X-23 | 129.8 | 122 | 6.35 |
| Type X-8 | 125.5 | 134 | -6.34 | - | - | - | - |
| Type X-9 | 134.8 | 144 | -6.42 | - | - | - | - |
| Type X-10 | 141.0 | 150 | -6.00 | - | - | - | - |
| Type X-11 | 138.3 | 148 | -6.59 | - | - | - | - |
| Type X-12 | 143.0 | 152 | -5.92 | - | - | - | - |
| Type X-13 | 136.3 | 145 | -6.03 | - | - | - | - |
| Type X-14 | 148.8 | 152 | -2.14 | - | - | - | - |
| Type X-15 | 139.3 | 149 | -6.54 | - | - | - | - |
| Type X-16 | 139.8 | 150 | -6.83 | - | - | - | - |
| Tendon Reference | Average Actual Extension (mm) | Theoretical Extension (mm) | Tolerance % | Tendon Reference | Average Actual Extension (mm) | Theoretical Extension (mm) | Tolerance % |
|---|---|---|---|---|---|---|---|
| Type Y-1 | 130.8 | 131 | -0.19 | Type Y-17 | 156.0 | 166 | -6.02 |
| Type Y-2 | 149.5 | 140 | 6.79 | Type Y-18 | 121.0 | 129 | -6.20 |
| Type Y-3 | 121.8 | 130 | -6.35 | Type Y-19 | 118.5 | 121 | -2.07 |
| Type Y-4 | 162.0 | 172 | -5.81 | Type Y-20 | 126.0 | 131 | -3.82 |
| Type Y-5 | 154.0 | 164 | -6.10 | - | - | - | - |
| Type Y-6 | 161.3 | 171 | -5.70 | - | - | - | - |
| Type Y-7 | 155.5 | 166 | -6.33 | - | - | - | - |
| Type Y-8 | 161.5 | 169 | -4.44 | - | - | - | - |
| Type Y-9 | 163.3 | 170 | -3.97 | - | - | - | - |
| Type Y-10 | 155.3 | 165 | -5.91 | - | - | - | - |
| Type Y-11 | 159.0 | 170 | -6.47 | - | - | - | - |
| Type Y-12 | 152.0 | 162 | -6.17 | - | - | - | - |
| Type Y-13 | 156.8 | 168 | -6.70 | - | - | - | - |
| Type Y-14 | 153.3 | 164 | -6.55 | - | - | - | - |
| Type Y-15 | 159.8 | 169 | -5.47 | - | - | - | - |
| Type Y-16 | 155.8 | 165 | -5.61 | - | - | - | - |
8.2. Comparison between Theoretical and Actual Elongation of Strands
The values of actual and theoretical elongations of strands elongations in E-W and N-S directions are listed in Tables 7 and 8, respectively. It can be noticed from Tables 7 and 8 that the tolerances are within the allowable limits recommended by ACI 318 code which are ±7% on the average of all strands in a tendon longer than 15 m. After the stated extensions had been reviewed and approved, the strands were cropped and the tendon ducts were grouted within 6 to 8 weeks of stressing operation.
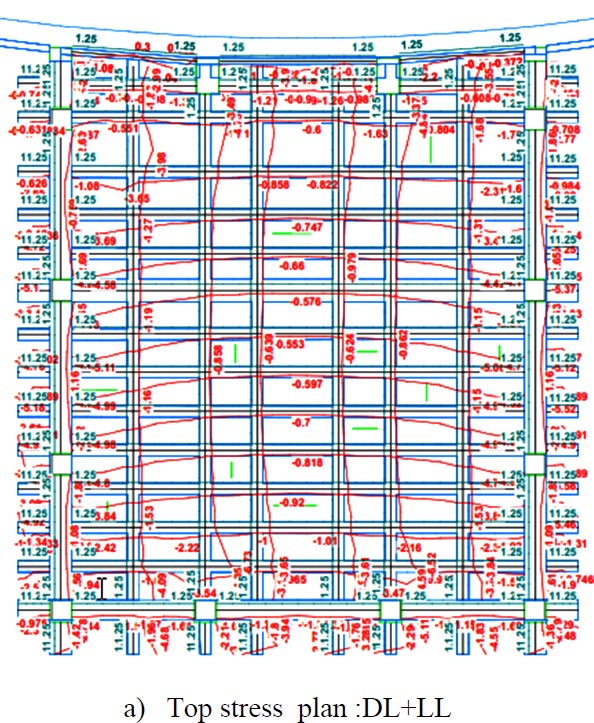
8.3. Top and Bottom Stresses at Service Load
The post-tensioning tendons are designed to counteract the stresses caused by service loads, and the slab is designed to distribute the loads and stresses efficiently across its cross-section. The amplitude and distribution of top and bottom stresses as a result of service loads are shown in Fig. (13a, b). These stresses are affected by a number of parameters, including the type and intensity of the loads, the placement and spacing of the post-tensioning tendons, and the stiffness and strength of the slab. The limits of compressive and tensile stresses are obtained by the two equations below [29]:
 |
(1) |
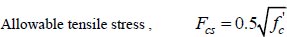 |
(2) |
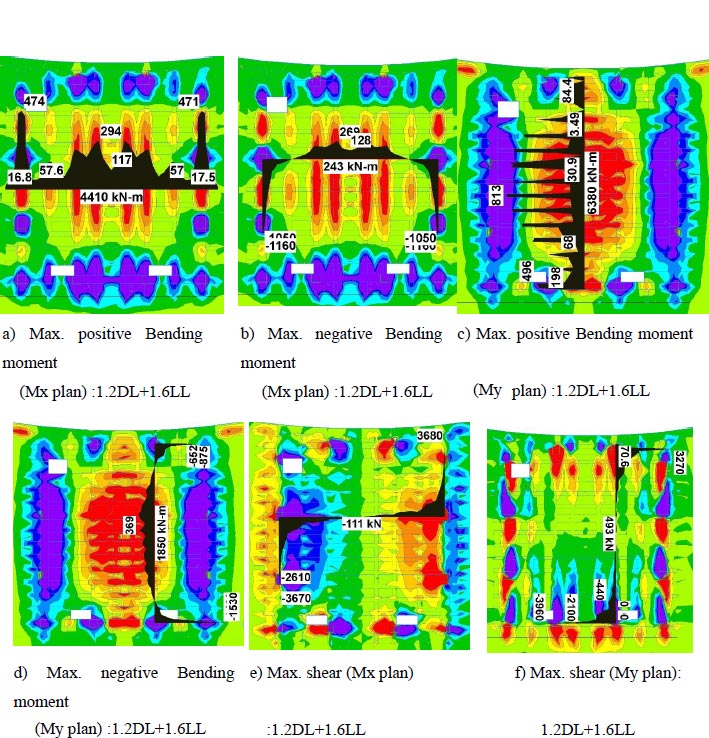
8.4. Internal Forces (Bending Moment and Shear)
The results of the maximum bending moment and shear forces due to combination load (1.2DL+1.6 LL) are shown in Fig. (14). The bending moment distribution tool in Ram Concept software was used to plot the bending moment about the axis of the specified line. The integrated moment indicated beneath the moment distribution plot (e.g., 4410 kN.m in Fig. 14a) represents the whole area of the plot but does not reflect the bending moment value. The beam located in the middle of the post-tension roof in the x direction has a maximum positive moment of approximately 474 kN.m as shown in Fig. (14a), while the beam along axis c (Fig. 3) has a maximum negative moment of 1160 kN.m, as shown in Fig. (14b). The beam that is positioned in the middle of the post-tension roof in the y direction has a maximum positive moment of approximately 813 kN.m (Fig. 14c), while the beam that is positioned along axis 4 (Fig. 3) has a maximum negative moment of 1530 kN.m as shown in (Fig. 14d). The greater values of shear forces are located at the circumferential beams of post-tensioned roof (Fig. 14e and 14e). The beam along axis c has a maximum shear force of 3680 kN (Fig. 14f) whereas the beam along axis 4 has a maximum shear value of 3960 kN (Fig. 14f).
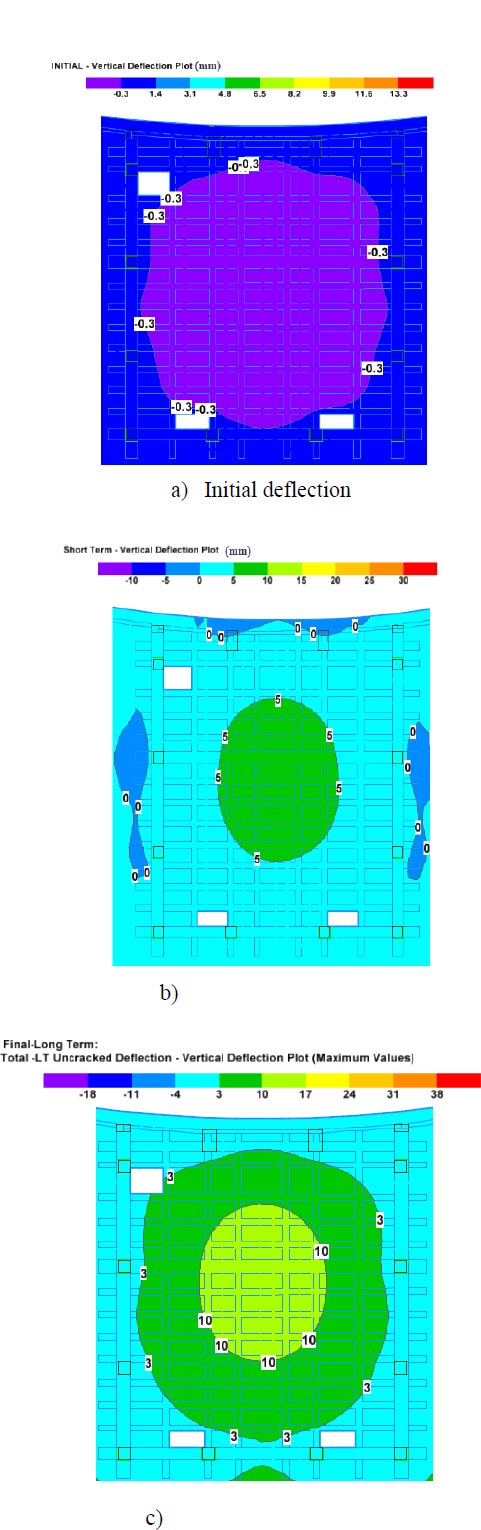
8.5. Initial, Short- and Long-term Deflection
The term “initial deflection” refers to the deflection caused by the combined action of post-tensioning forces and the slab's self-weight. The term “short-term deflection” refers to the deflection that occurs immediately following the application of partial or full-service loads. Long-term deflection, on the other hand, appears gradually over time and is mostly due to the effects of material shrinkage and creep. Slab deflection causes a variety of deterioration problems, including cracking. which may result in substantial structural damage or loss of property if it takes place in a short time [30]. Fig. (15) depicts the analysis results for the deflection occurring in the PT slabs for initial, short, and long term. The maximum upward deflection due to post-tensioning forces was 0.3 mm (Fig. 15a) and the maximum downward short and long-term deflection was 5mm (Fig. 15b) and 10mm (Fig. 15c) respectively. The short and long deflection is less than the limits (L/360 (69.44mm) and L/240 (10.41 mm) provided by ACI-318. The most significant advantages of PT systems over traditional reinforcement structures are longer spans and low deflection.
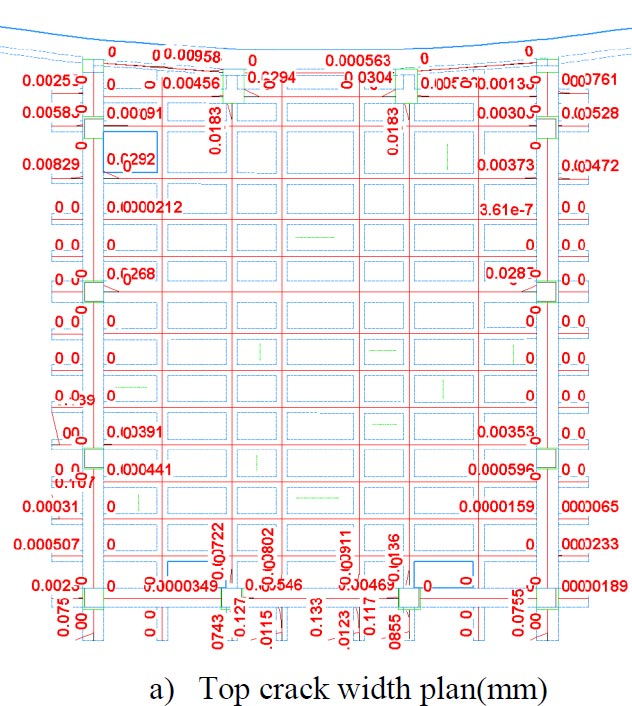
8.6. Crack Width
In the Ram concept model, the concrete was assumed to carry only small tension stress, the crack width can be calculated as follows [32]:
 |
(3) |
Where
εc is the cross-section strain at crack elevation, and d* is distance from crack to centroid of nearest reinforcement is obtained by Eq. (4):
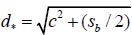 |
(4) |
Where c is the perpendicular (shortest) distance from the concrete face to the reinforcement centroid, and sb is the spacing of reinforcement. The predicted crack widths at the bottom and top of post-tension beams are shown in Fig. (16). It is apparent that the maximum crack width is significantly less than the ACI code's recommended limit of 0.2 mm.
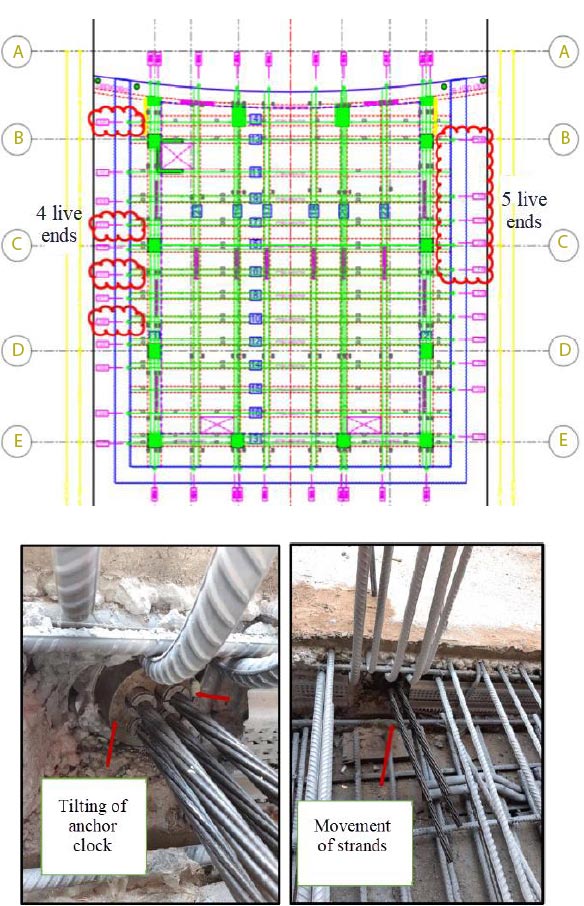
8.7. Problems Faced during Post -tensioning
During the post-tensioning of the strands, 5 anchor blocks in the east direction and 4 in the west direction were tilted from their original positions as shown in Fig. (17), which led to the moving of one side of the anchor block inward PT beam face while other side moving outward which results in movement of strands from their locations as shown in Fig. (17). The tilting problem of anchor blocks was not noticed at the north or south directions.
8.8. Executive Repairing Plan
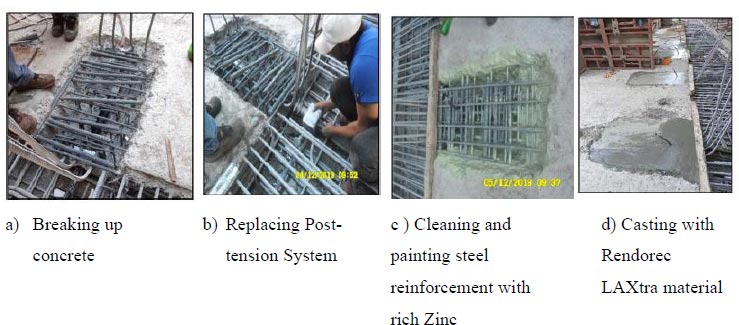
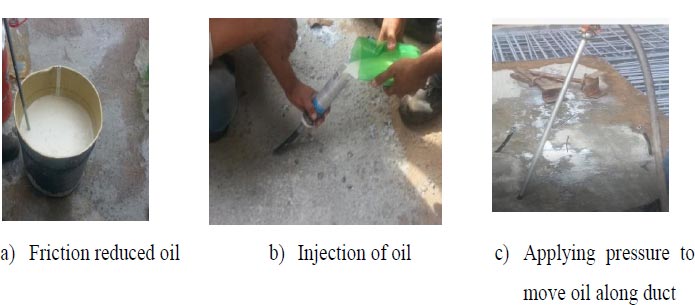
The visual inspection reveals that the anchor block tilting problem may be caused by insufficient vibration of the concrete during casting, resulting in unconsolidated concrete at the live ends. Congested steel reinforcement at the live ends, combined with insufficient vibration, results in concrete segregation. The repair plan was proposed to overcome the problem of anchor blocks tilting at the nine liv ends. The post-tension at the tilted anchor blocks was released and the strands returned back to their original status. The concrete at the live ends which has a problem was broken up with the air compressor. A new set of anchor, bearing, and wedges were installed to replace the existing post-tension system. Then, the concrete surface was cleaned and steel reinforcement was painted with rich zinc material. The zinc-rich paint is a type of coating that contains a high concentration of 65-95% metallic zinc in dry film, which provides corrosion protection to steel surfaces. The broken-up concrete was replaced by high-workable concrete (Rendorec LAXtra) which is suitable for mass infill to structural repairs in all types of load-bearing situation and usually used in regions with congested steel reinforcement. 3.38 liters of Water were used for mixing 25 kg of Rendorec LAXtra. The compressive strength of Rendorec LAXtra is about 40 MPa at 7 days and 60 MPa at 28 days. Fig. (18a-d) shows the steps of the repairing process. The post-tension was conducted after 7 days from casting. The friction between strands and ducts was reduced by using a straight emulsifiable oil. The appearance and color of the oil are shown in Fig. (19a). The emulsifiable oils are commonly used in post-tensioned construction to reduce friction losses between the tendons and the ducts, thereby enhancing the transmission of post-tension forces and decreasing the likelihood of tendon rupture or failure. The oil was injected into the plastic vent tube as shown in Fig. (19b) and then, the pressure was applied to move the oil along the entire length of strands or ducts (Fig. 19c).
CONCLUSION
The post-tensioned concrete girders with top reinforced slab were chosen as the structural roof system for the hall with dimensions of 21m×25 m due to the following reasons:
• It can span longer distances without the need for intermediate support columns, allowing for more flexible and open floor plans.
• It is capable of supporting heavier loads and is less susceptible to cracking and deflection than conventional reinforced concrete floors.
Based on the findings derived from the Finite Element Method (FEM) analysis conducted using Ram Concept software and subsequent field construction, the following conclusions can be drawn:
• The stresses at the top and bottom of the structure were evaluated under various load conditions, including initial service, service, and factored loads. It was verified that these stresses remained within the specified limits.
• The strand elongations caused by post-tensioning were evaluated to ensure that the differences between actual and theoretical values were within the ACI code's prescribed limitations.
• The maximum deflection values for initial, short-term, and long-term conditions were determined by Ram Concept software as -0.3mm, 5mm, and 10mm, respectively. These values were found to be below the permissible limits.
• During the process of post-tensioning the strands, it was noted that a total of five anchor blocks on the east side and four on the west side exhibited skewing from their initial positions. Consequently, this led to the displacement of the strands at these respective live ends.
• The repair plan was developed to resolve the problem of anchor blocks tilting at the nine live ends. The strands were returned to their original position by releasing the post-tensioning forces. The concrete at the live ends that had a problem was broken apart with an air compressor. The old post-tension system (anchor, bearing, and wedges) was replaced by a new one. The concrete was then cleaned, and the steel reinforcement was sprayed with a zinc-rich paint. High workable concrete (Rendorec LAXtra) was used to replace the broken-up concrete.
• The friction between strands and ducts was reduced by injecting and pressurizing an emulsifiable oil in the tendons’ ducts. Subsequently, the tendons underwent a second round of tensioning, and the differences between the expected and actual elongation of the strands remained within the acceptable limits defined by the ACI 318 code.
• Proper vibration during the casting is essential to avoid the problem of anchorage blocks tilting at the live ends. Likewise, careful arrangement of steel reinforcement is necessary to prevent congestion and subsequent segregation.
LIST OF ABBREVIATIONS
| PT | = Post-tension |
| EPT | = Externally Post-tensioned |
| FRP | = Fiber-reinforced Polymer |
CONSENT FOR PUBLICATION
Not applicable.
AVAILABILITY OF DATA AND MATERIALS
The data and supportive information are available within the article.
FUNDING
None.
CONFLICT OF INTEREST
The author declares no conflict of interest financial or otherwise.
ACKNOWLEDGEMENTS
Declared none.

