All published articles of this journal are available on ScienceDirect.

Effect of Variation in Moisture Content on Soil Deformation and Differential Settlement of Frame Structures in Nairobi Area and its Environs
Abstract
Background:
The stability of structures to a great extent depends on the foundation. The foundation of a building structure plays a key role in transferring the loading from the structure to the soil underneath. In foundation design, the effect of changes in soil moisture content to soil deformation and subsequent differential settlement during the lifespan of a structure is often ignored.
Objective:
This research establishes the relationship between soil moisture content and soil deformation for soils in the Nairobi area and its environs. Soil deformation in some foundation supports in a building leads to an unequal settlement resulting in differential settlement. The research further determines the influence of soil deformation on the differential settlement of a typical four-storey reinforced concrete frame structure.
Methods:
Seven soil samples collected from the Nairobi area and its environs were subjected to moisture content variation. Soil deformation was measured, and the laboratory test results were applied to determine the modulus of subgrade reaction constant for the elastic foundation. A four-storey reinforced concrete frame structure was modelled at varying foundation conditions. The resulting differential settlement for frame structure was evaluated. Two control cases were assessed. The structural behaviour depicted by changes in bending moments, shear forces, differential settlement, and member stresses for varying foundation cases was assessed. Staad Pro software was applied in structural modelling.
Results:
Increasing soil moisture content from 30% to 50% and 75% by keeping all other factors constant led to increased soil deformation ranging from 17.2% to 34% for the 7 soil samples tested. Structural modelling revealed that increasing soil moisture content at a group of four outer footings in a 16 footings’ building contributes to significant changes in shear forces, bending moments, compressive and tensile stresses, and supports the differential settlement. Differential settlement induced by soil deformation arising from an increase in soil moisture content from 30% to 75% increased by 49.1%.
Conclusion:
Increase in soil moisture content contributed to soil deformation, which led to a significant differential settlement in a line of foundation’s outer footings in a building. The moisture content-caused differential settlement, which contributed to remarkable changes in the amount and distribution pattern for shear forces, bending moments, compressive and tensile stresses, and node displacement when the soil moisture content was increased from 30% to 75%.An increase in soil moisture content to 50% and above at some footings of a building would lead to structural failure unless the building structure is specifically designed to withstand such differential settlement. Construction stakeholders should consider the differential settlement attributed to variation in soil moisture content during the structure’s lifespan and safety factors adequately at the design stage to avoid potential structural failure and even collapse.
1. INTRODUCTION
Foundation should support the weight of a structure without excessive settlement to avoid collapse. Equally, foundation systems should be capable of resisting both transient and permanent ground deformations without causing excessively large displacements in the supporting structures [1]. The key factors considered in determining the most economical foundation of a building include; the superstructure load, subsoil conditions, and the desired tolerable settlement [2,3]. Even though the equal settlement of a group of footings in a building is likely to result in a uniform settlement, the unequal settlement of a group of footings in a building very likely results in the damage of inflexible structural and architectural materials such as concrete structures [4] due to differential settlement. Varying soil moisture content in a group of footing in a building can lead to differential settlement of structures and such settlement can occur during construction or when a building is complete and in use [5-11]. Therefore, engineers are faced with a challenge to accurately predict the extent of soil settlement and design buildings that limit the extent of differential settlement. Information on the extent to which the presence and variation of soil moisture content affect soil deformation, causing differential settlement that affects the stability of structures, forms the basis for this research paper.
Water significantly influences the strength and deformation of fine-grained soils [12]. In regard to soil plasticity index, soil in extreme liquid state has the lowest strength and the largest deformation. Subsequently, soils in the extreme solid-state have the largest strength and the lowest deformation. When soil is loaded, the surface stresses are distributed within the soil mass resulting in soil deformations. Settlement of soils is caused by the stress transmitted to the soil particles [12], in which soil pushes particles together, creating soil deformation. Recently, Kenya and other developing countries have witnessed increasing cases of buildings collapsing. This has resulted in the loss of lives, infliction of injuries, and huge loss of investment for developers. Past research works identify the major causes of buildings failure as dependent on the quality of building materials used, workmanship employed in the concrete mix proportioning, construction methods, defective designs, foundation challenges, and non-compliance with specifications [13-17]. The population of Nairobi has been steadily increasing, and human activities have caused major changes in land use and large-scale landscape modifications. To meet the ever-increasing housing demand for the growing urban population, developers have moved to sites with poorer subsoil characteristics, such as near river valleys, swamps, former springs, and dump sites [10]. The effects of increased soil moisture content on the foundation are usually not considered.
While past studies [18-22] show that soil bearing capacity changes once the soil experiences change in moisture, it is not clear to what extent the changes affect soil deformation and its subsequent effects on differential settlement of buildings. The design strength during the structural design of structures is often higher than the required strength due to various factors [23], leading to reserve strength not accounted for in design [24]. The strength resistance of a reinforced concrete frame structure may be higher than the actual ultimate strength of the frame structure due to design factor of safety, use of reduction factors or material factors in design, additional reinforcement placed for construction purposes or to satisfy minimum reinforcement, participation of non-structural members, moment redistribution after yielding greater than assumed in design, dynamic loading effects from member strength, compressive strength of concrete and yield strength of steel, and geometry and ductility factors of reinforced concrete frames of a structure [25,24]. Various authors have proposed different factors of material strength and safety factors for consideration in the design of reinforced concrete structures. The structure overstrength is estimated to be about 1.5 times the nominal strength of a building [25]. Bowles developed a formula for determining spring constant based on the settlement of 25 mm and the ultimate bearing pressure of soil [26-28]. The research estimated that the maximum settlement for spread/pad foundations is 25mm. The formula is important to assist the calculation of differential settlement of building foundations as a spring using the modulus of subgrade reaction approach. To cater tovariation in soil moisture content, the elastic foundation was considered by using modulus of subgrade constant at various soil settlement levels. Modulus of subgrade reaction approach has been applied by various researchers [26-29]. A linear elastic simulation modelling of a 3D structure was performed in this research. Other structural simulation models such as uniaxial phenomenological models [30], uniaxial rate-independent models [31], and multiple spring’s models [32] exist and are outside the scope of this research.
This paper presents research findings on the effect of variation in soil moisture content to soil deformation and subsequently to differential settlement of frame structures for soils in the Nairobi area and its environs. Behaviour of a building structure is assessed in terms of changes in shear forces, bending moment, and resulting differential settlement. The research output is beneficial to structural designers and construction industry stakeholders since all buildings are prone to changes in soil moisture content in their lifespan.
2. MATERIALS AND METHODS
2.1. Research Design
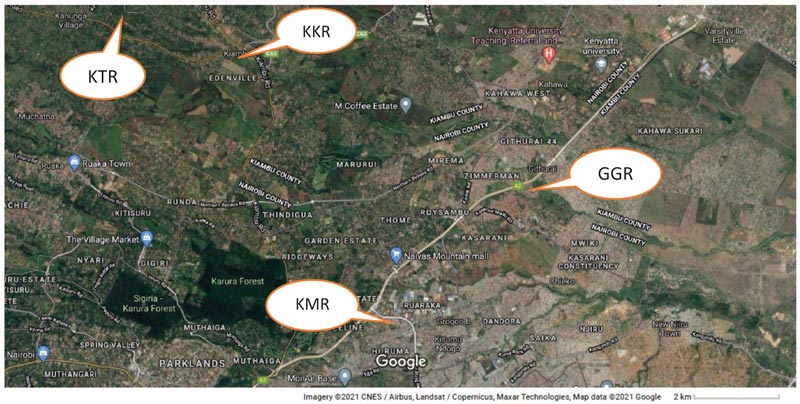
The research employed field assessment of soil samples, laboratory testing to determine the effect of moisture content on soil bearing capacity and modulus of subgrade constant, and modelling to assess structural stability and differential settlement of frame structures. Soil samples were collected from the Nairobi area and its environs at locations shown in Fig. (1). GPS location for the four sites are KRM site: 10 15’ 00.6”S360 52’39.9”E; GGR site: 10 11’58.8”S360 55’16.0”E; KKR site 10 10’44.8”S 360 50’14.1”E and KTR site: 10 10’14.4”S 360 49’32.4”E.
2.2. Materials and Equipment
Trial pits measuring 2m wide and 2m length with a target of 3m depth were excavated for soil samples collection in sites prone to moisture content variation, specifically near rivers and near swamps in four selected sites within Nairobi County and its environs. Samples were collected at 15m offset from the riverbank. Equipment for extraction of soil samples in the field included hoes, spades, ropes, and buckets. The collected soil samples were put in sample collection bags, sealed, carefully labelled, and transported to the laboratory for testing. At the laboratory, sieve analysis was carried out using dry sieves and hydrometer for the determination of particle size distribution [33]. Oven drying and weighting scale were used to determine the soil moisture content. Direct shear testing equipment was used to determine the soil cohesion (c) and angle of friction(ϕ) and Terzaghi’s equation was applied to determine the soil bearing capacity in accordance with BS 1377 Part 7 (1990): Shear strength tests [34].
2.3. Methods
Seven soil samples were collected from the subsequent sites in Nairobi and its environs; Kariobangi near Mathare River, Githurai near Gatharaine-Ngare River, Kiambu KIST near Riara River, and Kiambu Town near Riara River and mapped out as shown in Fig. (4). Disturbed and undisturbed soil samples were collected at 1.5m, 2.0m, 2.5m, and 3.0m depth as ground conditions permitted through manual excavation. Undisturbed samples were collected and tested for in-situ soil moisture content in accordance with BS Standard [33] and the corresponding soil consolidation was tested using oedometer equipment in accordance with BS Standard [34] and soil bearing capacity was determined through direct shear [34] and Terzaghi’s equation was applied [35]. The extent of soil moisture content was varied from 30%, 50%, and 75%, and also the corresponding variation in soil deformation and soil bearing capacity determined accordingly. Testing was done for non-flooded and flooded conditions. For flooded conditions, the soil sample was sequentially loaded up to 4kg during consolidation testing. The sample was then flooded with water and left for twenty-four hours. Loading of the flooded soil specimen continued the following day to cover a period of 24 hrs and the induced stress recorded until shear failure of the soil specimen occurred. Soil plasticity index testing was carried out in accordance with BS Standard [33] and liquid limit, plastic limit and plasticity index, and Atterberg Limit state for the 7 soil samples were determined. Data were analysed and interpretation was made.
Determination of the soil bearing capacity was carried out in accordance with [36, 37] BS 1377 Part 7 (1990): Shear strength tests. Seven soil samples at 30% moisture content (MC), 50% MC, and 75% MC were subjected to direct shear testing, giving outputs in terms of Cohesion (c) and angle of friction (ϕ) values for each sample under non-flooded and flooded condition. Terzaghi’s equation was used to compute the ultimate and allowable soil bearing capacity. Soil bearing capacity factors were also applied [35].
3. RESULTS AND DISCUSSION
3.1. Results on Field Assessment and Samples Collection Outcome
The collected seven soil samples were labelled based on the collection site and depth of the sample as follows;
a. Kariobangi site near Mathareriver at 1.5m depth (KMR1.5).
b. Githurai shopping area near Gatharaini-Ngareriver at 1.5m depth (GGR1.5).
c. Githurai shopping area near Gatharaini-Ngareriver at 2.0m depth (GGR2.0).
d. Githurai shopping area near Gatharaini-Ngareriver at 2.5m depth (GGR2.5).
e. Kiambu next to the Kiambu Institute of Science and Technology (KIST) near Riarariver at 1.5m depth (KKR1.5).
f. Kiambu next to KIST near Riarariver at 1.8m depth (KKR1.8).
g. Kiambu town near Riarariver at 1.5m(KTR1.5).
Soil samples were collected from the depth ranging from 1.5m to 2.5m below the ground level as ground permitted through manual excavation. Water seepage was encountered after 1.5m depth at the KMR site as well as the KTR site, thus stopping further trial pit excavation. The presence of rocks and boulders was found at the KKR site which led to the termination of trial pit excavation at 1.8m depth. Dumped materials were found at the GGR site which contributed to the termination of trial pit excavation at 2.5m depth.
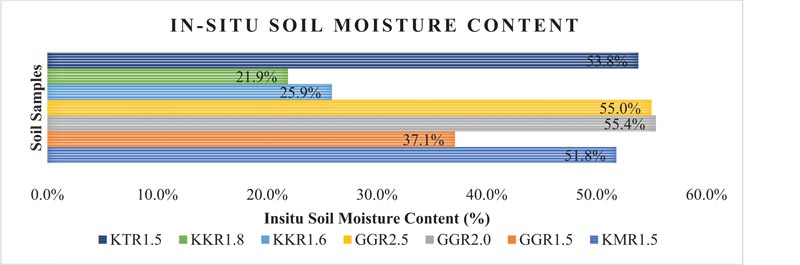
3.2. Results on In situ Moisture Content
Results on soil moisture content for samples as collected in the field (in situ) are shown in Fig. (2). Four (4) out of the 7 collected soil samples had an in-situ moisture content of over 50%. Sample KKR1.8 exhibited the lowest in-situ moisture content at 21.9% while sample GGR2.5 had the highest in-situ moisture content at 55.4%. This implies that engineers should consider soil moisture content of the soil during the design of foundations to ensure that adequate factor of safety is allowed at the design stage.
3.3. Results on Soil Deformation at 30%, 50%, and 75% Moisture Content (MC)
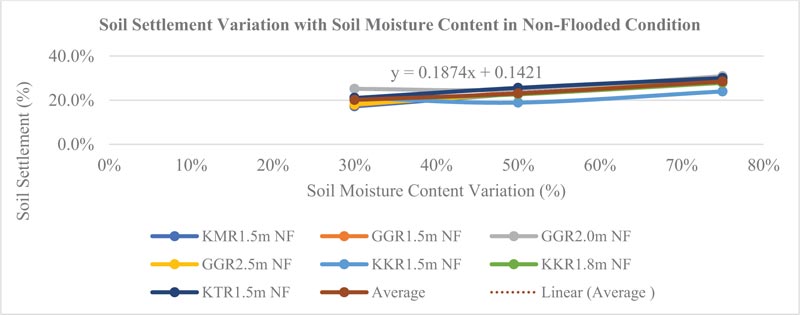
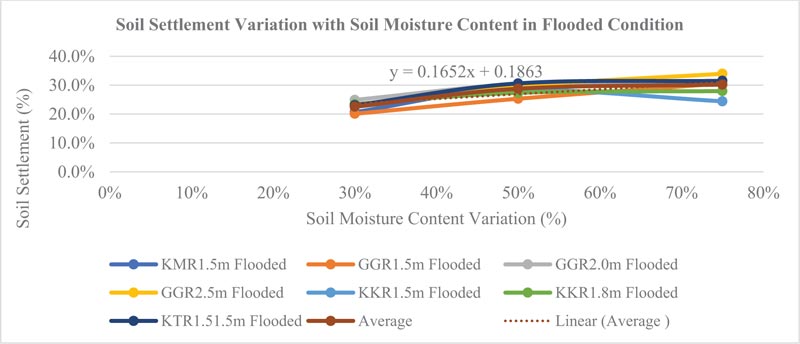
The results on soil deformation at 30%, 50%, and 75% moisture content variation are shown in Table 1 and presented in Figs. (3 and 4).
| Non-Flooded Condition | Extent of Soil Deformation (%) | |||
|---|---|---|---|---|
| Moisture content Variation (%) | 30% MC | 50% MC | 75% MC | |
| 1 | KMR1.5m NF | 17.2% | 23.0% | 29.4% |
| 2 | GGR1.5m NF | 17.8% | 23.6% | 28.6% |
| 3 | GGR2.0m NF | 25.2% | 24.9% | 30.9% |
| 4 | GGR2.5m NF | 18.2% | 23.0% | 28.7% |
| 5 | KKR1.5m NF | 21.2% | 18.9% | 24.0% |
| 6 | KKR1.8m NF | 20.4% | 22.7% | 27.9% |
| 7 | KTR1.5m NF | 21.0% | 25.6% | 30.1% |
| Average | 20.1% | 23.1% | 28.5% | |
| Flooded Condition | ||||
| Moisture content Variation (%) | 30% MC | 50% MC | 75% MC | |
| 1 | KMR1.5m Flooded | 20.7% | 29.7% | 31.5% |
| 2 | GGR1.5m Flooded | 20.1% | 25.3% | 30.6% |
| 3 | GGR2.0m Flooded | 24.9% | 30.3% | 31.5% |
| 4 | GGR2.5m Flooded | 23.3% | 29.7% | 34.0% |
| 5 | KKR1.5m Flooded | 22.5% | 28.4% | 24.4% |
| 6 | KKR1.8m Flooded | 23.5% | 27.4% | 28.0% |
| 7 | KTR1.51.5m Flooded | 23.0% | 30.6% | 31.5% |
| Average | 22.6% | 28.8% | 30.2% | |
The results indicate that on average the soil samples collected in the Nairobi area and environs deformed by 20.1%, 23.1%, and 28.5% in non-flooded conditions when subjected to an increase in moisture content at 30%, 50%, and 75% moisture content variation, respectively. Further, soil deformation increased by 22.6%, 28.8%, and 30.2% in flooded conditions when the soil moisture content varied to 30%, 50%, and 75%, respectively. The trends were positive in both non-flooded and flooded cases as illustrated by equations y = 0.1874x + 0.1421 and y = 0.1652x + 0.1863, respectively where y is the percentage of soil deformation while x is the percentage of soil moisture content.
A majority 86% of tested soil samples (6 out of 7 soil samples) depicted an increase in soil deformation when subjected to the flooded condition compared to the non-flooded condition as shown in Table 5. This implies that an immediate increase in water level in a foundation within 24 hours after the commencement of sample loading results in increased deformation. This is attributed to the presence of water between soil particles thus reducing the soil resistance when subjected to axial loading. This is in line with Onyancha’s findings that observed that settlement of soils in the Nairobi area was higher in flooded conditions than in unflooded conditions [10]. There is a significant reduction in foundation height and it would lead to remarkable alteration of a building structure alignment due to differential settlement and may affect the structural integrity of a building.
3.4. Results on Soil Bearing Capacity using Direct Shear Method
Determination of the soil bearing capacity was carried out in accordance to BS 1377 Part 7 (1990): Shear strength tests, giving outputs in terms of Cohesion (c) and angle of friction (ϕ) values, and Terzaghi’s equation was used to compute the ultimate and allowable soil bearing capacity. Soil bearing capacity factors were applied [35]. The results on soil ultimate bearing capacities are shown in Table 2.
It is noted that 6 out of the 7 soil samples tested under non-flooded conditions registered the highest soil bearing capacity at 30% moisture content compared with the same sample at 50% and 75% moisture content variation. This accounts for 85.7% of the samples tested. The reduction of soil bearing capacity with an increase in moisture content was more dramatic than the increased soil deformation. This confirms that an increase in soil moisture content contributed to the reduction of soil bearing capacity. It affirms that the presence of a water table near a foundation significantly affects the foundation’s load-bearing capacity and settlement, among other things (Braja, 2011). The results confirm that the presence of water in the soil can substantially reduce the bearing pressure in granular soils (Al-agha, 2015). For flooded condition samples, 4 out of 7 tested soil samples exhibited the highest soil bearing capacity at 30% moisture content compared with the same samples at 50% and 75% moisture content variation. Out of all the 7 soil samples tested under flooded and non-flooded conditions, it is observed that the soil bearing capacity is highest at 30% moisture content followed by samples at 50% moisture content, followed by 75% moisture variation as shown by the average section in the figure above. One out of 7 soil samples in non-flooded conditions and 3 out of 7 soil samples in flooded conditions did not depict the lowest soil bearing capacity at 30% moisture content. This is attributed to the heterogeneous nature of the soil, chemical constituent in the soil, and non-uniform soil profile in a given region.
The dramatic reduction in soil bearing capacity with an increase in soil moisture content implies that engineers at the design stage should allow for adequate moisture variation for buildings in areas prone to significant changes in moisture content such as rainy tropical areas and areas near rivers and swamps. Similarly, soil bearing capacity figures obtained from soil testing at the design stage should consider the moisture content in the soil and the appropriate adjustment made to take care of potential future changes in moisture content. Engineers should consider the heterogeneous nature of the soil, thus allowing soil variation on site compared with the sample's trial pits.
3.5. Structural Modelling and Analysis of Differential Settlement
3.5.1. Overview of structural modelling and scenarios analysed
A 3-bay 4-storey residential building was analysed and modelled using Staad Pro software. Foundation supports were modelled in 4 case scenarios based on the average soil deformation at 30%, 50%, and 75% moisture content as well as two control case scenarios.
| a) Non-Flooded Condition | ||||
|---|---|---|---|---|
| Samples Description | At 30% MC | At 50%MC | At 75%MC |
Percentage reduction in soil bearing capacity when the soil moisture content increased from 30% to 75%. |
| KMR1.5m NF | 240.60 | 94.55 | 63.84 | 376.9% |
| GGR1.5m NF | 711.91 | 75.36 | 81.54 | 873.0% |
| GGR2.0m NF | 215.05 | 65.68 | 86.72 | 248.0% |
| GGR2.5m NF | 240.28 | 104.59 | 81.68 | 294.2% |
| KKR1.5m NF | 1075.76 | 118.00 | 56.26 | 1912.1% |
| KKR1.8m NF | 176.56 | 278.08 | 79.53 | 222.0% |
| KKR1.5m NF | 371.58 | 332.65 | 81.00 | 458.7% |
| Average | 433.11 | 152.70 | 75.80 | 571.4% |
| b) Flooded Condition | ||||
| Samples Description | At 30% MC | At 50%MC | At 75%MC | |
| KMR1.5m Flooded | 284.07 | 296.60 | 45.39 | 625.8% |
| GGR1.5m Flooded | 424.42 | 440.57 | 55.75 | 761.3% |
| GGR2.0m Flooded | 264.48 | 150.16 | 71.02 | 372.4% |
| GGR2.5m Flooded | 366.02 | 60.82 | 55.56 | 658.8% |
| KKR1.5m Flooded | 893.77 | 257.90 | 65.72 | 1360.0% |
| KKR1.8m Flooded | 68.80 | 290.94 | 58.59 | 117.4% |
| KKR1.5m Flooded | 395.85 | 162.74 | 61.56 | 643.1% |
| Average | 385.34 | 237.10 | 59.08 | 652.2% |
Soil bearing capacity results obtained from the laboratory were analysed using Terzaghi’s equation as follows;
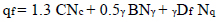 |
(1) |
where,
qf = ultimate bearing capacity
1.3 = factor for square pad foundation
C = undrained cohesion of soil
B = width of foundation
D = depth of foundation
γ = density of soil underneath the foundation level
Nc, Nγand Nq= bearing capacity factors
The applied bearing capacity factors were obtained from existing tables [35]. Modelling the soil deformation to determine building settlement under the elastic foundation was done by applying the modulus of subgrade reaction constant [26, 27, 29].
 |
(2) |
Where,
k = modulus of subgrade reaction constant
q = mean soil bearing capacity (kN/mm2)
δ = mean settlement (mm)
This is the use of an indirect method of approximate estimation of the value of modulus of subgrade reaction and subsequent spring constant for consideration on foundation settlement. Bowles [26,27] assumed that the net ultimate bearing capacity of a footing occurs at a settlement of 25 mm and the spring constant is derived from the ultimate bearing pressure magnitude of soil settlement as shown in the following formula.
 |
(3) |
Where qf is the ultimate soil bearing capacity.
After applying equation 3 to the soil settlement values obtained from the laboratory test results, soil bearing capacity (kN/m2) and resultant modulus of subgrade reaction constant for the 7 soil samples are shown in Table 3. The average modulus of subgrade reaction constant obtained at 30%, 50%, and 75% moisture content was applied in structural modelling of the frame structure.
| Soil Settlement (mm) for soils with varying moisture content. | Soil settlement (mm) (computed assuming footing depth of 500mm) | Soil Bearing Capacity (kN/mm2) | Modulus of subgrade reaction(k)(assuming footing depth of 500m and resultant settlement) | |||||||||
|---|---|---|---|---|---|---|---|---|---|---|---|---|
| Moisture content (%) | 30% MC |
50% MC |
75% MC |
30% MC |
50% MC |
75%MC | 30% MC |
50% MC |
75% MC |
30% MC |
50% MC |
75% MC |
| KMR1.5m NF | 17.2% | 21.5% | 29.4% | 86 | 107 | 147 | 240.60 | 94.55 | 63.84 | 2,798 | 882 | 434 |
| KMR1.5m Flooded | 20.7% | 27.2% | 31.5% | 103 | 136 | 157 | 284.07 | 296.60 | 45.39 | 2,751 | 2,185 | 289 |
| GGR1.5m NF | 17.8% | 23.6% | 28.6% | 89 | 118 | 143 | 711.91 | 75.36 | 81.54 | 7,999 | 640 | 570 |
| GGR1.5m Flooded | 20.1% | 25.3% | 30.6% | 101 | 127 | 153 | 424.42 | 440.57 | 55.75 | 4,223 | 3,483 | 364 |
| GGR2.0m NF | 21.1% | 24.9% | 30.9% | 106 | 125 | 155 | 215.05 | 65.68 | 86.72 | 2,038 | 528 | 561 |
| GGR2.0m Flooded | 24.9% | 30.3% | 31.5% | 125 | 152 | 158 | 264.48 | 150.16 | 71.02 | 2,124 | 991 | 451 |
| GGR2.5m NF | 18.2% | 23.0% | 28.7% | 91 | 115 | 144 | 240.28 | 104.59 | 81.68 | 2,648 | 911 | 569 |
| GGR2.5m Flooded | 23.3% | 29.7% | 34.0% | 116 | 149 | 170 | 366.02 | 60.82 | 55.56 | 3,149 | 410 | 327 |
| KKR1.5m NF | 21.2% | 18.9% | 24.0% | 106 | 95 | 120 | 1075.76 | 118.00 | 56.26 | 10,173 | 1,249 | 470 |
| KKR1.5m Flooded | 22.5% | 28.4% | 24.4% | 113 | 142 | 122 | 893.77 | 257.90 | 65.72 | 7,945 | 1,819 | 539 |
| KKR1.8m NF | 20.4% | 22.7% | 27.9% | 102 | 113 | 139 | 176.56 | 278.08 | 79.53 | 1,735 | 2,455 | 571 |
| KKR1.8m Flooded | 23.5% | 27.4% | 28.0% | 117 | 137 | 140 | 68.80 | 290.94 | 58.59 | 587 | 2,128 | 419 |
| KKR1.5m NF | 21.0% | 25.6% | 30.1% | 105 | 128 | 150 | 371.58 | 332.65 | 81.00 | 3,539 | 2,599 | 539 |
| KKR1.5m Flooded | 23.0% | 30.6% | 31.5% | 115 | 153 | 158 | 395.85 | 162.74 | 61.56 | 3,442 | 1,064 | 391 |
| Average | 21.0% | 25.6% | 29.3% | 105 | 128 | 147 | 240.60 | 94.55 | 63.84 | 3,889 | 1,521 | 460 |
| Rounded off to | 3,990 | 1,520 | 460 | |||||||||
Reinforced concrete frame structure features included 450x200mm beam members, 200x200mm column members, and 1500x1500x500mm column bases. Dead loads, live load, and plate load were applied as follows.
i) Dead load
a) Self-weight of floor slabs = 0.15x24 = 3.6 kN/m2
b) Weight of 100mm floor screed = 0.1x24 =2.4 kN/m2
c) Allow for 25mm thick floor tiles = 0.025x11 =0.275 kN/m2
Total Dead load = 6.275 kN/m2, say 6.3 kN/m2
d) Dead load of wall (200 mm thick) = 3 x 0.2 x 22 = 13.2 kN/m
e) Dead load of 25mm plaster on wall = 2 x 0.025 x 20 x 3.5 = 3.5 kN/m
Total wall load = 16.7kN/m
ii) Imposed load
a) Ref BS 6399: Part 1: 1996 Loading for buildings, Part 1. Code of practice for dead and imposed loads)
b) Imposed loading = 1.5kN/m2 for self-contained dwellings.
iii) Primary loading combination: DL = Dead Load and LL = Live Load
iv) Ultimate Load Combination:UL = 1.4 DL+ 1.6 LL
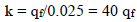
The frame structure layout was comprised of 4x4 columns, each column spaced at 5m centre to centre. The floor to floor height was 3m. Column base size of 1.5x1.5x0.5m length, width, and depth, respectively, were applied. Scenarios involving the variation of foundation support applied for structural modelling of four storey reinforced concrete frame structure are as follows;
i. Scenario 1: Fixed support
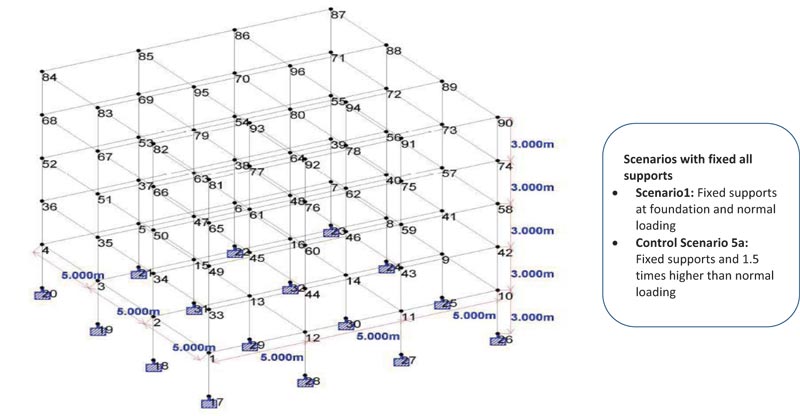
ii. Scenario 2: Foundation footing support with a line of outer columns subjected to the modulus of subgrade reaction constant (k) of 3990 derived from soil settlement at 30% MC laboratory test results
iii. Scenario 3: Foundation footing support with a line of outer columns subjected modulus of subgrade reaction constant (k) of 1520 derived from soil settlement at 50% MC laboratory test results
iv. Scenario 4: Foundation footing support with a line of outer columns subjected modulus of subgrade reaction constant (k) of 460 derived from soil settlement at 75% MC laboratory test results
v. Control case 5a: Fixed support with loading at 1.5 times the normal loading for strength resistance of the building structure
vi. Control case 5b: Foundation footing support using 25mm foundation settlement recommended by Bowles [26] [27]
The control case scenario looked at the worst-case scenario beyond which the structure will not withstand the excessive loading and differential settlement and it would result in structural failure. The scenarios are illustrated in Figs. (5, 6 and 7).
Results from structural modelling are shown below.
3.5.2. Scenario 1: Case of Fixed Supports under Normal Loading
Results for shear forces, bending moments, beam stresses, nodes displacement, and support reactions for reinforced concrete frame structure with fixed supports subjected to normal loading without variation in soil moisture content at the foundation supports are shown in Table 4.
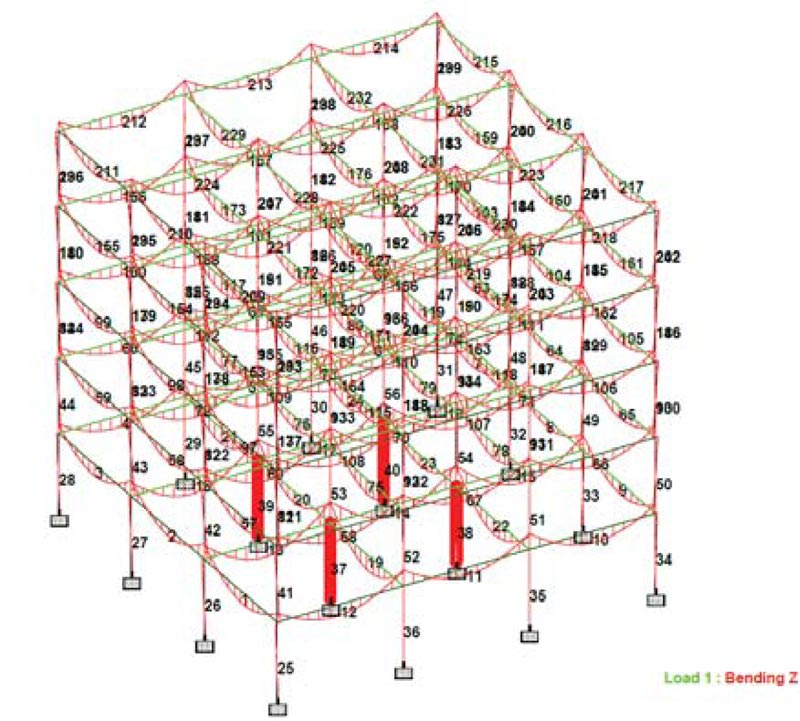
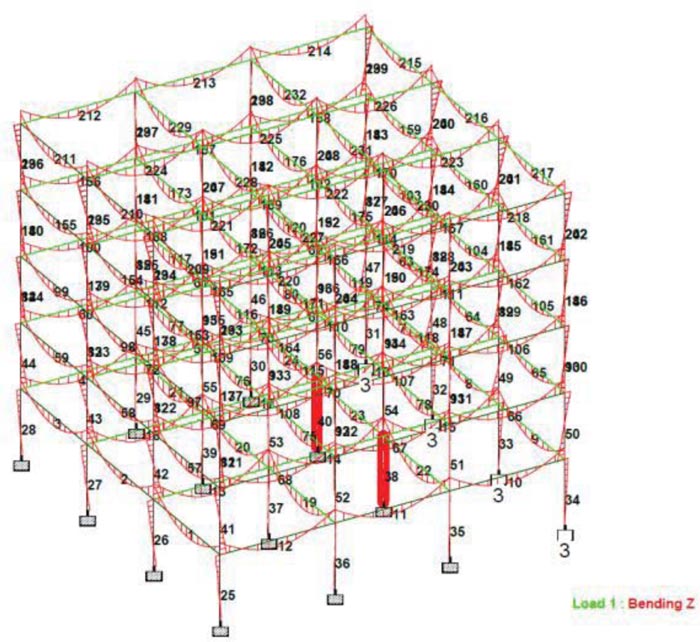
The maximum axial load (shear forces Fx) for the frame structure occurred on interior columns member no.37, 38, 39, and 40 on the ground floor and amounted to 2853.09kN, as shown in Table 4 and illustrated in Fig. (7). The maximum bending moment Mz occurred on horizontal internal beam member no. 165, 167, 168, and 170 at 3rdfloor amounting to 94.727kN/m, as shown in Table 4 and Fig. (8).
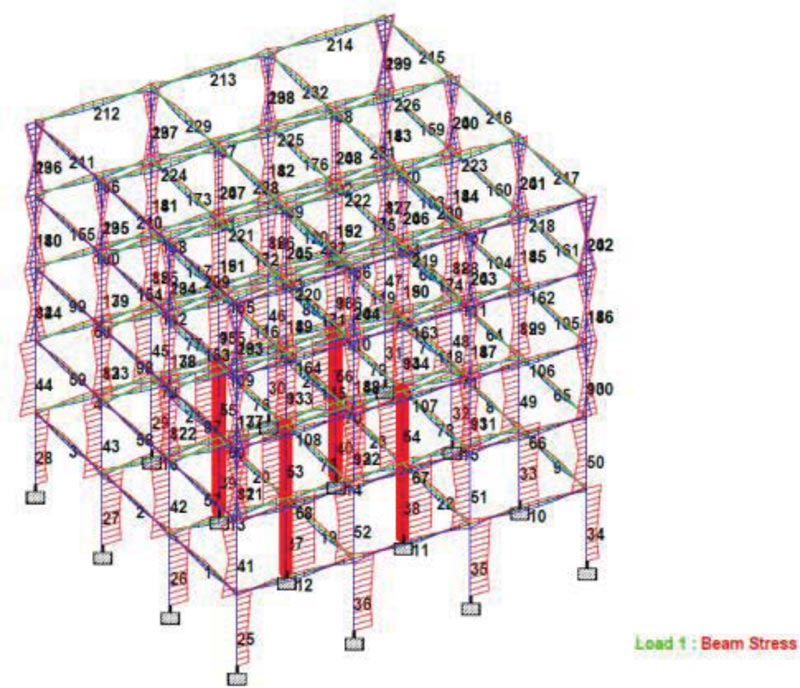
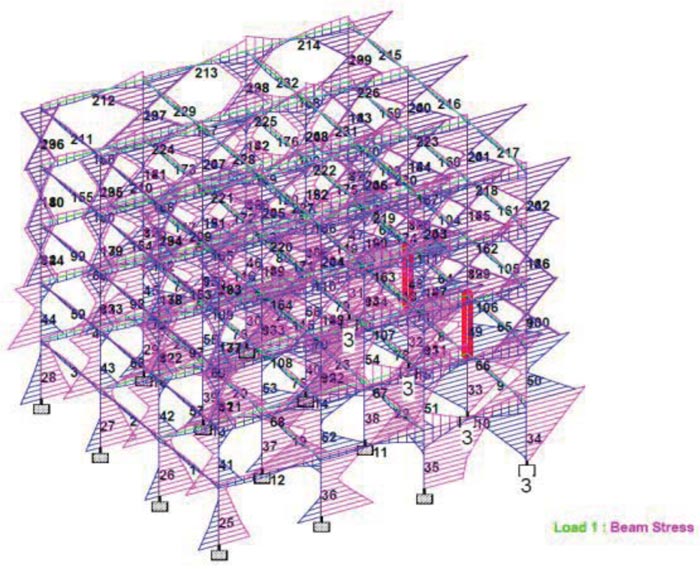
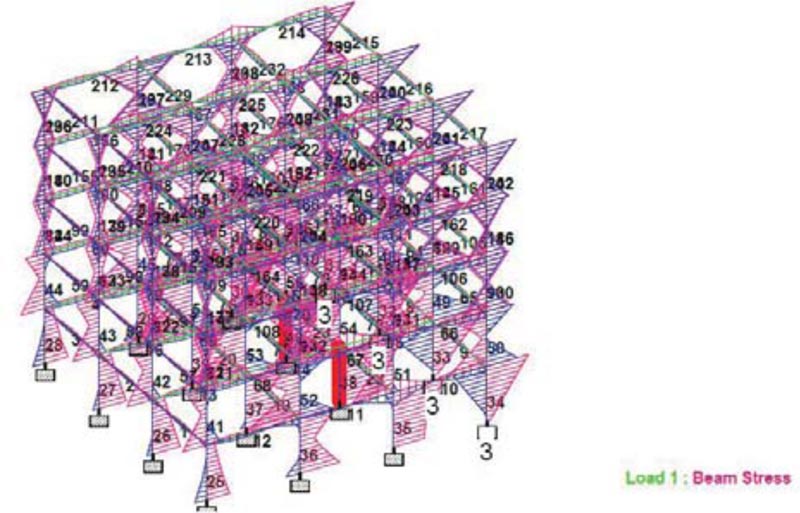
The maximum compressive stresses occurred on the internal column members 37, 38, 39, and 40 on the ground floor, as shown in Fig. (9), amounting to 71.99kN/mm2. The maximum tensile stress occurred at 4th-floor corner columns, as shown in Fig. (10), and amounted to 32.82kN/mm2.
| Beam | Load case | Node | Fx (kN) | Fy (kN) | Fx (kN) | Mx (kN-M) | My (kN-M) | Mz (kN-M) | |
|---|---|---|---|---|---|---|---|---|---|
| Max Fx | 37 | 1 DL | 29 | 2853.091 | -0.028 | -0.856 | 0 | -0.85 | 0.04 |
| Min Fx | 158 | 1 DL | 70 | -2.867 | 65.253 | 0.008 | 0.335 | -0.015 | 51.36 |
| Max Fy | 168 | 1 DL | 67 | -1.953 | 94.224 | -0.002 | -0.117 | 0.004 | 94.727 |
| Min Fy | 170 | 1 DL | 72 | -1.953 | -94.224 | 0.002 | 0.117 | 0.004 | 94.727 |
| Max Fz | 243 | 1 DL | 91 | 139.505 | 3.163 | 12.546 | 0.009 | -20.098 | 4.872 |
| Min Fz | 203 | 1 DL | 75 | 198.511 | 3.163 | -12.546 | 0.009 | 17.54 | 4.616 |
| Max Mx | 214 | 1 DL | 86 | 7.162 | 67.851 | -0.018 | 0.442 | 0.038 | 55.564 |
| Min Mx | 218 | 1 DL | 90 | 7.162 | 69.868 | 0.018 | -0.442 | -0.055 | 60.608 |
| Max My | 197 | 1 DL | 85 | 139.505 | -3.163 | 12.546 | 0.009 | 20.098 | 4.872 |
| Min My | 203 | 1 DL | 91 | 139.505 | 3.163 | -12.546 | 0.009 | -20.098 | -4.872 |
| Max Mz | 170 | 1 DL | 72 | -1.953 | -94.224 | 0.002 | 0.117 | 0.004 | 94.727 |
| Min Mz | 200 | 1 DL | 88 | 149.609 | 25.058 | 0.376 | -0.006 | 0.306 | -43.159 |

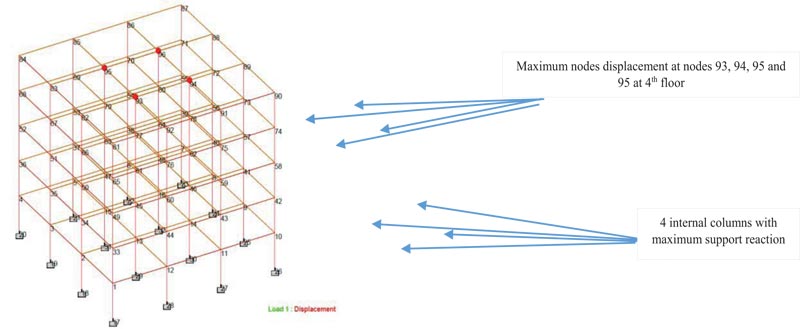
The maximum node displacement in the y-direction occurred at 4th floor internal columns at nodes 93, 94,95, and 96 and amounted to -10.405mm, as shown in Table 5 and Fig. (11). The differential settlement at all the 16 fixed supports was zero, as shown in Table 6. This implies that fixed supports foundation and the underlying foundation soil are able to absorb and neutralise the differential settlement from the structure. The maximum support reaction was occurred at internal column members at nodes 29, 30, 31, and 32 and amounted to 2853.09kN, as shown in Fig. (11).
| Beam |
Load case |
Horizontal X (mm) | Vertical Y (mm) | Horizontal Z (mm) | Resultant (mm) | Rotational rx rad | Rotational ry (rad) | Rotational rz (rad) | |
|---|---|---|---|---|---|---|---|---|---|
| Max X | 84 | 1 DL | 0.028 | -4.779 | 0.007 | 4.779 | 0.001 | -0.000 | -0.001 |
| Min X | 90 | 1 DL | -0.028 | -4.779 | -0.007 | 4.779 | -0.001 | -0.000 | 0.001 |
| Max Y | 17 | 1 DL | 0.000 | 0.000 | 0.000 | 0.000 | 0.000 | 0.000 | 0.000 |
| Min Y | 93 | 1 DL | 0.009 | -10.405 | -0.003 | 10.405 | -0.000 | 0.000 | -0.000 |
| Max Z | 87 | 1 DL | -0.028 | -4.779 | 0.007 | 4.779 | 0.001 | 0.000 | 0.001 |
| Min Z | 81 | 1 DL | 0.028 | -4.779 | -0.007 | 4.779 | -0.001 | 0.000 | -0.001 |
| Max rX | 86 | 1 DL | -0.009 | -6.836 | 0.006 | 6.836 | 0.002 | 0.000 | 0.000 |
| Min rX | 91 | 1 DL | -0.009 | -6.836 | -0.006 | 6.836 | -0.002 | -0.000 | 0.000 |
| Max rY | 87 | 1 DL | -0.028 | -4.779 | 0.007 | 4.779 | 0.001 | 0.000 | 0.001 |
| Min rY | 90 | 1 DL | -0.028 | -4.779 | -0.007 | 4.779 | -0.001 | -0.000 | 0.001 |
| Max rZ | 88 | 1 DL | -0.022 | -7.202 | 0.003 | 7.202 | -0.000 | 0.000 | 0.001 |
| Min rZ | 83 | 1 DL | 0.022 | -7.202 | 0.003 | 7.202 | -0.000 | -0.000 | -0.001 |
| Max Rst | 93 | 1 DL | 0.009 | -10.405 | -0.003 | 10.405 | -0.000 | 0.000 | -0.000 |
| Beam | Load case | Horizontal X (mm) | Vertical Y (mm) | Horizontal Z (mm) | Resultant (mm) | rx rad | ryrad | rz rad |
|---|---|---|---|---|---|---|---|---|
| 1 | 1 DL | -0.006 | -1.964 | 0.002 | 1.964 | -0.001 | 0 | 0 |
| 2 | 1 DL | -0.005 | -2.976 | 0.001 | 2.976 | 0 | 0 | -0.001 |
| 3 | 1 DL | -0.005 | -2.976 | -0.001 | 2.976 | 0 | 0 | -0.001 |
| 4 | 1 DL | -0.006 | -1.964 | -0.002 | 1.964 | 0.001 | 0 | 0 |
| 5 | 1 DL | -0.002 | -2.827 | -0.002 | 2.827 | 0.001 | 0 | 0 |
| 6 | 1 DL | 0.002 | -2.827 | -0.002 | 2.827 | 0.001 | 0 | 0 |
| 7 | 1 DL | 0.006 | -1.964 | -0.002 | 1.964 | 0.001 | 0 | 0 |
| 8 | 1 DL | 0.005 | -2.976 | -0.001 | 2.976 | 0 | 0 | 0.001 |
| 9 | 1 DL | 0.005 | -2.976 | 0.001 | 2.976 | 0 | 0 | 0.001 |
| 10 | 1 DL | 0.006 | -1.964 | 0.002 | 1.964 | -0.001 | 0 | 0 |
| 11 | 1 DL | 0.002 | -2.827 | 0.002 | 2.827 | -0.001 | 0 | 0 |
| 12 | 1 DL | -0.002 | -2.827 | 0.002 | 2.827 | -0.001 | 0 | 0 |
| 13 | 1 DL | -0.002 | -4.334 | 0.001 | 4.334 | 0 | 0 | 0 |
| 14 | 1 DL | 0.002 | -4.334 | 0.001 | 4.334 | 0 | 0 | 0 |
| 15 | 1 DL | -0.002 | -4.334 | -0.001 | 4.334 | 0 | 0 | 0 |
| 16 | 1 DL | 0.002 | -4.334 | -0.001 | 4.334 | 0 | 0 | 0 |
| 17 | 1 DL | 0 | 0 | 0 | 0 | 0 | 0 | 0 |
| 18 | 1 DL | 0 | 0 | 0 | 0 | 0 | 0 | 0 |
| 19 | 1 DL | 0 | 0 | 0 | 0 | 0 | 0 | 0 |
| 20 | 1 DL | 0 | 0 | 0 | 0 | 0 | 0 | 0 |
| 21 | 1 DL | 0 | 0 | 0 | 0 | 0 | 0 | 0 |
| 22 | 1 DL | 0 | 0 | 0 | 0 | 0 | 0 | 0 |
| 23 | 1 DL | 0 | 0 | 0 | 0 | 0 | 0 | 0 |
| 24 | 1 DL | 0 | 0 | 0 | 0 | 0 | 0 | 0 |
| 25 | 1 DL | 0 | 0 | 0 | 0 | 0 | 0 | 0 |
| 26 | 1 DL | 0 | 0 | 0 | 0 | 0 | 0 | 0 |
| 27 | 1 DL | 0 | 0 | 0 | 0 | 0 | 0 | 0 |
| 28 | 1 DL | 0 | 0 | 0 | 0 | 0 | 0 | 0 |
| 29 | 1 DL | 0 | 0 | 0 | 0 | 0 | 0 | 0 |
| 30 | 1 DL | 0 | 0 | 0 | 0 | 0 | 0 | 0 |
| 31 | 1 DL | 0 | 0 | 0 | 0 | 0 | 0 | 0 |
| 32 | 1 DL | 0 | 0 | 0 | 0 | 0 | 0 | 0 |
3.5.3. Scenario 2: Case of Foundation Supports with Modulus of Subgrade Reaction Constant k=3990 for Soil Settlement at 30% Moisture Content
Four outer columns (nodes 23, 24, 25, and 26) out of the 16 columns for the modelled four-storey reinforced concrete frame structure were subjected to foundation settlement adjustment using modulus of subgrade reaction constant (k) of 3990 for the average soil sample tested at 30% moisture content variation. Twelve (12) columns were modelled as fixed support and no adjustment to the modulus of subgrade reaction constant was applied to them, as illustrated in Fig. (6) for Scenario 2. Results for shear force and bending moments are shown in Table 7.
The maximum axial loads (shear forces) for the frame structure occurred at internal column member nos. 38 and 40 and amounted to3854.405kN, as illustrated in Fig. (12). This occurred at ground floor columns located just next to the external columns subjected to foundation support settlement arising from soil deformation induced by 30% soil moisture content variation. The maximum shear forces recorded in Scenario 2 (3854.405kN) were higher than the maximum shear forces recorded in Scenario 1, a case of all fixed support without settlement adjustment (2853.09kN). Similarly, the distribution of shear forces in the structure varied from Scenario 1, where shear forces were uniformly distributed among the interior four columns. In Scenario 2, shear forces were highest at the ground floor’s two internal columns nearer foundation footings that were subjected to the modulus of subgrade reaction constant at 30% MC.
| Beam | Load case | Node | Fx (kN) | Fy (kN) | Fz(kN) | Mx (kN-M) | My (kN-M) | Mz (kN-M) | |
|---|---|---|---|---|---|---|---|---|---|
| Max Fx | 38 | 1 DL | 30 | 3854.405 | -34.31 | -1.250 | 0.004 | -1.241 | -5.809 |
| Min Fx | 213 | 1 DL | 85 | -37.632 | 30.94 | -0.028 | -2.547 | 0.128 | -13.978 |
| Max Fy | 114 | 1 DL | 64 | -2.84 | 167.918 | 0.002 | -0.893 | -0.004 | 285.048 |
| Min Fy | 10 | 1 DL | 11 | 7.663 | -139.26 | 0.035 | -2.187 | 0.066 | 244.675 |
| Max Fz | 46 | 1 DL | 6 | 1892.694 | -29.085 | 24.371 | 0.001 | -37.233 | -44.906 |
| Min Fz | 51 | 1 DL | 11 | 1892.695 | -29.085 | -24.371 | -0.001 | 37.233 | -44.906 |
| Max Mx | 11 | 1 DL | 11 | 9.693 | 107.4 | -0.008 | 2.81 | 0.004 | 180.782 |
| Min Mx | 5 | 1 DL | 5 | 9.693 | 30.318 | 0.008 | -2.81 | -0.035 | -11.924 |
| Max My | 198 | 1 DL | 86 | 214.421 | -22.364 | 24.053 | 0.052 | 37.88 | 37.638 |
| Min My | 203 | 1 DL | 91 | 214.422 | -22.364 | -24.053 | -0.052 | -37.88 | 37.638 |
| Max Mz | 15 | 1 DL | 14 | 6.529 | 166.772 | 0.007 | 1.829 | -0.013 | 289.806 |
| Min Mz | 49 | 1 DL | 9 | 435.61 | -109.607 | -7.115 | -0.001 | 10.743 | -178.878 |
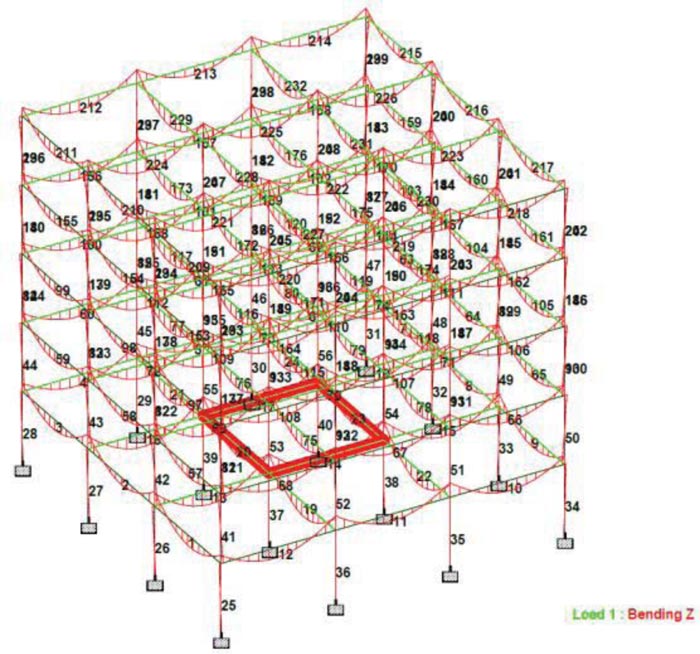
The maximum bending moment Mz of 289.806kN/m occurred on the horizontal internal beam members 15 and 18 located on the ground floor adjacent to support which was subjected to settlement from the resultant modulus of subgrade constant, as shown in Fig. (13). The maximum bending moment recorded in this case of Scenario 2 (289.806kN/m) was higher than the maximum bending moment recorded under Scenario 1, a case all fixed supports without nodes settlement in foundation (94.727kN/m). This trend was also observed for the negative moments for the frame structure. Whereas the maximum bending moments wereuniformly distributed in the four internal horizontal fourth-floor beams for Scenario 1, and Scenario 2 showed that maximum bending moments occurred in the internal horizontal ground floor beams adjacent to the columns whose foundation support was subjected to settlement caused by variation in soil moisture content. Moment distribution was thus affected by changes in foundation condition arising from the resultant soil settlement when subgrade modulus of reaction constant at 30% moisture content variation was applied. This trend was also observed for the negative moments for the frame structure.
The maximum compressive stresses of 179.582kN/mm2 occurred on the internal columns on the ground floor at members 38 and 30 which were located adjacent to the columns whose foundation was subjected to settlement arising from subgrade modulus constant at 30% MC, as illustrated in Fig. (14). The maximum tensile stress of 131.325kN/mm2 occurred at members 38 and 40, as illustrated in Fig. (15). It is observed that the maximum compressive and tensile stresses for the frame structure with subgrade modulus reaction constant adjustment at 30% MC were higher (179.582 kN/mm2 and 131.325 kN/mm2) than that of frame structure with fixed support (71.99kN/mm2 and -32.823 kN/mm2), respectively. This implies that soil deformation contributed by variation of soil moisture content affects stress distribution and stability of a building structure.
The maximum vertical node displacement in the y-direction occurred in member nos. 88 and 89 which were located on the topmost nodes of the middle external columns whose foundation was subjected to settlement at 30% moisture content variation amounting to -63.032 mm in y-direction. The maximum support settlement occurred at supports nos. 24 and 25 amounting to -61.013 mm in the vertical direction and was followed by the adjacent corner columns namely no. 23 and 26 amounting to -50.902 mm, as shown in Fig. (16). The 12 columns with fixed supports recorded zero vertical displacement at the foundation implying that there was no differential settlement in such cases. Vertical displacement occurred at supports whose foundation soil was subjected to variation in moisture content.

The maximum support reaction occurred at support 30 and 32 amounting to 3854.45 kN, as illustrated in Fig. (16). The support reaction observed in Scenario 2 (3854.45 kN) is higher than the fixed supports in Scenario 1 (2464 kN). This implies that differential settlement due to soil deformation at 30% variation of soil moisture content contributed to changes in support reaction alignment of the support reaction in the reinforced concrete structure. Differential settlement in a line of 4 columns led to an increase in support reaction for the adjacent fixed foundation supports by 15.7%.
Results for Scenarios 3, 4, 5a, and 5b together with a summary of Scenarios 1 and 2 are summarised in the following section.

3.5.4. Summary of Structural Modelling Outcome for 4 Foundation Support Cases and 2 Control Cases
3.5.4.1. Shear Forces
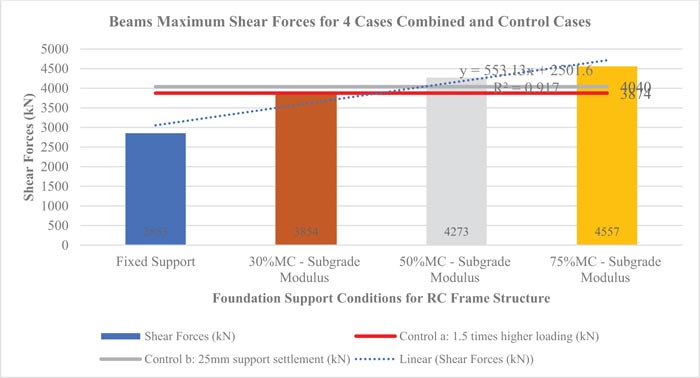
The trend on the maximum shear forces in the frame structure for Scenarios 1, 2, 3, 4, 5a, and 5b was evaluated and results are illustrated in Fig. (17). Variation in soil moisture content from 30% to 75% led to an increase in shear forces in the structure by up to 18.2%, thereby exceeding the two control cases i.e. scenarios 5a and 5b. This affirms the findings of Jaiswal [36] that even a small amount of differential settlement can cause a redistribution of forces in the superstructure. An increase in shear forces beyond two control cases would lead to structural failure unless realistic differential settlement for specific sites is considered and factored in at the design stage. For soil samples collected in the Nairobi area and its environs, the shear forces at 50% and 75% soil moisture content variation exceeded the two control cases implying that it would lead to structural failure.
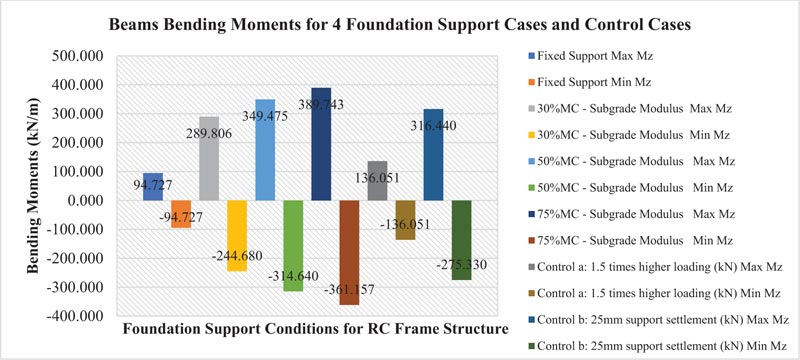
3.5.4.2. Bending Moments
Fig. (18) shows that the overall bending moments in the frame structure generally increases from fixed support at normal loading in scenario 1 to the case of increase in soil moisture content from 30% to 75% in scenario 2 and 3, respectively. Bending moments increased by 34.5% when the soil moisture content increased from 30% to 75%.
Bending moments of the structure (MS) at 50% and 75% soil moisture content in scenario 2 and 3, respectively, exceeded bending moments for the control cases in scenario 5a due to increasing structure loading by a factor of 1.5 and scenario 5b due to application of 25mm foundation settlement used in practice. An increase in soil moisture content and the resultant increase in bending moment negatively affect the stability of the building, thus compromising its structural integrity. Variation of soil moisture content to 50% and 75% resulted in an increase in the maximum bending moment beyond the two control cases implying that the frame structure lacks the capacity to resist such high bending moments and would result in structural failure. The soil moisture content of less than 50% may withstand the differential settlement without collapse due to the building resistance in the structure.
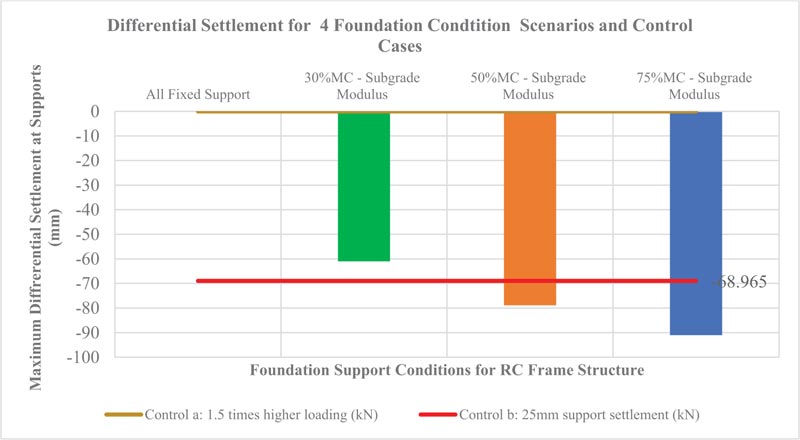
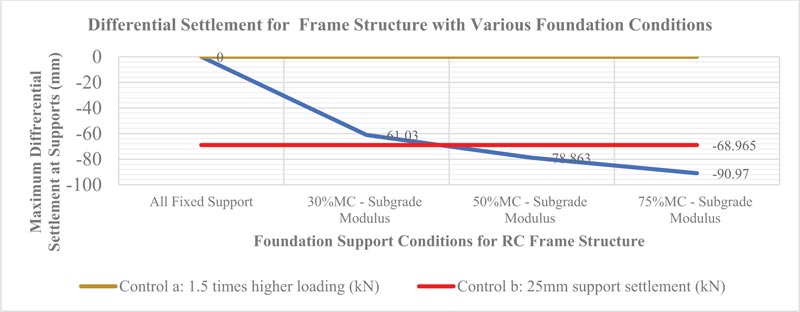
3.5.4.3. Differential Settlement illustrated by Supports Displacement
Differential settlement in the frame structure is determined as the difference between the maximum and the minimum vertical displacement at foundation supports in the building. For Scenarios 2, 3, 4, and 5b, the maximum differential settlement in the structure occurred at the supports whose foundation soil was subjected to soil deformation arising from variation in soil moisture content. Scenarios 1 and 5b yielded nil supports settlement, as summarised in Fig. (19). The soil deformation emanating from increasing soil moisture content from 30% to 75% increased the foundation differential settlement by 49.1%. With reference to control cases, it is observed that increasing soil moisture content to 50% and above would exceed the two control cases hence would lead to structural instability resulting in structural failure of the building. Lamb [4] noted that unequal settlements of footing in compressible clay soils very often result in damage to inflexible structural and architectural materials and this is also confirmed by this research. This research recommends a maximum of 68.9 mm supports settlement to guarantee structural stability. This compares with Onyancha’s study recommendation for 40 to 80 mm minimum total settlement of under-footings to guarantee structural stability of buildings [11].
3.5.4.4. Compressive Stresses
The maximum compressive stresses in members of the reinforced concrete frame structure for the 4 foundation support cases due to variation in soil moisture content and 2 control cases are shown in Fig. (20).
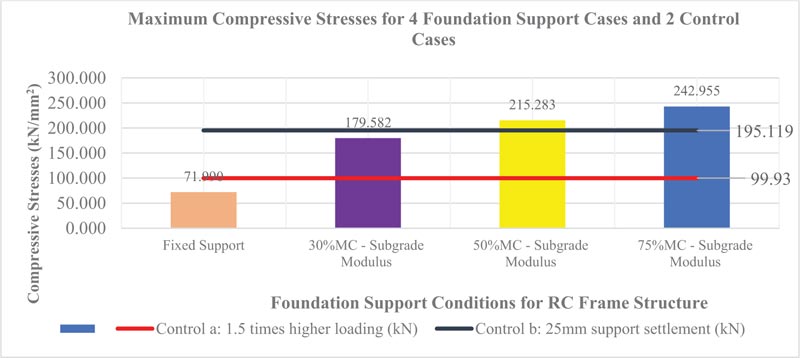
The compressive stresses in the frame structure increased by 35.3% when the soil moisture content was increased from 30% to 75%. The frame structure with foundation supports subjected to 50% and 75% moisture content exceeded the strength resistance of the structure for the two control cases.
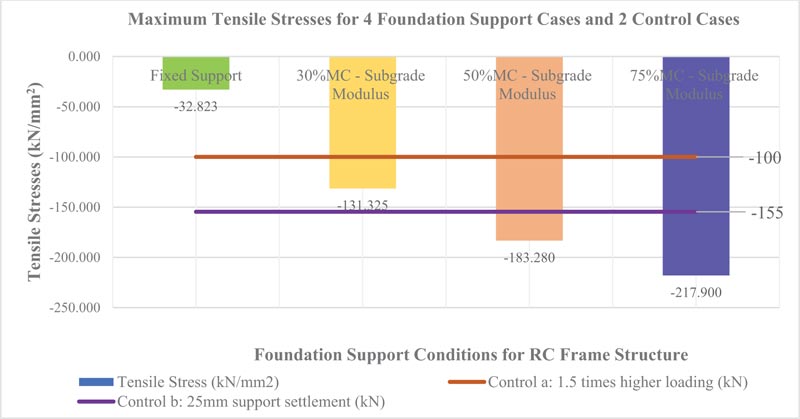
3.5.4.5. Tensile Stresses
The maximum tensile stresses in the frame structure members increased by 65.9% when the soil moisture content was increased from 30% to 75%, as illustrated in Fig. (21). It shows that an increase in soil moisture content to 50% and 75% increases the tensile stresses in the structure beyond the strength capacity of the structure, as demonstrated by the two control cases, and would lead to structural failure and even collapse.
3.5.5. Overall Summary of Structural Modelling Results and Influence of Soil Deformation on Differential Settlement of Frame Structures in Nairobi
The summary from structural modelling of the frame structure is shown in Table 8 and Fig. (22).
The relative supports differential settlement for the modelled frame structures is summarised in Fig. (23).

| Differential Settlement at Supports (mm) | Max Shear Forces (kN) | Max Bending Moment (kN/m) | Max -ve Bending Moment (kN/m) | Max Compressive Stress (kN/mm2) | Max Tensile Stress (kN/mm2) | Max Support Reaction (kN) | |
|---|---|---|---|---|---|---|---|
| Case 1: Fixed supports | 0 | 2853.091 | 94.727 | -94.727 | 71.99 | -32.825 | 2853.091 |
| Case 2: Foundation Supports with k=3990 at 30% MC | -61.013 | 3854.405 | 289.806 | -244.68 | 179.583 | -131.325 | 3854.405 |
| Case 3: Foundation Supports with k=1520 at 50% MC | -78.863 | 4272.68 | 349.475 | -314.64 | 215.28 | -183.28 | 4272.68 |
| Case 4: Foundation Supports with k=460 at 75% MC | -90.970 | 4557.433 | 389.743 | -364.157 | 242.99 | -217.9 | 4557.433 |
| Control 5a: 1.5 times higher loading (kN) | 0 | 3874.21 | 316.44 | -316.44 | 99.93 | -46.57 | 3874.21 |
| Control 5b: 25mm support settlement (kN) | -88.965 | 4040.489 | 316.440 | -275.33 | 195.119 | -154.639 | 4040.489 |
Scenarios 1 and 5a involving fixed supports without variation of foundation soil moisture content under normal loading and case of increased loading by a factor of 1.5 respectively recorded zero supporting differential settlement. Increasing soil moisture content led to an increase in soil deformation leading to a huge increase in differential settlement of the structure as indicated by -61.013 mm, -78.863 mm, and -90.97 mm supports settlement when foundation soil moisture content was increased to 30%, 50%, and 75%, respectively. Extrapolation in Figure 28 shows 39% of the soil moisture content as the cut-off point beyond which the structure would exceed the two control scenarios. Differential settlement at 50% soil moisture content and beyond exceeded the two control cases considered due to strength resistance of the structure and conservative industry practice parameters applied during normal design practice. The presence of high moisture content in foundation soil contributes to high differential settlement, thus affecting the structural integrity of the frame structure to the extent of building collapsing.
CONCLUSION
The findings from this research are very useful to construction stakeholders indesigning, supervising, and constructing building structures in areas susceptible to variation in soil moisture content and will contribute to reduction of the collapse of buildings in Nairobi and globally. Soil deformation increased with an increase in soil moisture content. Increment in soil deformation varied from 17.2% to 34% when the soil moisture content was increased from 30% to 75% for various soil samples tested from the Nairobi area and its environs. Some soil samples did not depict the largest deformation at 30% moisture content and this is attributed to the heterogeneous nature of the soil and associated chemical constituents. Soil deformation due to variation in soil moisture content contributed to an increase in differential settlement of foundations in a reinforced concrete frame structure. An increase in soil deformation due to an increase in soil moisture content from 30% to 75% occurred from foundation supports settlement from 61.013 mm to 90.97 mm which translates to an increase of 49.1% in foundation differential settlement as established from structural modelling. This differential settlement exceeded that of the two control cases whose higher limit was 68.965 mm and would therefore lead to structural instability resulting in a building failure. The differential settlement caused by soil deformation due to an increase in soil moisture content at 50% and above exceeded that of the two control cases, implying that such differential settlement would lead to the collapse of the building unless the structure is specifically designed to take care of such differential settlement emanating from variation in soil moisture content. Potential differential settlement in frame structures should be considered by engineers at the design and construction stage to avoid the collapse of buildings and loss of life and investment.
RECOMMENDATIONS
This research recommends that soil moisture content should always be tested at the planning and designing stage for every building construction project even where the construction drawings approving authorities do not demand of them like in the case of Kenya. During laboratory testing of soil samples, effects of variation in soil moisture content should always be undertaken in consideration of the envisaged moisture changes for a particular location during the building’s lifespan. The extent of soil deformation due to variation of moisture content should be assessed and an adequate factor of safety should be adopted at the design stage, and this will greatly avoid the risk of foundation failure emanating from differential settlement arising from variation in soil moisture content during the building’s lifecycle.
AREAS FOR FURTHER RESEARCH
Further research in foundation modelling using other foundation design software such as Plaxis 3D is recommended for further study by researchers to illustrate foundation soil behaviour during structural and foundation modelling. This research covered variation of soil moisture content to 30%, 50%, and 75% in addition to testing of soil at in-situ moisture content. Testing of soil samples at 5% moisture content intervals is recommended for further research to establish the soil behaviour between 30% and 50% and between 50% and 75% moisture content variation. Laboratory testing to compare soil bearing capacity results from the direct shear test method, and the triaxial test is recommended. It requires the allocation of adequate time and resources. Structural modelling for high-rise frame structures under the four foundation conditions and two control cases is recommended for further study. The differential settlement of the frame structure when other outer columns or inner columns are subjected to variation in soil moisture content is recommended for further research.
CONSENT FOR PUBLICATION
Not applicable.
AVAILABILITY OF DATA AND MATERIALS
None.
CONFLICT OF INTERESTS
None.
FUNDING
This study was supported by Pan African University Institute for Basic Sciences Technology and Innovation with CE/17 as a grant number.
ACKNOWLEDGEMENTS
Declared none.
APPENDEX
| In situ Moisture Content for the 7 Soil Samples | ||||||||
|---|---|---|---|---|---|---|---|---|
| - | - | (a) | (b) | (c) =a-b | (c) | (e)=b-c | (f)=c/e | (g) |
| - | Samples | Weight of Wet Sample + Tin (g) | Weight of Dry Sample + Tin (g) | Weight of Water (g) | Weight of Tin (g) | Weight of Dry Sample (g) |
Soil Moisture Content (%) |
Average Soil Moisture Content (%) |
| - | ||||||||
| 1 | Kariobangi near Mathare river at 1.5m depth (KMR1.5) | 70.3 | 49.6 | 20.7 | 9.9 | 39.7 | 52.10% | 52.10% |
| 91.6 | 63.8 | 27.8 | 9.8 | 54 | 51.50% | |||
| 2 | Githurai town near Gatharaini river at 1.5m depth (GGR1.5) | 71.6 | 58.1 | 13.5 | 22.3 | 35.8 | 37.70% | 37.10% |
| 69 | 56.6 | 12.4 | 22.7 | 33.9 | 36.60% | |||
| 3 | Githurai town near Gatharaini river at 2.0m depth (GGR2.0) | 78.5 | 59.3 | 19.2 | 24 | 35.3 | 54.40% | 55.40% |
| 104.5 | 75.5 | 29 | 24.1 | 51.4 | 56.40% | |||
| 4 | Githurai town near Gatharaini river at 2.5m depth(GGR2.5) | 76.6 | 57.3 | 19.3 | 22.2 | 35.1 | 55.00% | 55.00% |
| 79 | 59.6 | 19.4 | 24.3 | 35.3 | 55.00% | |||
| 5 | Kiambu KIST near Riara river at 1.5m depth | 89.6 | 76.1 | 13.5 | 24.1 | 52 | 26.00% | 25.90% |
| 87.8 | 74.6 | 13.2 | 23.4 | 51.2 | 25.80% | |||
| 6 | Kiambu KIST near Riara river at 1.8m depth(KKR1.8) | 70.9 | 62.3 | 8.6 | 23.4 | 38.9 | 22.10% | 21.90% |
| 87.3 | 76 | 11.3 | 23.9 | 52.1 | 21.70% | |||
| 7 | Kiambu Town near Riara river at 1.5m depth (KKT1.5) | 73.7 | 54.1 | 19.6 | 18.3 | 35.8 | 54.70% | 53.80% |
| 106.6 | 76.4 | 30.2 | 19.3 | 57.1 | 52.90% | |||
| - | - | - | - | - | - | - | Other Pre-test characteristics | Other Post-test characteristics | ||||||
|---|---|---|---|---|---|---|---|---|---|---|---|---|---|---|
| Samples | Flooded/ Non-Flooded | Pre-test Height of Specimen (cm) | Post-test Height of Specimen (cm) | Reduction in Height (cm) | Percentage Reduction in Height | Moisture Content | Specific Gravity | Void Ratio | Degree of Saturation | Bulk Density of Specimen | Dry Density of Sample | Moisture Content | Void Ratio | |
| 1 | KMR1.5 | Non-Flooded | 2 | 1.656 | 0.344 | 17.2% | 30.90% | 2.61 | 1.024 | 78.80% | 1689 | 1290 | 28.1 | 0.575 |
| Flooded | 2 | 1.587 | 0.413 | 20.7% | 29.50% | 2.61 | 1.168 | 65.90% | 1598 | 1234 | 33.8 | 0.561 | ||
| 2 | GGR1.5 | Non-Flooded | 2 | 1.644 | 0.356 | 17.8% | 37.10% | 2.54 | 1.208 | 78.10% | 1577 | 1150 | 40.7 | 0.666 |
| Flooded | 2 | 1.598 | 0.402 | 20.1% | 37.10% | 2.62 | 1.43 | 52.60% | 1388 | 1078 | 35.9 | 0.77 | ||
| 3 | GGR2.0 | Non-Flooded | 2 | 1.497 | 0.503 | 25.2% | 28.70% | 2.54 | 1.711 | 82.20% | 1456 | 937 | 48.3 | 1.004 |
| Flooded | 2 | 1.502 | 0.498 | 24.9% | 28.70% | 2.54 | 1.492 | 94.30% | 1584 | 1019 | 49.5 | 1.015 | ||
| 4 | GGR2.5 | Non-Flooded | 2 | 1.637 | 0.363 | 18.2% | 31.20% | 2.63 | 1.413 | 100.40% | 1657 | 1069 | 32.9 | 0.395 |
| Flooded | 2 | 1.535 | 0.465 | 23.3% | 31.30% | 2.63 | 1.481 | 95.80% | 1429 | 1089 | 32.9 | 0.395 | ||
| 5 | KKR1.5 | Non-Flooded | 2 | 1.577 | 0.423 | 21.2% | 25.90% | 2.54 | 1.019 | 64.50% | 1584 | 1258 | 28.2 | 0.811 |
| Flooded | 2 | 1.55 | 0.45 | 22.5% | 25.90% | 2.54 | 0.899 | 73.10% | 1684 | 1338 | 31.0 | 0.499 | ||
| 6 | KKR1.8 | Non-Flooded | 2 | 1.593 | 0.407 | 20.4% | 21.90% | 2.52 | 1.003 | 55.00% | 1534 | 1258 | 32.3 | 0.585 |
| Flooded | 2 | 1.531 | 0.469 | 23.5% | 21.90% | 2.52 | 0.804 | 68.60% | 1702 | 1396 | 32.9 | 0.506 | ||
| 7 | KTR1.5 | Non-Flooded | 2 | 1.58 | 0.42 | 21.0% | 30.60% | 2.62 | 1.399 | 57.30% | 1426 | 1092 | 28.6 | 0.73 |
| Flooded | 2 | 1.54 | 0.46 | 23.0% | 30.00% | 2.62 | 1.347 | 58.40% | 1461 | 1124 | 35.5 | 0.436 | ||

