All published articles of this journal are available on ScienceDirect.
Investigation of Uplift Capacity of Deep Foundation in Various Geometry Conditions
Abstract
Background:
Uplift resistance of deep foundations or piles is a critical factor for deep foundation design in several civil engineering applications such as electric transmission towers, communication towers and wind power generators. Therefore, the behavior of the pile under uplift load, together with its influential parameters, should be studied to provide a proper design.
Objective:
The aim of this study was to identify the effects of pile geometry, including diameter and embedment depth on the Maximum Uplift Resistance (MUR) of the small-scale piles.
Methods:
To achieve the aims of this study, a total of nine laboratory experiments having various pile diameters (i.e. 9 mm, 12 mm and 15 mm) and embedment depths (i.e., 10 cm, 15 cm and 20 cm) were planned, designed and conducted.
Results:
Generally, the results indicated that both diameter and embedment depth have a significant effect on the MUR of piles. The values of the MUR of piles were increased by increasing the pile diameters in all conducted tests. Furthermore, a significant increase in the MUR results was observed when the embedment depths are increased from 10 cm to 20 cm. Moreover, in all cases, small-scale piles were failed in embedment depths ranging from 5 mm to 10 mm.
Conclusion:
It was concluded that pile geometry has a deep impact on the MUR of the piles. Future research can be done to investigate the effects of other influential factors on the MUR.
1. INTRODUCTION
In order to support several superstructures such as tower and bridge, deep foundations (or piles) have been widely utilized in many construction sites. These structures can transmit loads due to the weight of these structures to the underground strata [1-4]. On the other hand, piles support such structures under uplift loads which are greater than their weights themselves. Therefore, pile behavior under uplift loading, as well as the influential parameters on the uplift capacity of the piles, should be investigated in more detail in order to have a proper design, especially for superstructures. Uplift forces may be exerted on piles due to several reasons such as wind, earthquake and swelling of the surrounding soils [5, 6].
During the last few decades, many investigations have been performed on the ultimate uplift capacity of the piles and most of them compared capacity of a single pile or a group of piles using laboratory and large-scale field tests [7-14]. In this regard, Khaled [5] conducted a series of experimental tests to investigate and compare the behavior of single piles and pile groups containing two, four, and six piles embedded in the sand. In his study, the influence of pile embedment depth, relative density of soil, and arrangement of the piles in a group on the uplift capacity of the piles was investigated. He showed that the uplift bearing capacity of a single pile is increased with increasing slenderness ratio of the pile and also relative density of the soil. The results of the study conducted by Khaled [5] were in agreement with the previous investigations [6, 15-17]. The influence of the above two parameters was investigated on the efficiency of the group of piles. The efficiency was increased with increasing of both mentioned parameters.
Several researchers investigated the behavior of piles under uplift and compression loading [18-22]. Poulos and Davis [23], and O’Neill and Reese [24] recommended that the uplift capacity of the piles could be 25% smaller than their compression capacities. However, some other researchers [15, 25] mentioned that the uplift and compression shaft resistances are almost the same.
Faizi et al. [12] investigated the failure mechanism of a shallow pile in loose sand with different slenderness ratios. From their study, it was concluded that the slenderness ratio is the most effective factor in the uplift capacity of the short piles. By increasing the slenderness ratio, the uplift capacity and failure zone were increased significantly. Bose and Krishnan [6], and Nazir and Nasr [26] compared pull out resistance capacities of piles with different sections. They found that the circular pile shape is more resistant to pullout forces than the square or rectangular pile shape. At the same load intensity, the ground deformation around the circular shape was obtained less than the rectangular and square shape. Faizi et al. [27] examined the effects of various slenderness ratios (in the range of 1-4) on uplift resistance of piles in loose sand and found that the Maximum Uplift Resistance (MUR) values of piles are increased by increasing the slenderness ratios. The oblique ultimate pulling resistances have been studied by a few researchers. In another study, Faizi et al. [13] studied the behavior of coated short piles with asphalt and uncoated short piles under pull out tests. According to their results, compared to the uncoated pile, coating the pile with asphalt led to a twofold uplift capacity enhancement. In addition, their findings promoted the use of the proposed methods of coating for enhancing the skin friction of a short pile.
Meyerhof [28], and Hanna and Nguyen [29] found that the increase in the inclination angle of the pile with respect to the vertical is able to enhance the pullout capacity for batter piles. However, Awad and Ayoub [30] and Al-Shakarchi et al. [31] showed that the pullout capacity in the vertical piles is more than the batter pile, and based on the study by Hanna and Afram [32], there is no significant difference in shaft resistance for different pile inclinations. In addition, Chattopadhyay and Pise [15] and Nazir and Nasr [26] concluded that the pullout capacity of the piles is increased with a batter angle and decreased after reaching a maximum value at batter angle of around 200. In some of the previous studies, the test results were used to propose equations for the calculation of the bearing capacity of the piles. Meyerhof [28] proposed a new equation to determine the axial pull out resistance of batter pile based on the depth of embedment, inclination, diameter, shaft friction and overburden pressure. Additionally, Hanna and Afram, [32] and Awad and Ayoub [30] developed an analytical equation to calculate the ultimate uplift capacity of the inclined piles based on the ultimate capacity of the vertical pile.
Based on the above discussion, the uplift capacity of piles is influenced by several important factors such as the relative density of soil, pile geometry and pile inclination. In the present study, an attempt has been made to investigate the effects of diameter and embedment depth on the MUR of the small-scale piles with specific material in medium dense sandy soil. For this purpose, a series of physical laboratory experiments were planned and conducted and eventually, the obtained results were compared and discussed. As far as the authors know, the testing conditions, implementation and planning to conduct these tests are new in this field. In the following sections, after some explanations regarding laboratory tests and their design and installation, the results of laboratory tests are analysed and discussed in detail.
2. METHODS
2.1. Experimental Framework
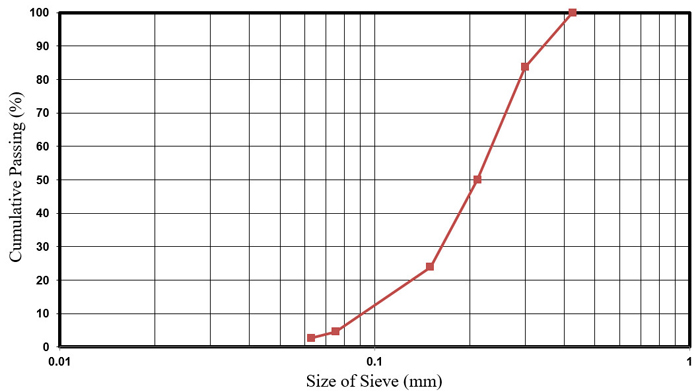
A series of laboratory physical tests were planned and carried out to assess the effects of diameter and embedment depth on the MUR of the small-scale piles. In this regard, a total number of nine small-scale three-dimensional tests have been accomplished under a single gravity (1g). The tests were conducted on sandy soil with a relative density of 50%. The soil properties have been defined in terms of the fine dry sand collected from Johor state, Malaysia. The sand was dried using a laboratory oven. The basic tests such as sieve analysis, relative density, specific gravity, and direct shear were carried out to determine the soil properties. The reduction factor of grain size between 0.063 mm to 0.425 mm provides a mean grain size (D50) of 0.212 mm. Fig. (1) shows the particle size distribution curve from the sand grain size analysis.
The unified soil classification system suggested that this sand is poorly graded. The results of the sand properties are summarized in Table 1. These properties included sand unit weight, friction angle, and cohesion where the configurations of the equipment and materials were based on the American Society for Testing and Materials controlling system.
|
Unit Weight (γ) [kN/m3] |
Frictional Angle (φ) [°] |
Dilation Angle (ψ) [°] |
Cohesion (c) [kN/m2] |
|---|---|---|---|
| 13.06 | 32.53 | 1.2 | 0 |
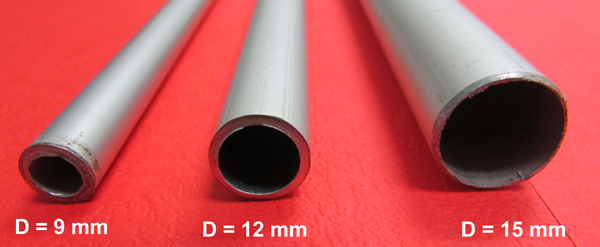
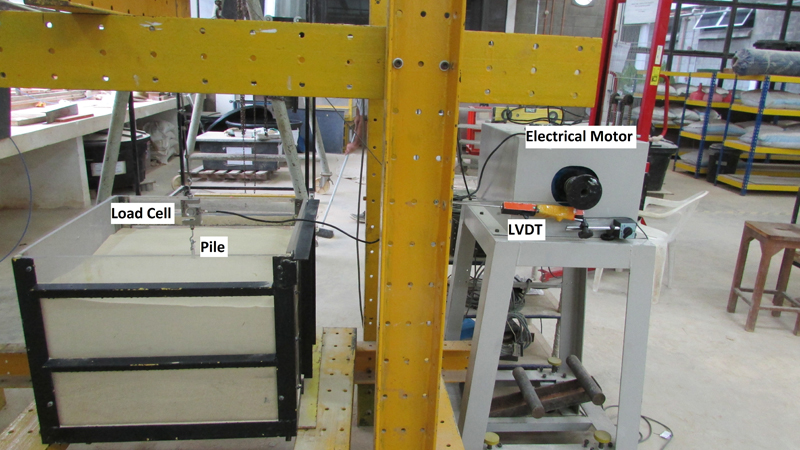
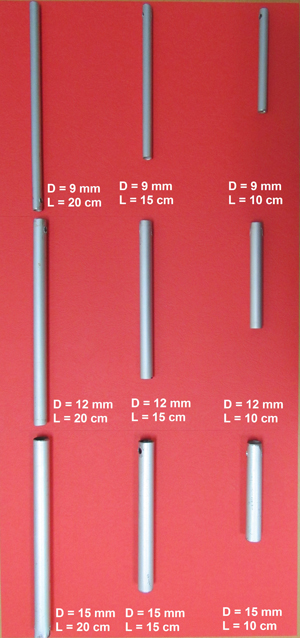
King et al. [33] addressed the reduction of scale effect in terms of a proportion ratio of pile diameter to the mean soil grain size exceeds 35. Therefore, considering D50 of the sand (which is equal to 0.212 mm), three pile diameters, i.e. 9 mm, 12 mm, 15 mm were selected and utilized in this study (Fig. 2). Several researchers suggested that the soil container for pile load test not to be less than eight times the pile diameter. Consequently, to avoid the negative effect of the boundary, the tests were carried out in a rectangular box with length, width and depth of 60 cm, 60 cm and 50 cm, respectively (Fig. 3). In addition, Fig. (3) displays the locations of Linear Variable Differential Transformer (LVDT), pile, load cell and electrical motor during conducting the tests.
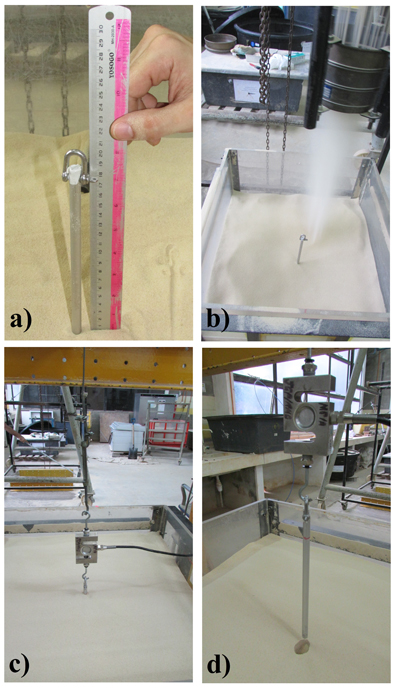
To obtain sandy soil with 50% relative density, a so-called new method “Mobile Pluviator” system was used in this study. This method was introduced in the study conducted by Khari et al. [34], and it is based on the free fall of the sand into the box (Fig. 4b). As mentioned before, a total of 9 small scale physical tests with different pile diameters and embedment depths have been conducted to investigate the parametric study of the maximum pile resistant due to axial pullout. Pulling out was applied vertically to the piles throughout the continuous operation of an electric motor connected to a wire cable. A load cell with an accuracy of 20 kN and
Each test includes four different steps to be finalized. Firstly, piles were placed as an existing pile in the center of the testing box (Fig. 4a). Then, the Pluviator system was used to fill up the box with the desired density of the dry sand (Fig. 4b), according to the mentioned study (Khari et al. [34]). In the third step, some instruments such as LVDT, load cell and electrical motor should be set to proceed with the test (Fig. 4c). Furthermore, in this step, a data logger was set to record the maximum pull out load for each pile. Finally, the last step was to remove the pile and other instruments for conducting another test. It is worth mentioning that the rate of the pull out speed was set at 0.79 mm/second over 36 continuous seconds. The piles were fabricated as a hollow aluminum tube with the embedment depths of 10 cm, 15 cm and 20 cm (see Fig. 5). After conducting the mentioned tests, their results were analyzed and compared to each other. The obtained results will be discussed in the following section.
3. RESULTS AND DISCUSSION
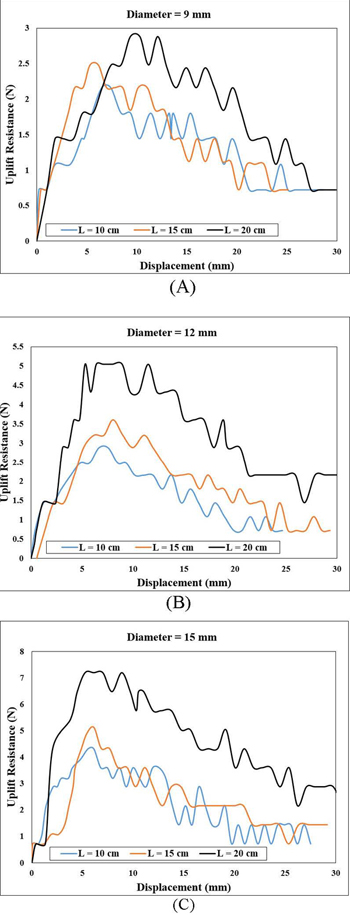
As mentioned earlier, considering 3 pile diameters and also 3 embedment depths, 9 small-scale laboratory tests were planned, designed and conducted in order to investigate the MUR. The obtained results from the experimental works are presented in Table 1. As shown in this table, the obtained results recommended the efficiency of using the piles with larger diameters and longer embedment depths to increase the uplift resistance. In fact, based on the obtained laboratory results, pile diameter and embedment depth have a direct relationship with the MUR results. It means that a pile diameter of 15 mm with an embedment depth of 20 cm received the highest MUR value. Considering only results of 15 mm diameter tests, a significant increase in results of MUR can be found when embedment depths increase from 10 cm (which is 4.32 N) to 20 cm (which is 7.20 N). Moreover, a similar trend was observed when pile diameters are increased from 9 mm to 15 mm for a specific embedment depth.
In order to have a better illustration and comparison of the laboratory results, uplift resistance values against their displacements for different pile diameters are shown in Fig. (6). Based on this figure, diameter plays a vital role in increasing the MUR of the piles. Generally, the obtained MUR values are increased by increasing the pile diameter in all conducted tests. As a result, for all pile diameters, MUR values obtained by L = 10 cm and L = 15 cm, are very close to each other while, a clear increase in MUR values can be seen when embedment depth of 20 cm is considered. For instance, for a pile diameter of 15 mm, MUR values of 4.32, 5.12 and 7.20 N were obtained for embedment depths of 10 cm, 15 cm and 20 cm, respectively, which indicate higher MUR value obtained by L = 20 as compared to other embedment depths. It should be noted that, in most of the tests, a depth range of 5 mm to 10 mm was found for piles failure. In addition, as a result, the MUR values were obtained for all diameters and embedment depths in displacement ranging from 5 mm to 10 mm. In other words, all piles were failed in a maximum displacement of 10 mm. The diameter of the pile was one of the most effective parameters on the MUR as mentioned by several researchers [13, 27].
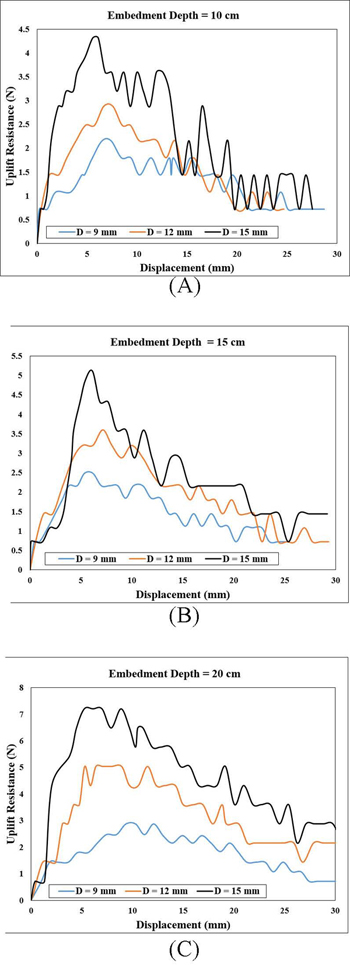
Another influential factor on the MUR of piles based on the obtained results of this study is related to embedment depth. As mentioned by many researchers (e.g., [12, 13]), this parameter has a deep impact on the results of the MUR of the pile. The effects of embedment depths on the MUR results can be seen in Fig. (7) for all cases. As displayed in this figure, the same trend was observed in the results of MUR for all embedment depths. According to Table 2 and Fig. (7), using a pile diameter of 15 mm with the embedment depth of 20 cm, the MUR value of 7.20 N was obtained, while the MUR value of 2.16 N was obtained for a pile diameter of 9 mm with the embedment depth of 10 cm. As a report, considering the results of embedment depth of 20 cm, the MUR values of 2.88, 5.04 and 7.20 N were obtained for pile diameters of 9 mm, 12 mm and 15 mm, respectively, which show a reasonable trend for pile diameter and embedment depth.
Similar to depicted results in Fig. (6), in most of the cases, piles were failed in depths ranging from 5 mm to 10 mm (Fig. 7). As a result, clear changes were occurred after reaching the MUR values in several cases, e.g. pile diameter of 15 mm for all embedment depths. According to the obtained results, an increase of 40.63% was observed for pile diameter of 15 mm with embedment depth 20 cm as compared to pile diameter of 15 mm with the embedment depth 15 cm. While this percentage is 18.52% when pile diameter of 15 mm with embedment depths of 15 cm and 10 cm was tested. Additionally, based on Fig. (7), the test results suggest that when the residual uplift capacity is of interest, piles with shorter diameters, e.g., 9 mm can be designed and performed. The results of this study indicate that pile geometry parameters, i.e. the diameter and the embedment depth have a significant impact on the maximum resistance of piles under pullout load.
| Diameter (mm) | Maximum Uplift Resistance (N) | ||
|---|---|---|---|
| L = 10 cm | L = 15 cm | L = 20 cm | |
| 9 | 2.16 | 2.48 | 2.88 |
| 12 | 2.88 | 3.60 | 5.04 |
| 15 | 4.32 | 5.12 | 7.20 |
CONCLUSION
Modeling of the uplift capacity of the piles is one of the complicated problems in the field of geotechnical engineering and more specifically in oiling technology. In the present study, to investigate the effects of pile geometry, including the pile diameter and the embedment depth, 9 small-scale laboratory tests were designed and carried out in medium-dense sand. In these tests, 3 pile diameters, i.e. 9 mm, 12 mm and 15 mm and also 3 embedment depths, i.e. 10 cm, 15 cm and 20 cm were considered and conducted. The laboratory results demonstrated that the MUR values of piles are directly related to their diameters and embedment depths. Generally, the results of the MUR of piles were increased by increasing the pile diameter in all conducted tests. Furthermore, a significant increase in the MUR results was observed when the embedment depths are increasing from 10 cm to 20 cm. It was found that the minimum and maximum MUR values for all embedment depths were achieved for pile diameters of 9 mm and 15 mm, respectively. As an example, increased percentage values of 40.63 and 18.52 were obtained when embedment depth is increased from 10 cm to 15 cm and from 15 cm to 20 cm for a pile diameter of 15 mm. Additionally, test results recommended that when the residual uplift capacity is of interest, a pile diameter of 9 mm is the best among all pile diameters, i.e., 9 mm, 12 mm and 15 mm. In the future, other researchers can plan to investigate other influential parameters on the MUR of the pile such as different pile material, group pile, different soil type, etc.
LIST OF ABBREVIATIONS
| MUR | = Maximum Uplift Resistance |
| D50 | = Mean grain size |
| LVDT | = Linear Variable Differential Transformer |
| D | = Pile diameter |
| L | = Embedment depth |
| γ | = Unit weight |
| φ | = Frictional angle |
| ψ | = Dilation angle |
| c | = Cohesion |
CONSENT FOR PUBLICATION
Not applicable.
AVAILABILITY OF DATA AND MATERIALS
Not applicable.
FUNDING
This research has been carried out at the Universiti Teknologi Malaysia (UTM) Research University Grant (GUP) Scheme, No. (PY/2014/02556) for vote project 06H60.
CONFLICT OF INTEREST
The authors declare no conflict of interest, financial or otherwise.
ACKNOWLEDGEMENTS
The authors would like to thank UTM for this research grant and provided facilities.


