All published articles of this journal are available on ScienceDirect.

Application of the Regression Model for Evaluating Factors Affecting Construction Workers’ Labor Productivity in Vietnam
Abstract
Background:
In the rapidly-developed construction industry, labor productivity has improved to a great extent, still, it is low compared with many other industries. The enhancement of labor productivity has become important that attracts much attention and focus from researchers in Vietnam and around the world.
Aim:
This paper focuses on key factors affecting labor productivity of construction sites in Vietnam by introducing a regression model to evaluate the extent of each factor’s impact on the labor productivity of construction workers.
Methods:
Ten groups of impacting factors were identified as factors relevant to construction worker, factors relevant to site operation and management, factors relevant to motivation, factors relevant to working time, factors relevant to labor working tools, factors relevant to labor working conditions, factors relevant to working safety, factors relevant to project informations, factors relevant to natural environment, and factors relevant to socio-economic conditions.
Results:
By referring to research results, Vietnamese construction contractors will be able to come up with workable solutions towards a better performance of construction workers.
Conclusion:
On that basis, the productivity of construction firms and the workers will be improved correspondingly.
1. INTRODUCTION
Labour productivity is one of the most important factors affecting the economic growth and competitive capacity of each enterprise as well as the country [1-3]. Although Vietnamese labor productivity has recently been improved, it is still lower than in other countries in ASEAN. According to Seminars “Boosting productivity in the context of industriali zation”, Vietnam’s labor productivity is approximately equivalent to 7% to that of Singapore, 17.6% of Malaysia 36.5% of Thailand, 42.3% of Indonesia [4], 56.7% of Phillippines, and especially 87.4% of Laos [5]. In recent years, although there have been great scientific and technological developments, these have not yet been exploited by Viet- namese construction firms. Specifically, labor productivity in construction is only equal to 85% of those obtained in other industries. The growth rate of productivity is about 10%, which is lower than the average annual growth rate of about 16% [6]. One of the causes is the lack of applying advanced technology, heavy equipment, and machinery. Construction labor productivity, therefore, is one of the most important factors in the productivity of a business, which has a direct effect on labor productivity in the construction field and national economy. This research conducts regression analysis to evaluate the extent of the impact of each factor on the labor productivity of construction workers in Vietnam. The result helps construction enterprises in finding the solutions for improving labor productivity of construction workers in particular and the economy of Vietnam in general.
2. LITERATURE REVIEW
Productivity enhancement plays an important role in any profit-oriented organization, as representative of the effective and efficient conversion of resources into marketable products and determines the profitability of a business [7]. Therefore, considerable efforts have been made to understand the concept of productivity, with researchers’ different approaches leading to a variety of productivity definitions [8-10]. Productivity has been generally defined as the ratio of outputs to inputs. Output and input are vastly different from one industry to another. The definition of productivity also varies when applied to different fields of the same industry. Labor is one of the basic requirements in the construction sector. Labor productivity is simply defined as the amount of work done by craft workers within a certain period of time [11, 12]. In other words, the definition of labor productivity is the number of goods and services produced by a productive factor (manpower) in the unit of time [13]. On the other hand, construction projects are carried out on-site and thus, in each project, the working conditions and project participants change from area to region [14]. Accordingly, labor productivity also varies depending on the region in which the project is being implemented. As a result, most studies have been conducted for specific regions by considering managers’ perspective and different results were obtained [15].
The factors that affect the productivity of the construction has been studied by a number of researchers, but there are still many productivity problems that remain unknown and need to be further investigated even in developed countries [16]. Moreover, policies for increasing productivity are not necessarily the same in every nation and the critical factors in developing countries are different from those in developed countries [17]. Herbsman et al., (1990) [18] classified factors that affect construction productivity in two main groups: technological factors and administrative factors. Technological factors mainly include the ones related to the design of the project; and the administrative group factors relate to the management and construction of the project. Technological factors include subgroups such as design factors, material factors and location factors. Administrative factors comprise sub-groups, such as construction methods and procedural factors, equipment factors, work factors and social factors.
Abdulaziz et al., (2012) used a questionnaire to investigate constructors in Kuwait with 45 productivity factors, which were grouped into the following four main groups: management; technological; human/labor; and external. The results of this study showed that the following 10 are perceived as the most significant impact factors on labor productivity: clarity of technical specifications; the extent of variation/ change orders during execution; level of coordination between the disciplines of design; lack of supervision of work; proportion of subcontracted work; level of complexity of the project; lack of an incentive scheme; lack of construction manager’s leadership; stringent inspection by the engineer; and hesitation to respond to requests for information [19]. Olomolaiye et al., (1998) stated that the factors that influence building productivity are rarely constant, and may vary from one country to another, from one project to another and even within the same project, depending on circumstances. This study has classified the factors that influence the productivity of the constructions in 2 categories: external and internal, representing those outside the control of the company’s management, and those that originate within the company [20]. Heizer et al., (1990) classified the factors that influence the productivity of the construction site in 3 groups: characteristic factors of work; factors of the working conditions of the project; and non-productive activities [21]. Jiukun et al. (2009) identified 83 factors that affect productivity and assessed the levels of influence of these factors through a survey of almost two thousand artisan workers at construction sites located throughout the United States. They stated that factors involving tools and consumables, materials, management of engineering drawings and construction equipment were identified as having the greatest impact on productivity from the craft workers’ perspective [22].
3. FACTORS AFFECTING LABOR PRODUCTIVITY OF CONSTRUCTION WORKERS IN VIETNAM
Due to the unique characteristics of construction projects, the executive process is often time-consuming and goes through several periods with many components participating in. Therefore, the labor productivity of workers is affected by several factors [23]. By referencing literature and considering practices on the construction site in Vietnam, the authors utilized 49 factors and divided them into 10 groups as shown in Table 1.
| Factors | References | |
|---|---|---|
| A | Factors relevant to construction worker | Nguyen Thanh Vu (2015) [24] |
| 1 | Age | Clarkson, H. O., et al. (1989) [25]; Vy and Yem (2007) [26] Nguyen Ba Vy, et al. (2008) [27] |
| 2 | Experiences of workers | Sanders and Thomas (1991) [28]; Enshassi et al. (2007) [29]; Ngo Van Tuan (2018) [5] |
| 3 | Gender | The authors proposed |
| 4 | Labor discipline | Thomas et al. (1999) [30] |
| 5 | Labor intensity | The authors proposed |
| 6 | Level of training | Makulsawatudom and Emsley (2002) [31];Vu Quang Lam (2010) [32] |
| 7 | Physical ability | The authors proposed |
| 8 | Psychophysiology ability | Nguyen Ba Vy, et al. (2007) [27] |
| B | Factors Relevant to Site Operation and Management | Lim and Alum (1995) [33]; Lema (1995) [34]; Hanna et al. (2005) [35]; Vu Quang Lam (2010) [32] |
| 1 | Ability to organize production | The authors proposed |
| 2 | Application of technology | Junbok Lee, et al. (2017) [36] |
| 3 | Attitude towards employees | Langford D, et al. (1995) [37]; Vu Quang Lam (2010) [32]; Le Van Hung (2016) [38] |
| 4 | The manager's experience | Farnad Nasirzadeh and Pouya Nojedehi (2013) [39] |
| C | Factors Relevant to Motivation | Kazaz A, et al. (2008) [40] |
| 1 | Initiative at work | The authors proposed |
| 2 | Reward mechanism | Langford D, et al. (1995) [37]; Soekiman A 2009) [41] |
| 3 | Spiritual life | The authors proposed |
| 4 | Staff support | The authors proposed |
| 5 | Training and improving skills | Olomolaiye P, et al. (1988) [42] |
| 6 | Types of salary payment | Langford D, et al. (1995) [37]; Kazaz A, et al. (2008) [40]; Loan, T. T. K, et al. (2009) [43] |
| D | Factors Relevant to Working Time | The authors proposed |
| 1 | Break time | The authors proposed |
| 2 | Delay time | Thomas HR (1992) [44]; Nguyen Ba Vy, et al. (2007) [27]; Hanna et al. (2005) [35] |
| 3 | Number of working hours | Hanna et al. (2005) [35]; Hanna et al. (2008) [45] |
| 4 | Operating time | Nguyen Ba Vy, et al. (2007) [27]; Hanna et al. (2005) [35]; |
| 5 | Preparing and finalizing time | The authors proposed |
| 6 | Working mode | Hanna AS, et al. (2008) [45] |
| E | Factors Relevant to Labor Working Tools | P. Foraboschi (2016) [46], P. Foraboschi (2019) [47], P. Foraboschi (2016) [48] |
| 1 | Complexity of works | The authors proposed |
| 2 | Material transport methods | The authors proposed |
| 3 | Quality of building materials | Nguyen Ba Vy, et al. (2007) [27]; A. Soekiman, et al. (2011) [49], P. Foraboschi (2016) [46], P. Foraboschi (2019) [47] |
| 4 | Quality of working tools | Loi, D. N, et al. (2016) [50], P. Foraboschi (2019) [47], P. Foraboschi (2016) [48] |
| F | Factors Relevant to Labor Working Conditions | Mostafa E. Shehata, et al. (2011) [51]; Hanna AS, et al. (2008) [45] |
| 1 | Exposure to toxic substances | Mostafa E. Shehata, et al. (2011) [51] |
| 2 | Height of working place | Nguyen Ba Vy, et al. (2007) [27] |
| 3 | Intensity of lighting, ventilation | The authors proposed |
| 4 | Noise | The authors proposed |
| 5 | Working in hazardous areas | Lowe G (1987) [52] |
| G | Factors Relevant to Working Safety | Makulsawatudom and Emsley (2002) [31]; Adnan Enshassi, et al. (2007) [29] |
| 1 | Arrangement of safety staff | The authors proposed |
| 2 | Occupational accidents | Ministry of Construction (2016) [53] |
| 3 | Regulations on labor safety | The authors proposed |
| 4 | Safety equipment | The authors proposed |
| 5 | Safety signs | Makulsawatudom and Emsley (2002) [31]; Nguyen Huy Thanh (2016) [23] |
| 6 | The sense of observance of regulations by laborers | Kaming PF, et al. (1997) [54] |
| 7 | Training on labor safety | The authors proposed |
| H | Factors Relevant to Project Informations | Olomolaiye P, et al. (1988) [55] |
| 1 | Construction method | Olomolaiye, et al. (1996) [20]; Lim and Alum (1995) [33]; Jiukun Dai et al. (2009) [22] |
| 2 | Type of activities in the project | The authors proposed |
| 3 | Change design | The authors proposed |
| 4 | Project scale | Jiukun Dai et al. (2009) [22]; Farnad Nasirzadeh and Pouya Nojedehi (2013) [39] |
| I | Factors Relevant to Natural Environment | Xiaodong Li, et al. (2016) [56]; Nguyen Huy Thanh (2016) [23]; Le Van Cu (2017) [57] |
| 1 | Geological and hydrological conditions | The authors proposed |
| 2 | Regulations, laws on construction | Le Van Cu (2017) [57] |
| 3 | Weather conditions | Thomas et al. (1999) [30]; Adnan Enshassi, et al. (2007) [29]; Nguyen Huy Thanh (2016) [23]; |
| K | Factors Relevant to Socio-Economic Conditions | Xiaodong Li, et al. (2016) [56]; Nguyen Huy Thanh (2016) [23]; Le Van Cu (2017) [57] |
| 1 | Regulations, laws on construction | Le Van Cu (2017) [57] |
| 2 | Competition in construction field | The authors proposed |
In the previous research [58], the authors used the method of the Relative Importance Index (RII) [59] to rank the extent of the impact of factors on labor productivity of construction workers in Vietnam. In this research, the authors used regression analysis method [60] to evaluate the extent of the impact of 10 groups on labor productivity of construction workers in Vietnam.
4. RESEARCH METHODOLOGY
This research used regression analysis method to evaluate the extent of the impact of factors on labor productivity of construction workers in Vietnam in 5-step order as follow:
Step 1 - Determining the Research Model: Researching model which focusses on the interrelated connection between general factors such as (dependent variable) labor productivity of construction workers and effect factors (independent variables) [60] has the following form as shown in eq. (1):
 |
(1) |
Where: - β0: free coefficient
- β1, β2, β3, …, βk: recurrent coefficients
- X1, X2, X3, …, Xk: independent variables (factors which effect components)
- Y: dependent variables (labour productivity of construction workers)
Step 2 - Design of survey form and collection of figures: A survey form was designed to evaluate the impact level of the above factors. One of the most popular forms that measure abstract concepts in studying socioeconomics is Rennis Likert scale [61, 62]. It is necessary to determine the size of samples in conducting quantitative analysis. According to Hair et al. (1998) [63], experience formula which is often used to calculate the size of samples for regression analysis is as follows: n ≥ 50 + 10*p (n is the size of samples, p is the number of independent variables in the model). Therefore, the indispensable size of samples is: n ≥ 50+ 10*p = 50 + 10*10 = 150.
Step 3 - Test the Reliability of Scale: Cronbach’s Alpha failed-safety of effect factors were tested by ρc composite reliability, ρvc variance extracted, and Cronbach’s Alpha α. According to Hai et al. (1998) [63], the standard for evaluating the level of relevance of the model, which is expressed by failed-safety of scale, is ρc > 0,5 or ρvc > 0,5; or α ≥ 0,6 [61, 62].
Item-total correlation is a coefficient showing the association level between observed variables and others. The standard to evaluate whether a coefficient actually contributes, is that the item-total correlation must be higher than 0.3. If observed variables have item-total correlation smaller than 0.3, they are weed out of the evaluated factors [64].
Exploratory Factor Analysis (EFA): The criteria for applying and choosing variables in EFA include:
Bartlett's Test of Sphericity and Kaiser-Meyer-Olkin Measure of Sampling Adequacy (Kaiser-Mayer-Olkin) are used to evaluate the suitability of EFA. Thereby, the hypothesis that variables are not interrelated in general is rejected. As a result, the EFA is called appropriate if 0.5≤ KMO ≤1 and sig< 0.05. If KMO < 0.5, showing that the analyzed factors are not suitable for data [61].
Standard extracting factors consist of index eigenvalue (represents the amount of fluctuation explained by factors) and index cumulative (ρvc variance extracted shows to what percent analyzing factors could be explained and what percentage is lost). Factors having eigenvalue < 1 do not have a better function in summarizing information than original variables (hidden variables in scales before EFA). Therefore, factors are only extracted if eigenvalue > 1 and are accepted if ρvc variance extracted ≥ 50% [61].
Factor loading denotes the correlation between variables and factors, which is used to evaluate the extent of EFA. According to Hair et al., (1998) [63], factor loading > 0.3 is considered to be the minimum; factor loading > 0.4 is considered important; factor loading > 0.5 is considered to have practical meanings [64].
Step 4 - Analysis of regression is aimed at determining the influence level of each factor to the overall factor through coefficient β. The higher coefficient β shows the significant effect on the overall factors of that factor. Coefficient β has a valuation within -1 and +1 and can be defined as:
- If value β > 0: positive correlation relationship between independent variables and dependent variables.
- If value β < 0: negative correlation relationship.
- If value β is closer to 1: the more coherent the correlation relationship between independent variables and dependent variables is.
- If value β is closer to 0: the lower the correlation relationship between independent variables and dependent variables is.
The assumption about multi-collinearity phenomenon is tested through tolerance value or variance inflation factor coefficient. If coefficient VIF < 2, the multi-collinearity phenomenon of independent variables is trivial. The recurrent equation is only accepted if there is no multi-collinearity phenomenon or independent variables do not have a coherent relationship [60, 64].
Step 5 - Testing the Suitability of the Multiple Regression model: The suitability of the model is tested by adjusting target R2 and testing ANOVA [63].
5. DATA ANALYSIS
5.1. Research Model
The formal research model showing the correlation relationship between the overall effect factor (dependent variable) [60] in labor productivity of construction workers in Vietnam and particular effect factor (independent variable) has a form shown in eq. (2) below:
 
|
(2) |
Where: - Y: dependent variable (labour productivity of construction workers)
- β0: free coefficient
- β1, β2, β3,…, β10: recurrent coefficients
- X1, X2, X3, …, X10: independent variables (effected factors):
X1: The factor relevant to the construction worker
X2: The factor relevant to operation and management on construction site
X3: The factor relevant to motivation
X4: The factor relevant to working time
X5: The factor relevant to tools and subject of labor
X6: The factor relevant to labor condition
X7: The factor relevant to labor safety
X8: The factor relevant to project information
X9: The factor relevant to the natural environment
X10: The factor relevant to socio-economic
5.2. Data Collection
One of the most important stages was to collect accurate data. Survey objects are construction workers, project mana- gers, site managers, site engineers, supervisors, etc. The total number of questionnaires is 300; the questionnaires received and validated were 267, which is higher than the necessary number, so the collected data was approved as it fulfilled the requirement. Data is shown in the following Table 2.
5.3. Reliability of Measured Sale
Testing Cronbach’s Alpha faild-safety of effect factors:
The Cronbach Alpha test is used to determine whether the factor included in the quantitative study has had an effect on the synthetic variable. Cronbach’s Alpha = 0.844 > 0.7, therefore reliability is acceptable. Influenced factors have Cronbach's Alpha if the item deleted > 0.3, so being closely related to other factors in the model, influence factors should be retained in the research model. The influencing factors after meeting Cronbach’s Alpha requirements at a significant level will be subjected to exploratory factor analysis to obtain a component matrix (Table 3).
Exploratory Factor Analysis EFA: Variables after being tested for reliability by Cronbach’s Alpha coefficient and item-total correlations are further checked for their correlation by a variable group. Factor analysis is used when the KMO coefficient has a value greater than 0.5. Factors whose values were less than 0.4 will continuously be excluded from the variable group to ensure convergence between variables in a factor; when Initial Eigenvalue is greater than 1 and the Total Variance Explained is greater than 0.5. In this study, the principal component method with Varimax rotation was used for factor analysis. All of the original 10 observed variables after the reliability test with Cronbach’s Alpha coefficients were satisfied and included in the exploratory factor analysis. EFA’s results are shown in Table 4 as:
| – | No. | Percentage of total (%) |
|---|---|---|
| Total Questionnaires Sent | 300 | 100.0 |
| Total Questionnaires Received | 267 | 89.0 |
| The number of samples needed | 130 | 43.3 |
| Used for Study | 267 | 89.0 |
| Cronbach's Alpha | Number of Items | |||||
|---|---|---|---|---|---|---|
| 0.844 | 10 | |||||
| Item-Total Statistics | ||||||
| Factors Affecting | Scale Mean if Item Deleted | Scale Variance if Item Deleted | Corrected Item-Total Correlation | Cronbach's Alpha if Item Deleted | ||
| X1 | 33.36 | 31.651 | 0.4 | 0.845 | ||
| X2 | 32.99 | 32.737 | 0.397 | 0.843 | ||
| X3 | 32.82 | 32.439 | 0.478 | 0.836 | ||
| X4 | 32.72 | 30.637 | 0.595 | 0.825 | ||
| X5 | 33.15 | 31.797 | 0.509 | 0.833 | ||
| X6 | 32.74 | 32.027 | 0.464 | 0.837 | ||
| X7 | 32.76 | 30.444 | 0.651 | 0.820 | ||
| X8 | 32.84 | 29.634 | 0.683 | 0.816 | ||
| X9 | 32.94 | 29.955 | 0.608 | 0.824 | ||
| X10 | 32.84 | 29.634 | 0.683 | 0.816 | ||
| KMO and Bartlett's Test | ||||||||
|---|---|---|---|---|---|---|---|---|
| Kaiser-Meyer-Olkin Measure of Sampling Adequacy | .853 | |||||||
| Bartlett's Test of Sphericity | Approx. Chi-Square | 941.636 | ||||||
| df | 45 | |||||||
| Sig. | .000 | |||||||
| Total Variance Explained | ||||||||
| Component | Initial Eigenvalues | Extraction Sums of Squared Loadings | ||||||
| Total | % of Variance | Cumulative % | Total | % of Variance | Cumulative % | |||
| X1 | 4.276 | 42.759 | 42.759 | 4.276 | 42.759 | 42.759 | ||
| X2 | 1.479 | 14.789 | 57.548 | 1.479 | 14.789 | 57.548 | ||
| X3 | .776 | 7.758 | 65.307 | – | ||||
| X4 | .709 | 7.087 | 72.394 | |||||
| X5 | .617 | 6.172 | 78.566 | |||||
| X6 | .564 | 5.637 | 84.203 | |||||
| X7 | .495 | 4.951 | 89.154 | |||||
| X8 | .433 | 4.334 | 93.488 | |||||
| X9 | .345 | 3.448 | 96.936 | |||||
| X10 | .306 | 3.064 | 100.000 | |||||
After conducting EFA analysis to determine convergence value and differentiate the value of the scale, results obtained are as follows:
- Kaiser-Meyer-Olkin Measure of Sampling Adequacy KMO = 0.853 > 0.5: Meaningful analysis of factors with high relevance.
- Bartlett's Test of Sphericity with Sig = 0.00 < 0.05: The observed variables have an overall correlation with each other.
- Total Variance Explained = 57.548% > 50%: The variation of the observed variables is considered acceptable.
The following rotated component matrix to study of the number of samples required 267 samples, and the load factor loading was found to be 0.4. At the component matrix, the observed variables with factor loading were less than 0.4, therefore, the observed variables were uploaded to two groups of factors and the coefficient difference at less than 0.3 was removed (Table 5).
| Rotated Component Matrixa | ||
|---|---|---|
| Factors Affecting | Component | |
| 1 | 2 | |
| X1 | .833 | – |
| X2 | .727 | – |
| X3 | .588 | – |
| X4 | .581 | – |
| X5 | .583 | – |
| X6 | .615 | – |
| X7 | .475 | – |
| X8 | .238 | .450 |
| X9 | .481 | |
| X10 | .479 | .593 |
Rotation Method: Varimax with Kaiser Normalization.
5.4. Regression Analysis
Regression analysis is used to determine the specific weight of each factor to the labor productivity of construction workers in Vietnam. Regression analysis was performed with 8 independent variables: X1, X2, X3, X4, X5, X6, X7, X9, and a dependent variable Y. The values of the elements used to run the regression were the normalized values of the observed variables. Regression analysis was conducted with the support of the SPSS.20 software. Regression results are expressed in Table 6 as follows:
Results of regression analysis with multiple values of β > 0 show that all the independent variables are correlated with the dependent variable. Also collinearity statistics with Tolerance> 0.1 and variance inflation factor VIF < 2, thereby confirming that the influencing factors are independent of each other. The phenomenon of multicollinearity between the independent variables has no significant influence in the regression model. The results of multiple regression analysis were applied to the regression equation to ensure statistical significance. The value of the independent variable in the Sig model was less than 0.05. It was observed that variables in the code were statistically significant at 5 % significance. So the independent variables in the model are related to dependencies. The regression results show that both having 8 independent variables that affect the dependent variable coefficients by Sig's 8 turns were below 0.05.
Based on the standardized regression coefficient, regression equations determine the extent of the influence of each factor on the labor productivity of construction workers in Vietnam which is identified in eq. (3) as:
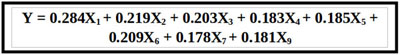 |
(3) |
Where: - Y: dependent variable (labour productivity of construction workers)
- β0: free coefficient
- β1, β2, β3,…, β10: recurrent coefficients
- X1, X2, X3, X4, X5, X6, X7, X9: independent variables (effect factors):
X1: Factors relevant to construction worker β1 = 0.284
X2: Factors relevant to operation and management on construction site β2 = 0.219
X3: Factors relevant to motivation β3 = 0.203
X4: Factors relevant to working time β4 = 0.183
X5: Factors relevant to tools and subject of labor β5 = 0.185
X6: Factors relevant to labor condition β6 = 0.209
X7: Factors relevant to labor safety β7 = 0.178
X9: Factors relevant to natural environment β9 = 0.181
5.5. Testing Conformity of the Regression Model
By testing the suitability of the model by target R2 and con- ducting ANOVA test, regression results are shown in Table 7:
| Coefficientsa | ||||||
|---|---|---|---|---|---|---|
| Model | Unstandardized Coefficients | Standardized Coefficients | Sig. | Collinearity Statistics | ||
| B | Std. Error | Beta | Tolerance | VIF | ||
| (Constant) | 1.981E-16 | 0.000 | ||||
| X1 | .125 | 0.000 | .284 | .000 | .586 | 1.405 |
| X2 | .125 | 0.000 | .219 | .000 | .593 | 1.686 |
| X3 | .125 | 0.000 | .203 | .000 | .605 | 1.653 |
| X4 | .125 | 0.000 | .183 | .000 | .620 | 1.614 |
| X5 | .125 | 0.000 | .185 | .000 | .522 | 1.917 |
| X6 | .125 | 0.000 | .209 | .000 | .553 | 1.809 |
| X7 | .125 | 0.000 | .178 | .000 | .712 | 1.706 |
| X9 | .125 | 0.000 | .181 | .000 | .567 | 1.765 |
| Model | R | R Square | Adjusted R Square | Std. Error of the Estimate | |
|---|---|---|---|---|---|
| 1 | 0.780a | 0.625 | 0.604 | 2.08625 | |
b. Dependent Variable: Y – Labor productivity
| ANOVAa | |||||
|---|---|---|---|---|---|
| Model | Sum of Squares | df | Mean Square | F | Sig. |
| Regression | 105.333 | 8 | 13.167 | 43.785 | .000b |
| Residual | 0.000 | 258 | 0.000 | – | – |
| Total | 105.333 | 266 | – | – | – |
b. Predictors: (Constant), X1, X2, X3, X4, X5, X6, X7, X9.
| No. | Effective factor | Impact Index | Rank |
|---|---|---|---|
| 1 | Factors relevant to the construction worker | 0.284 | 1 |
| 2 | Factors relevant to operation and management on construction site | 0.219 | 2 |
| 3 | Factors relevant to labor condition | 0.209 | 3 |
| 4 | Factors relevant to motivation | 0.203 | 4 |
| 5 | Factors relevant to tools and subject of labor | 0.185 | 5 |
| 6 | Factors relevant to working time | 0.183 | 6 |
| 7 | Factors relevant to natural environment | 0.181 | 7 |
| 8 | Factors relevant to labor safety | 0.178 | 8 |
| 9 | Factors relevant to project information | Not considered | |
| 10 | Factors relevant to socio-economic | ||
Adjustment coefficient R2 in this model, which is 0.625 > 0.5, affirms that impact factors determined by the model of the research are appropriate. This shows that there is a 62.5% variation in labor productivity of construction workers in Vietnam (Y) which is explained, in general, by the above defined 8 variables. This analysis ANOVA in Table 8, shows that parameter F has Sig. = 0, which proved recurrent construction model to be appropriate for the collected data.
6. RESULTS
Recurrent analysis results prove that independent variables in the model are appropriate and have statistical signification with meaning level 5% (Table 9).
“Factors relevant to construction worker” have the most significant impact on labour productivity of construction workers in Vietnam with coefficient β = 0.284.
“Factors relevant to operation and management on construction site” with coefficient β = 0.219 were 2nd in terms of their impact on labour productivity of construction workers in Vietnam.
“Factors relevant to labor condition” and “Factors relevant to motivation” have a positive effect on labour productivity of construction workers in Vietnam with almost the same coefficients β which are 0.209 and 0.203.
“Factors relevant to tools and subject of labor”, “Factors relevant to working time”, “Factors relevant to the natural environment” and “Factors relevant to labor safety” have a medium level of impact on labour productivity of construction workers in Vietnam.
“Factors relevant to project information” and “Factors relevant to socio-economic” were not considered because these factors were excluded from the formal research model. In other words, these factors have an inappreciable impact on labour productivity of construction workers in Vietnam.
CONCLUSION AND RECOMMENDATIONS
This research was carried out to evaluate influence factors on labor productivity of construction industry workers in Vietnam. Throughout the literature review, 10-factor groups impacting the labor productivity of construction workers in Vietnam were identified and listed. They are factors relevant to construction workers, factors relevant to site operation and management, factors relevant to motivation, factors relevant to working time, factors relevant to labor working tools, factors relevant to labor working conditions, factors relevant to working safety, factors relevant to project informations, factors relevant to natural environment, and factors relevant to socio-economic conditions. 267 questionnaires were collected for analysis. From data collected through the survey, the authors used regression analysis method to evaluate and rank the impact levels of these factor groups. To rely on the researching results, the authors highlighted the role of executive entrepreneurs in finding solutions in order to develop human resources, raise the quality of construction workers staff, manage missions and targets in building site, and at the same time improve working conditions to create motivation for workers. The authors also petition the government for promulgating policies which support enterprises to step up applying science, technology and modern technical methods of construction.
This research scope is limited to the construction industry in Vietnam and objects are factors impacting the labor productivity of construction workers. Further research should be carried out on other aspects such as civil projects, industrial projects, traffic projects, irrigation projects or technical lower-layer projects. One similar research is extremely indispensable for determining levels of impacted factors for the success of construction investment projects in the whole.
CONSENT FOR PUBLICATION
Not applicable.
AVAILABILITY OF DATA AND MATERIALS
Not applicable.
FUNDING
None.
CONFLICT OF INTEREST
The authors declare no conflict of interest, financial or otherwise.
ACKNOWLEDGEMENTS
Declared none.

