All published articles of this journal are available on ScienceDirect.

Development of an Artificial Intelligence Approach for Prediction of Consolidation Coefficient of Soft Soil: A Sensitivity Analysis
Authors Info & Affiliations
Abstract
Background:
Consolidation coefficient (Cv) is a key parameter to forecast consolidation settlement of soft soil foundation as well as in treatment design of soft soil foundation, especially when drainage consolidation is used in foundation treatment of soft soil.
Objective:
In this study, the main objective is to predict accurately the consolidation coefficient (Cv) of soft soil using an artificial intelligence approach named Random Forest (RF) method. In addition, we have analyzed the sensitivity of different combinations of factors for prediction of the Cv.
Method:
A total of 163 soil samples were collected from the construction site in Vietnam. These samples at various depth (m) were analyzed in the laboratory for the determination of clay content (%), moisture content (%), liquid limit (%), plastic limit (%), plasticity index (%), liquidity index (%), and the Cv for generating datasets for modeling. Performance of the models was validated using Mean Absolute Error (MAE), Root Mean Square Error (RMSE) and Correlation Coefficient (R) methods. In the present study, various combinations of soil parameters were applied and eight models were developed using RF algorithm for predicting the Cv of soft soil.
Results:
Results of model’s study show that performance of the models using different combinations of input factors is much different where R value varies from 0.715 to 0.822.
Conclusion:
Present study suggested that RF model with appropriate combination of soil properties input factors can help in better and accurate prediction of the Cv of soft soil.
1. INTRODUCTION
Consolidation coefficient (Cv) is one of the key parameters for soft soil foundation to forecast its consolidation settlement, which is proportional to dissipation rate of excess pore water pressure, and its value reflects consolidation rate of the soft soil [1, 2]. It is the vital parameter in treatment design of soft soil foundation, especially when drainage consolidation is used in foundation treatment of soft soil [1, 2]. The direct traditional method is to determine the Cv of each soil layer by collecting soil samples by drilling and conducting laboratory geotechnical tests on collected samples [3, 4]. Though accurate, it is very difficult to obtain undisturbed samples from each soft soil layer for laboratory testing. Moreover, the depth of the samples would be limited for the analysis [5, 6]. The influence of the thin sand interlayer in the soft soil makes it difficult to correctly determine the Cv in the laboratory [7]. As an alternative to laboratory and field tests, several empirical models have been developed to predict the Cv [4, 8]. These models are mainly based on improved regression analysis [9]. However, the regression method is having a limitation as the structure of the model is based on only a limited number of linear or nonlinear equations [10, 11].
Nowadays, Machine Learning (ML) or Artificial Intelligent (AI) methods have been applied widely in many fields including geotechnical engineerings, such as detecting landslides [12-17], predicting floods [18], mapping ground- water potential [19-21], and predicting material properties [22-31]. One of the ML ensemble machine learning method - Random Forest (RF) is widely used for classification, regression analysis, and prediction in various fields except in geotechnical engineering [32-34]. In this study, the main objective is to predict accurately the Cv of soft soil using an advance RF method which is one of the most effective ML techniques. In addition, we have analyzed the sensitivity of different combinations of factors for the prediction of the Cv. Model results were validated using standard statistical methods namely Mean Absolute Error (MAE), Root Mean Square Error (RMSE) and Correlation Coefficient (R) methods.
2. RESEARCH SIGNIFICANCE
In geotechnical problems, the Cv is an important factor which is used to evaluate and design the foundation of the buildings for the construction. To obtain this parameter, the experiments are traditionally carried out in the laboratory. However, this test takes time and expenses. Moreover, the accuracy of the test depends significantly on the collection of samples, expertize of the testers and quality of the experimental apparatuses. Therefore, a lot of studies have been conducted to correlate the Cv with other simple geotechnical parameters. However, this approach has a limitation of considering the only limited number of parameters in the correlation process. Therefore, in this study, we have used advanced ML method-RF to predict the Cv. Advantage of the RF method is that it can consider many input factors and discover even complicated relationship between the input factors and output variable. Therefore, this ML approach is expected to provide higher prediction accuracy than traditional methods and thus would help in reducing the time and cost of the construction investigation.
3. MATERIALS AND METHODS
3.1. Data Used
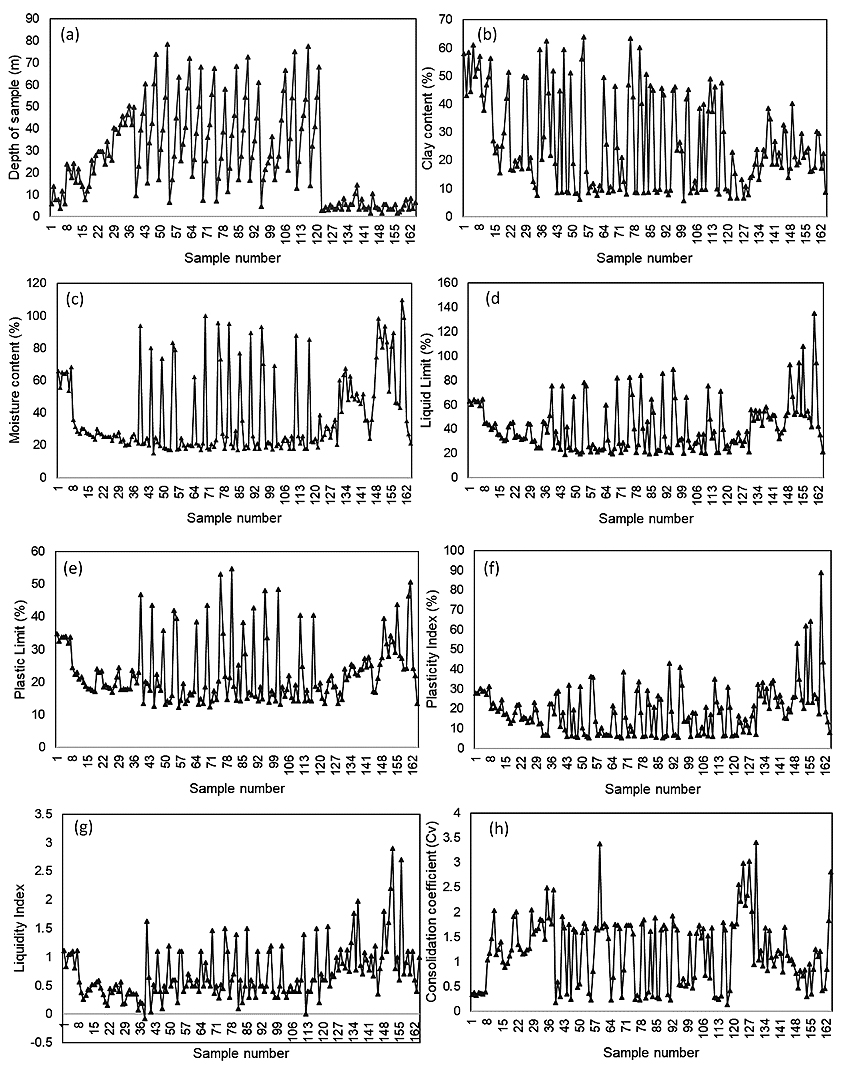
In the current study, a total number of 163 soil samples were analyzed in the laboratory and database for modeling was prepared considering depth of sample (m), clay content (%), moisture content (%), liquid limit (%), plastic limit (%), plasticity index (%) and liquidity index (%). These parameters were considered as independent input variables X1, X2, X3, X4, X5, X6, and X7, respectively to obtain the Cv (Y) as an output variable. Initial analysis of the data used is presented in Table 1. Data collected were then randomly divided into two parts of the training dataset (70%) used for training the models and validating dataset (30%) used for validating the models using Matlab software.
3.1.1. Depth of Sample
Depth of the collected sample affects the consolidation of soil with depth. It is considered as an important input factor in the prediction problem of the Cv. In this study, samples from varying depths between 1.6m and 78.5m were analyzed in Fig. (1a) and Table 1.
3.1.2. Clay Content
Clay content (μ) is defined as the percentage of clay particles which has a size of 0.002 and 0.005mm in the soil samples affecting shear strength of soils. It is considered as an important input factor in the prediction of the Cv. The clay content of the samples was determined in the laboratory and grain size distribution analysis was done based on the following equation 1 [35]:
 |
(1) |
where M0.005 is the mass of soil passing through 0.005mm sieve, where Msum is the total mass of the soil sample. In this study, the amount of clay of soil samples varies from 5.7% to 64% Fig. (1b and Table 1).
3.1.3. Moisture Content
Moisture content (ω) is defined as the proportion of the specific volume of water to the weight of solids of soil [35]. It is one of the important variables in reducing cohesive forces between soil particles, shear strength of soils, and even causes the saturation of soils [36]. It is one of the important affecting factors for prediction of the Cv. Moisture content can be calculated using the following equation 2 [37]:
| No. | Component | Minimum | Maximum | Mean | Standard Deviation |
|---|---|---|---|---|---|
| 1 | X1 | 1.6 | 78.5 | 26.601 | 20.842 |
| 2 | X2 | 5.7 | 64 | 25.995 | 16.882 |
| 3 | X3 | 15.09 | 109.9 | 38.227 | 24.652 |
| 4 | X4 | 18.9 | 135.13 | 41.723 | 20.541 |
| 5 | X5 | 12.2 | 54.8 | 22.946 | 9.496 |
| 6 | X6 | 5.14 | 88.84 | 18.778 | 12.406 |
| 7 | X7 | -0.08 | 2.9 | 0.708 | 0.471 |
| 8 | Y | 0.126 | 3.415 | 1.21 | 0.705 |
 |
(2) |
where Ww is the weight of water of soil sample, is the weight of solids of soil sample, Ws is the mass of water of soil sample, Ww is the mass of the solids of soil sample, Ws and is the gravity acceleration (
 ). In this study, the moisture content of samples varies from 15.09% to 109.9% Fig. (1c and Table 1).
3.1.4. Liquid Limit
Liquid limit (LL) is defined as the moisture content at the point of transition from plastic liquid state [35]. It has an inverse relationship with a shear strength of soils when shear strength increases the liquid limit decreases [36]. The widespread laboratory method for calculation of liquid limit is Atterberg tools which are based on the following equation 3 [35]:
 |
(3) |
where Wliquid is the weight of water of soil sample at the point of transition from plastic to a liquid state. In this study, the liquid limit values of soil samples range from 18.9% to 135.13% (Fig. 1d and Table 1).
3.1.5. Plastic Limit
Plastic Limit (PL) is determined as the moisture content at the point of transition from semisolid to plastic state PL is having a direct relationship with the shear strength of soils [38]. It can be calculated using the following equation (4):
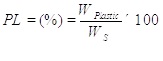 |
(4) |
where Wplastic is the weight of water of soil sample at the point of transition from semisolid to a plastic state. In this study, the plastic limit values of samples range from 12.52% to 54.8% (Fig. 1e and Table 1).
3.1.6. Plasticity Index (PI)
Plasticity index (PI) is a range of water contents where the soil exhibits plastic properties. It is the difference between the liquid limit and the plastic limit (PI = LL-PL). Soils with a plasticity index of high, low and zero (non-plastic) tend to be clay, silt and little or no silt or clay, respectively. In this study, plasticity index values of samples range from 5.14% to 88.4% (Fig. 1f and Table 1).
3.1.7. Liquidity Index (LI)
Liquidity Index (LI) is a proportion of closeness of water content of a soil sample to its liquid limit. It can be obtained as follow eq. 5:
 |
(5) |
where W is the natural water content. Value of liquidity index is negative when the water content is smaller than the plastic. Zero value of LI indicates when LI has an equal portion of PI in LL of soil. Whereas value 1 of the liquidity index would be at its liquid limit [39]. In this study, LI values of samples range from -0.08 to 2.9 (Fig. 1g and Table 1).
3.1.8. Consolidation Coefficient (Cv)
Consolidation coefficient (Cv) governs the rate by which compression can occur in a particular soil when subjected to an increase in pressure. The Cv describes the rate at which saturated clay or other soil undergoes consolidation or compaction. The rate and amount of compression in soils varies with the rate at which pore water is lost which depends on the permeability of the soil and measured in square centimeters per second. In the laboratory, the Cv can be determined by measuring the change in height of a soil sample by increasing load in increments [35]. In this study, the Cv values of 163 soil samples determined in the laboratory range from 0.126 to 3.415 (Fig. 1h and Table 1).
3.2. Methods Used
3.2.1. Random Forest
Random Forest (RF) which is decision tree classifier was applied in the present study which was proposed by Breiman [40] which pools the predictions of each single decision tree algorithm by means of a rule-based method. Tree constructed-knowledge algorithms are one of the popular and mostly used supervised learning methods [40, 41]. Tree-based methods allow analytical models with high accuracy, ease of interpretation and permanency in contrast to linear models. The RF is an ensemble learning method for classification, regression and other tasks, which operate by constructing a multitude of decision trees at training time and outputting the class that is the means of the classes (classification) or mean prediction of the individual trees [42, 43]. The RF works for both categorical and continuous input and output parameters. To induce the RF, recursive screening and multiple regressions are performed from the data set. From the root node, the data dividing process in each internal node of a rule of the trees is repeated until a stop condition previously specified is stretched. Each of the terminal nodes, or leaves, has committed to it a simple regression model which applies in that node only [32]. Once the tree’s induction process is ended, pruning could be applied with the target of improving the tree’s generalization ability by tumbling its structural complication. The number of cases in nodes is taken as pruning benchmarks. Additionally, to evaluate the importance of each parameter, the RF shifts one of the input parameters, while retaining the rest constants, and it measures the decrease in accuracy which has taken place by means of the error assessment [40].
As for regression, the RF constructs a number K of regression trees and averages the results. After K such trees
 are grown, the RF regression predictor is as follows eq. 6:
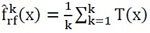 |
(6) |
3.2.2. Validation Criteria
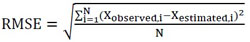
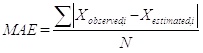
Validation process comprises the evolution of the predictive performance of the methods [44-48]. The predictive performance is a very important step in any method, and without appropriate validation, the actual predictive capability of the model cannot be scientifically judged [49, 50]. In this study, the accuracy of the model is verified based on several error analysis methods, such as scatter plot, the Mean Absolute Error (MAE), root mean square error (RMSE) and Correlation Coefficient (R). Scatter plot is broadly used to verify the accuracy of estimation.
RMSE has been applied as a regular statistical metric to measure model performance [51, 52]. RMSE is a very useful indicator to measure the differences between estimated values and observed values, which is the standard deviation of estimated errors [53, 54]. This individual difference can be aggregated into a single measure of predictive power. Lower values of RMSE indicate a better result. It has been widely used in different fields around the world [23, 55, 56]. MAE measures the mean absolute value of each difference. Compared with RMSE, MAE can be given to be a more natural and unambiguous index to measure errors between estimated and actual observed values [57, 58]. R is a statistical measure, which represents the percentage of the variance for a dependent variable that is explained by an independent variable. They are usually computed by the equations (7 and 8) as below [59]:
 |
(7) |
 |
(8) |
 |
(9) |
where N is the total number of the samples, Xobserved and Xestimated are the actual values determined from the experiments and the predicted values determined from the models, respectively.
4. METHODOLOGY
Methodology of this study was carried out in three main steps to simulate the Cv of soft soils (Fig. 2): (1) data preparation was carried out to construct the variables, a total of 163 soil sample were analyzed in the laboratory and the dependent and independent variables such as depth of sample (m), clay content (%), moisture content (%), liquid limit (%), plastic limit (%), plasticity index (%), liquidity index (%) which are considered as independent variables X1, X2, X3, X4, X5, X6 and, X7, respectively and the Cv (Y) is considered as an output variable; (2) a sensitivity analysis was done on different combinations of input variables using the RF to develop various models, the Cv was simulated and predicted based on the training dataset and RF algorithm; (3) modeling evaluation, the obtained Cv from the modeling process was evaluated based on the error’s metric including RMSE, MAE and R.
5. RESULTS AND ANALYSIS
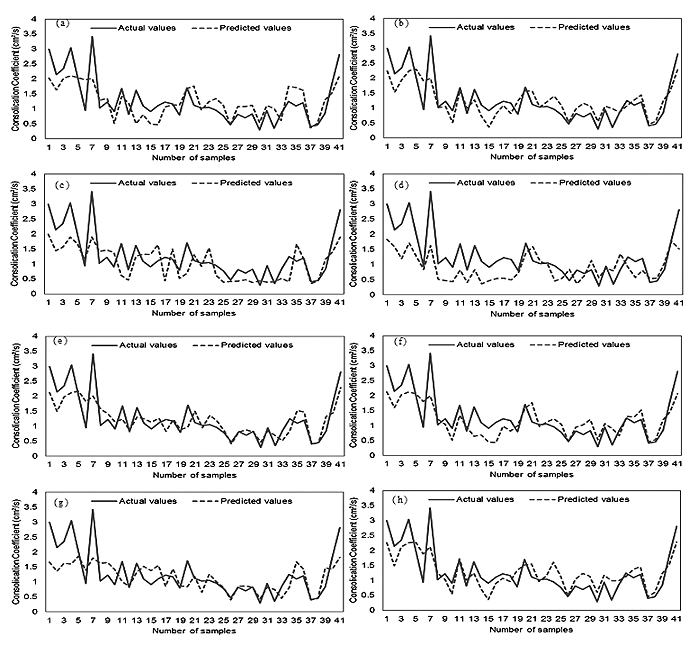
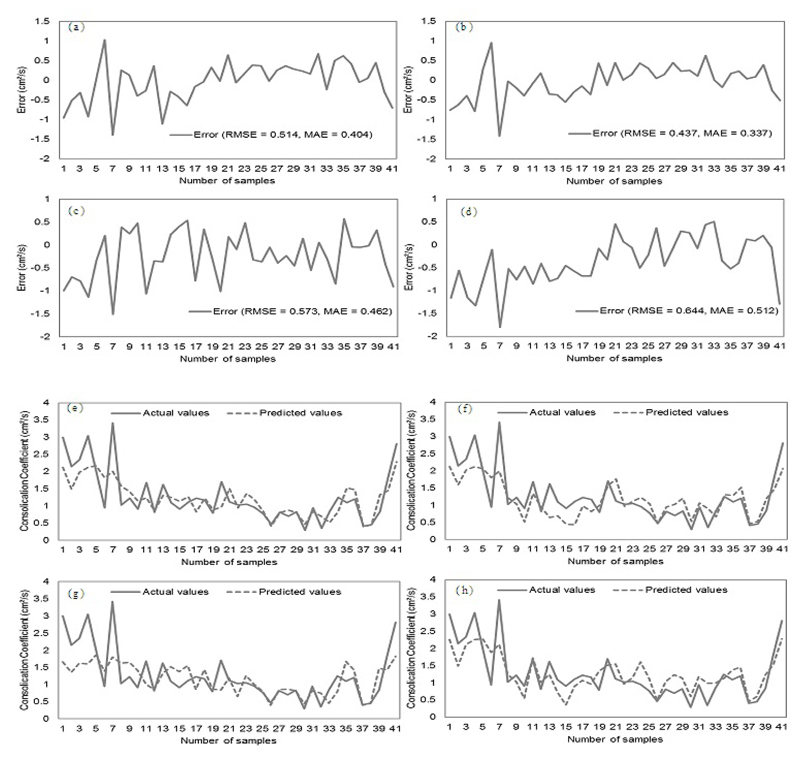
In this study, the RF method was used for the development of different models based on the various combinations of independent variables to simulate the Cv of soft soil. Using training dataset, the RF algorithm was trained and constructed to predict the Cv of the soft soil. Validation results of the models are shown in Table 2, Fig. (3, 4 and 5). Out of these, Fig. (3) shows graphically the relationship between the number of soil samples and the predicated and actual Cv values. The results of the training process confirmed that model 2 had the highest performance and goodness-of-fit besides best concordance between the actual and predicted Cv values. In terms of RMSE criteria, also model 2 has the lowest value and therefore, it was the best model in performance. In comparison, the performance of model 4 with RMSE value 0.644 was the least (Table 2 and Fig. 4). According to the MAE, the result was slightly different in comparison to the RMSE and R coefficients (Table 2 and Fig. 4). In the case of model 5, result gave the lowest value of MAE (0.332); followed by model 2, model 8, model 6, model 1, model 7, model 3, and model 4 Table 2.
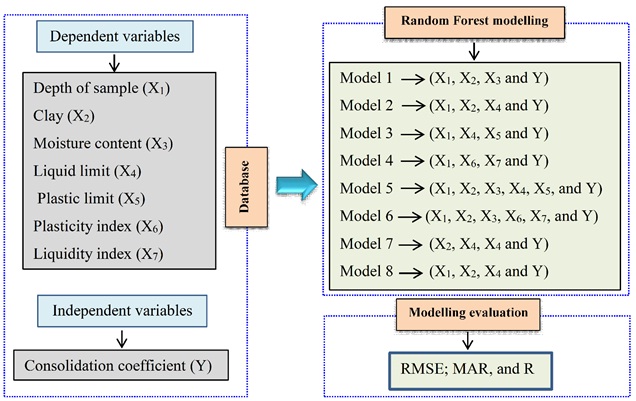
Fig. (2). Methodology chart of the study.
| No. | Models | Input Variables Used | RMSE | MAE | R |
|---|---|---|---|---|---|
| 1 | Model 1 | X1, X2, X3 | 0.514 | 0.404 | 0.725 |
| 2 | Model 2 | X1, X2, X4 | 0.437 | 0.337 | 0.822 |
| 3 | Model 3 | X1, X4, X5 | 0.573 | 0.462 | 0.715 |
| 4 | Model 4 | X1, X6, X7 | 0.644 | 0.512 | 0.723 |
| 5 | Model 5 | X1, X2, X3, X4, X5 | 0.444 | 0.332 | 0.820 |
| 6 | Model 6 | X1, X2, X3, X6, X7 | 0.477 | 0.365 | 0.787 |
| 7 | Model 7 | X2, X3, X4 | 0.571 | 0.422 | 0.668 |
| 8 | Model 8 | X1, X2, X4 | 0.441 | 0.354 | 0.815 |
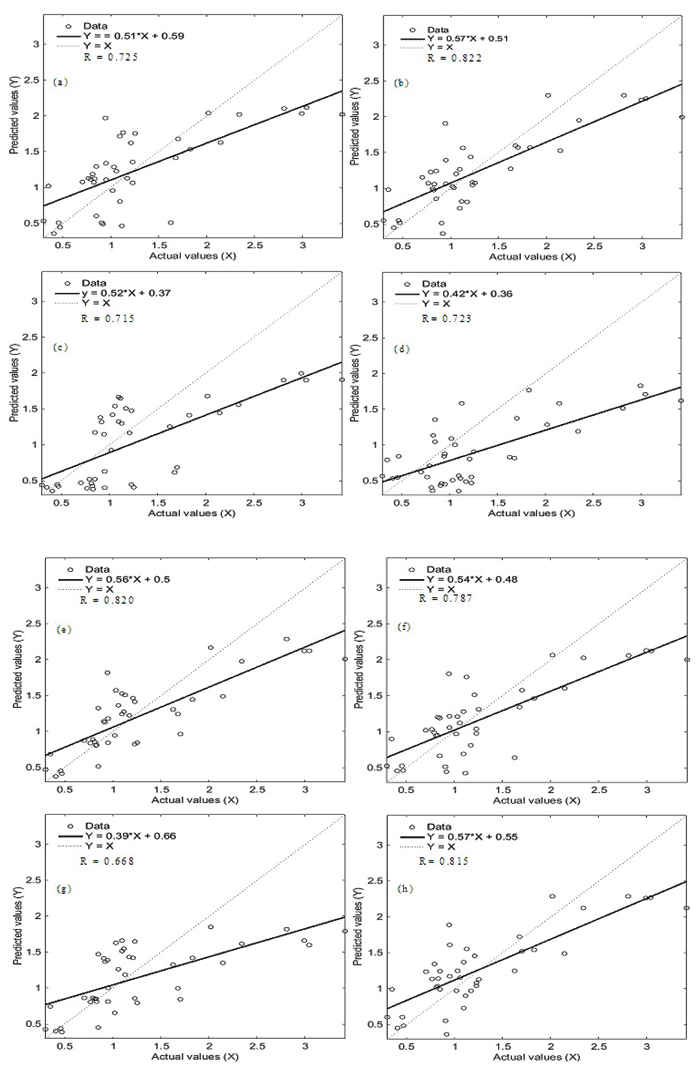
In terms of the R analysis, the results of validation dataset Fig. (5) illustrate that the R measure for all models had values ranging from 0.668 to 0.822. It implies that all eight models had an acceptable prediction power of the Cv of sot soils, and model 7 had relatively poor prediction accuracy in the current study. Moreover, it was observed that model 2 had the highest prediction accuracy (R=0.822).
Overall, all results state that model 2 has a good performance and prediction accuracy for the simulation of the Cv. The result of model 2 indicates that independent variables including depth of sample (X1), clay (X2) and liquid limit (X4) have a more important role for the simulation of the Cv (Y) of soft soil in comparison to other factors in this study.
6. DISCUSSION
In the analysis of the stability of civil engineering structures especially on soft soil, the Cv is an important factor to be considered in the design of embankment, bridges, tall buildings and other structures. This can be determined either in the laboratory or by in situ testing. Collection of undisturbed samples for the laboratory tests is very difficult. Field tests to estimate the Cv are costly and time-consuming, hence, it is not always possible to perform enough tests to achieve satisfactory results [60]. Therefore, the prediction of geo-mechanical properties of soils based on limited laboratory and field tests using ML techniques would be more appropriate [61, 62]. In this study, the RF, which is one of the well-known ML methods, was used for the prediction of the Cv of soft soil.
In this study, the results of the analysis of the models using validation dataset indicate that out of the eight models, only model 7 had lower prediction capability (R<0.7). Other models had a good capability (R>0.7), whereas model 2 had the highest prediction capability (R=0.822) in which depth of sample, clay and liquid limit were the most significant variables in the modelling process. Thus, it can be stated that the model 2 had better ability in decreasing the noise and over-fitting problem than the other models. This result was in agreement with Puri et al. [62] who evaluated some ML algorithms for the prediction of geotechnical parameters (compression coefficient, liquid limit and void ratio) including linear Regression (LR), Artificial Neural Network (ANN), support vector machine (SVM), Random Forest (RF) and M5 decision tree (M5P), and stated that the M5P and RF algorithms were powerful algorithms in comparison to the other models.
In addition, Bui et al. [63] based on the optimization algorithms used twelve factors for computing the compression coefficient including depth of sample, sand percentage, loam percentage, clay percentage, moisture content percentage, wet density, dry density, void ratio, liquid limit, plastic limit, plastic index, and liquidity index. Their results indicated that the proposed Particle Swarm Optimization in combination with a neural network, PSO-MLP Neural Nets, had the highest prediction accuracy and all variables were considered as effective variables for the modeling process. The main difference of this study with Bui et al. [63] is that in the current study, different models under different scenarios of variables were considered and the best one with the most perdition accuracy was selected to reduce and prevent noise and over-fitting problems. It implies that although all variables may be important for modeling; however, changes in the number of inputs affected the results of modeling which have been proved by this study. It is in agreement with Pham, et al. [24] who reported that the performance of the results of the model used for prediction of soil mechanic characteristics can be changed due to the bias of outcomes of variables.
In general, since estimating geotechnical parameters in the laboratory sometimes is facing challenges due to many affecting factors. Application of the ML methods can be considered as an effective and promising tool to decrease time, cost and errors as an alternative. In the present study, RF models generated under the different combinations of input variables predicted the Cv of soft soils with good correlation coefficient (R) (>0.7) except for model 7. Based on the results of this study, we can suggest that RF algorithm is a useful and applicable tool to predict the Cv of soft soil, and three key factors depth of sample, clay and liquid limit are the most important factors for prediction of the Cv.
CONCLUDING REMARKS
Estimation of the Cv of soft soil is important in the designing of civil engineering structures which are to be founded on soft soil. There are so many constraints in determining the Cv in the laboratory as well as in the field. Therefore, in this study, attempt has been made to use alternative ML method namely RF to predict Cv based on the other geomechanical properties of soil with limited soil testing. With this objective, the RF algorithm, which is considered as one the best ML method in solving prediction problems, was applied in this study. For this purpose, different models were developed based on the various combinations of input variables used to predict the Cv of soft soil using the RF method. Out of the eight models, the result of model 2 (R=0.822) is the best whereas the other seven models also showed good predictive capabilities. Therefore, it can be concluded that model based on the ML method such as RF model can be effectively applied in the field of geotechnical engineering including prediction of geomechanical properties. However, the care has to be taken that model input parameters should be based on the soil condition of similar lithology of the study area. It is proposed to evaluate further prediction capability of the RF model with other combination of input data in other areas also for wider application of this methodology. In addition, other machine learning models like ANN or SVM need to be evaluated to confirm the prediction capability of the RF model as the best model in accurate determination of the Cv.
CONSENT FOR PUBLICATION
Not applicable.
AVAILABILITY OF DATA AND MATERIALS
The data that support the findings of this study are available from the corresponding author upon request.
FUNDING
Material support from the African Union Commission (AUC) and Africa-ai-Japan Project 2018-2019 to carry out the experiment is gratefully acknowledged.
CONFLICT OF INTEREST
The authors declare no conflict of interest, financial or otherwise.
ACKNOWLEDGEMENTS
Author Contributions: Conceptualization, A.M.W., W.O.O. and T.N.; Methodology, A.M.W., W.O.O. and T.N.; Experiment and data collection, A.M.W.; software, A.M.W.; Analysis, A.M.W.; writing-original draft preparation, A.M.W.; writing-review and editing, A.M.W., W.O.O. and T.N.

