All published articles of this journal are available on ScienceDirect.
Finite Element Analysis of Bolted T-Stubs Undergoing Large Displacement: A Preliminary Study
Abstract
Background:
In recent years, there have been increased interests by the steel structures community to characterise the large-deformation response of T-stubs to evaluate the deformation capacity of bolted joints. However, little information exists on the influence of second-order effects on the response of bolted T-stubs and, consequently, there are no existing guidelines on how to include these effects in de-sign.
Objective:
In this paper, we assess the influence of second-order effects in T-stubs bolted to a rigid support through a parametric investigation, using finite element analysis.
Methods:
Both material and geometrical non-linearities were considered since they are known to have a critical impact upon the performance of T-stubs. A benchmark model is first generated and validated and then used to carry out a parametric investigation. A method to assess the contributions of membrane forces to the overall deformation response of a T-stub is also proposed based on the introduction of a non-dimensional parameter Ψ.
Results:
The combination of geometric parameters that are most affected by second order effects, induced by large displacement, was identified. A direct correspondence was found between the extent of second order effects that has developed and the index Ψ: a higher index implies a greater influence by second order effects.
1. INTRODUCTION
To properly assess the robustness of steel Moment Resisting Frames (MRFs), the large displacement response of the joints must be evaluated. Spare deformation capacity must be built into the connections to ensure smooth load trans-mission between beams and columns if catenary effects develop in the beam member. The rotation capacity of bolted joints, for which no guidelines currently exist in Eurocode 3 (EC3) [1], in particular for extreme load cases, is strongly linked to the non-linear behavior of its components. For example, to the end-plate whose performance can be predicted by using an equivalent T-stub model. Sources of non-linearity can arise from both geometry (large displacements) and the material used to construct the T-stub. Although the effects of material non-linearity are already well known [2], limited information exists on the influence of geometric non-linearity on the response of bolted T-stubs; consequently, there are almost no guidelines on how to include its effect in design.
In recent years, there have been increased interests by the steel structures community to characterise the non-linear response of T-stubs in order to evaluate the deformation capacity of bolted joints and to update the Eurocodes accord-ingly. Existing design guidelines do not fully exploit the plastic capacity of joints, which are highly dependent upon the geometry of its components [3-5]. In extreme load cases such as seismic loading or the catastrophic loss of a critical column in a structure, components such as the T-stub need to undergo large displacement to ensure that sufficient duc-tility develops in the connection. Latour and Rizzano [6] have noted that second order effects induced by large dis-placements only develop in T-stubs that had undergone significant global displacement. The critical displacement at which second order effects become dominant corresponds to the development of a new hardening branch in its global force – displacement (F – Δ) curve. Zhao et al. [7] also highlighted the characteristic shape of the F – Δ curve for a T-stub as it undergoes large displacement - the second order effects arise from axial (membrane) deformation in the flange from its undeformed T-configuration. However, it is as yet unclear on how to quantify membrane effects in T-stubs.
This paper presents the results of a preliminary FE investigation into the influence of second order effects on the de-formation capacity of T-stubs. A benchmark FE model is first developed using ABAQUS, which includes both material and geometrical non-linearities, and its predictions are validated against existing experimental data compiled from the literature [6]. Using this FE model of the T-stub, a parametric investigation of 48 different T-stub geometries will be per-formed. Each model is analysed twice, with and without geometric non-linearity, in order to identify those geometric configurations that experience significant second order effects. A method of assessing the contributions of membrane effects is proposed.
2. IMPLEMENTATION OF NUMERICAL MODELS
A finite element (FE) model is implemented in ABAQUS/Standard to reproduce the behavior of a T-stub subjected to quasi-static tensile loading. Two benchmark cases – identified here as TS01 and TS02 – are modelled first [6].

2.1. Reference FE Models
The FE models consist of a T-section bolted to a rigid support by means of two bolt-rows as shown in Fig. (2). Symmetry is exploited so that only one quarter of the real assembly needs to be modelled and loading is applied through dis-placement boundary conditions imposed on the top of the web, at a rate of 0.01 mm/s, as per experiments. The specimens are made of bolt grade 8.8, structural steel S275 (TS01) and S355 (TS02). Material non-linearity is considered by specifying a non-linear true stress versus logarithmic plastic strain relationship as shown in Fig. (1). The material description adopted is based on the conventional J2 plasticity constitutive relation with linear isotropic hardening. ABAQUS progressive damage and failure criterion for ductile metals [10] is implemented for both the flange and bolt. Calibration of damage parameters was performed according to procedures described by Pavlović et al. [2]. A preload level, generating a pre-stress in the bolt corresponding to 80% of the yield stress, is applied to the bolts. The bolt shank is modelled as a cylinder with a cross-section equal to the nominal circular gross area of the bolt [8]. The bolt and rigid support are meshed using three-dimensional 8-node linear brick elements with reduced integration (C3D8R), while its full integration counterpart (C3D8) is used to mesh the T-section [10]. Surface-to-surface contact formulation with small sliding, and a coefficient of friction μ = 0.25, was specified for all contact pairs (top and bottom flanges, bolt heads/nuts and flanges, bolt shaft and hole). The mesh size was chosen after performing a sensitivity analysis by following existing guidelines in [11]. A minimum element size of 5, 7 and 2 mm was used, respectively, for the T-section, the rigid support and the bolts. The FE model contains at least 2 elements through the thickness of the T-section as shown in Fig. (2a). Predictions by the FE models were validated against experimental data by comparing to their global F-Δ relationship as shown in Fig. (2b), and the predicted deformed shape is compared to its experimental counterpart as shown in Fig. (3).
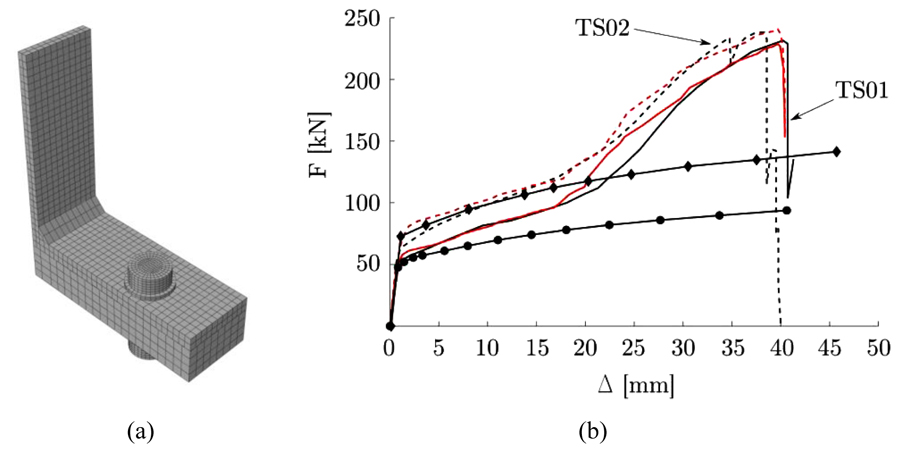
 (TS01) and
  (TS02) are numerical predictions. and are the corresponding numerical results if geometric non-linearities are ignored.
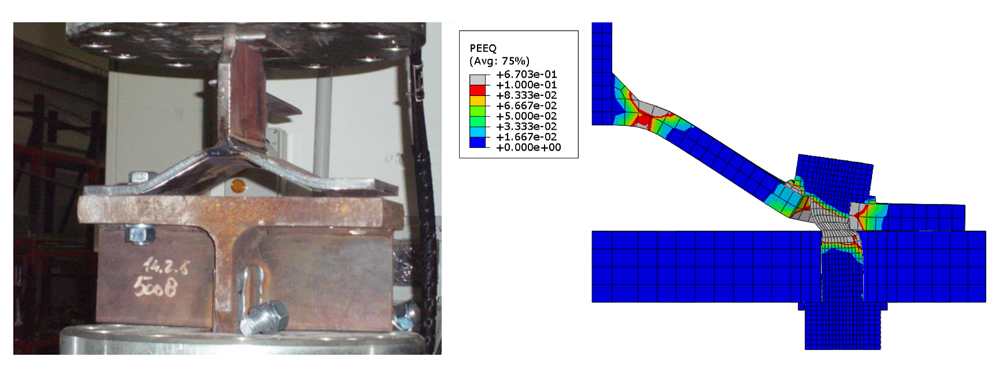
2.2. Parametric Study
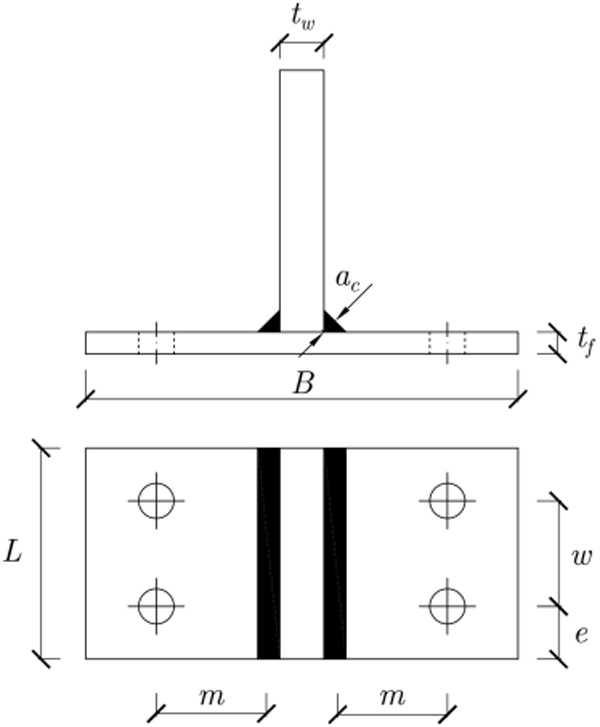
A parametric study of 48 different T-stub geometries is performed. Symmetry, load application, mesh and contact definition are similar to the ones employed in the TS01 and TS02 models; the material properties specified were also identical the ones used in TS01. With reference to Fig. (4), the geometries of the respective T-stub models are tabulated in Table 1. Hereinafter, the models will be denoted by Mx-y-z where x is the bolt diameter db, y is m/db and z if the thickness of the flange tf.
| db | m/db | B | w | e | db | m/db | B | w | e | db | m/db | B | w | e |
|---|---|---|---|---|---|---|---|---|---|---|---|---|---|---|
| 16 | 2 | 164 | 48 | 24 | 18 | 2 | 164 | 54 | 27 | 20 | 2 | 164 | 60 | 30 |
| 16 | 2 | 164 | 48 | 24 | 18 | 2 | 164 | 54 | 27 | 20 | 2 | 164 | 60 | 30 |
| 16 | 2 | 164 | 48 | 24 | 18 | 2 | 164 | 54 | 27 | 20 | 2 | 164 | 60 | 30 |
| 16 | 2 | 164 | 48 | 24 | 18 | 2 | 164 | 54 | 27 | 20 | 2 | 164 | 60 | 30 |
| 16 | 3 | 196 | 48 | 24 | 18 | 3 | 196 | 54 | 27 | 20 | 3 | 196 | 60 | 30 |
| 16 | 3 | 196 | 48 | 24 | 18 | 3 | 196 | 54 | 27 | 20 | 3 | 196 | 60 | 30 |
| 16 | 3 | 196 | 48 | 24 | 18 | 3 | 196 | 54 | 27 | 20 | 3 | 196 | 60 | 30 |
| 16 | 3 | 196 | 48 | 24 | 18 | 3 | 196 | 54 | 27 | 20 | 3 | 196 | 60 | 30 |
| 16 | 4 | 228 | 48 | 24 | 18 | 4 | 228 | 54 | 27 | 20 | 4 | 228 | 60 | 30 |
| 16 | 4 | 228 | 48 | 24 | 18 | 4 | 228 | 54 | 27 | 20 | 4 | 228 | 60 | 30 |
| 16 | 4 | 228 | 48 | 24 | 18 | 4 | 228 | 54 | 27 | 20 | 4 | 228 | 60 | 30 |
| 16 | 4 | 228 | 48 | 24 | 18 | 4 | 228 | 54 | 27 | 20 | 4 | 228 | 60 | 30 |
| 16 | 5 | 260 | 48 | 24 | 18 | 5 | 260 | 54 | 27 | 20 | 5 | 260 | 60 | 30 |
| 16 | 5 | 260 | 48 | 24 | 18 | 5 | 260 | 54 | 27 | 20 | 5 | 260 | 60 | 30 |
| 16 | 5 | 260 | 48 | 24 | 18 | 5 | 260 | 54 | 27 | 20 | 5 | 260 | 60 | 30 |
| 16 | 5 | 260 | 48 | 24 | 18 | 5 | 260 | 54 | 27 | 20 | 5 | 260 | 60 | 30 |
3. ASSESSMENT OF MEMBRANE FORCES IN THE FLANGE
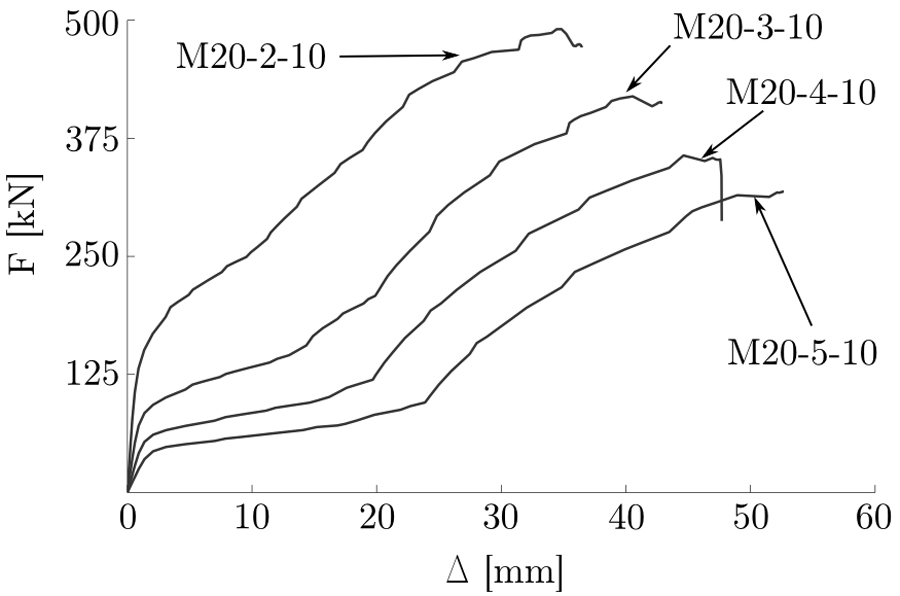
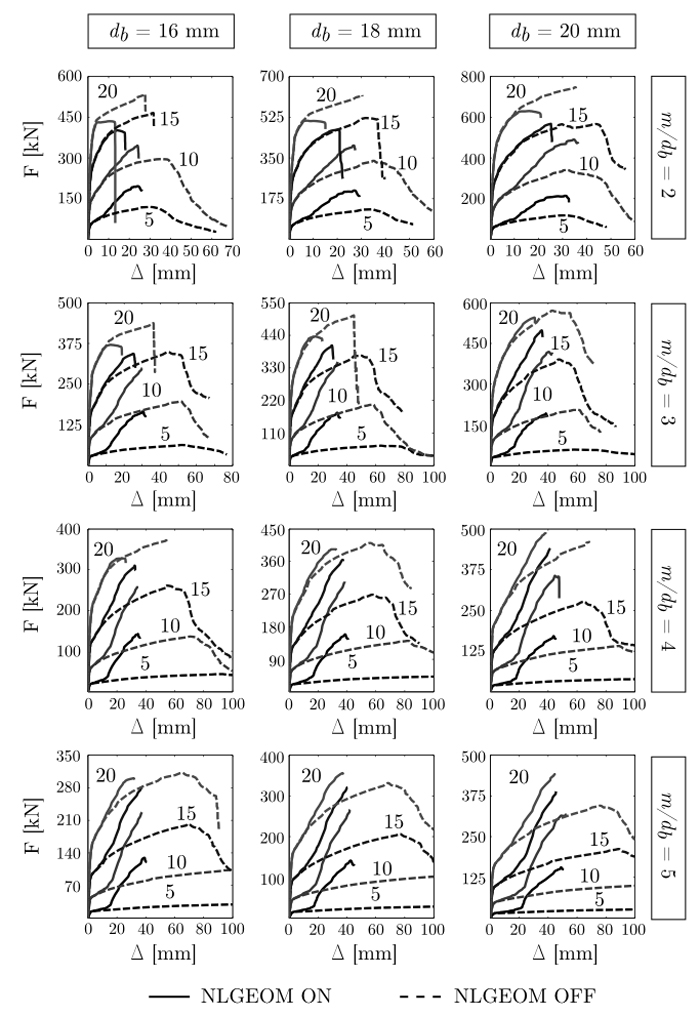
Results of the parametric study are presented in Figs. (5 and 6). A larger global displacement is achieved with an in-creased m/db, as shown in Fig. (5) while it is evident that an increase in either db or tf leads to a greater resistance to deformation by a bolted T-stub. Each model is analysed twice, with and without geometric non-linearity, in order to identify the combination of geometric parameters that are most likely to experience second order effects induced by large displacement. Geometric non-linearity is switched one and off, via the NLGEOM option in ABAQUS [9]. As shown in Fig. (6), second order effects are negligible for T-stubs with small m/db and high tf. This is because the failure mechanism in these T-stubs is dominated by bolt fracture in tension before the flange undergoes large geometrical changes. By contrast, geometric configurations characterized by high m/db and thin flanges are strongly affected by geometric non-linearities, also reported by Zhao et al. [7]. These large geometrical changes give rise to a deformation response which is characterized by the development of a second hardening branch in their corresponding F – Δ curve. In general, the development of the second hardening branch is an indicator that significant membrane forces had developed in the flange.
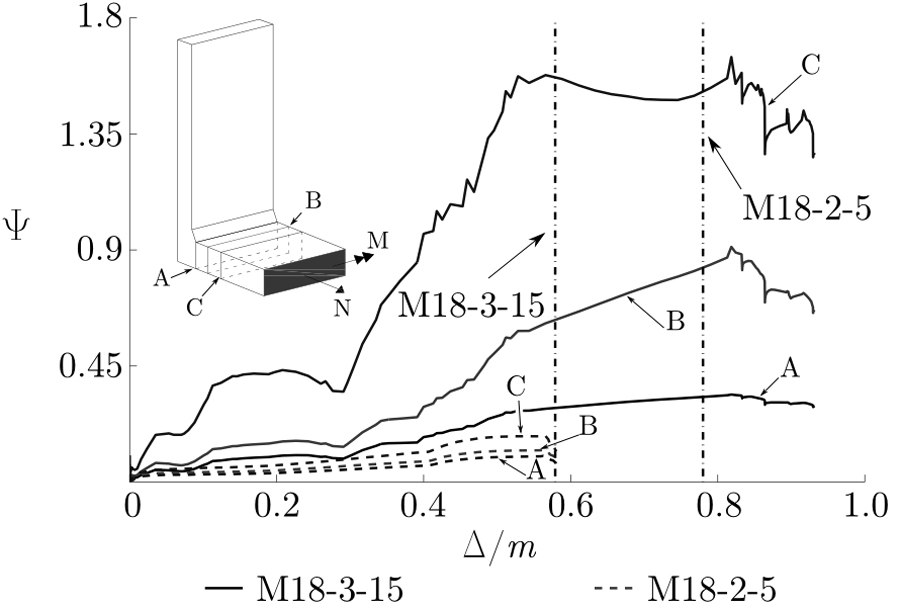
A preliminary method to evaluate the significance of membrane forces in the flange is proposed here. Values of bending moment M and axial force N were obtained from ABAQUS via the Free Body Cut tool for three consecutive sections of the flange as shown schematically in Fig. (7). We define a non-dimensional index Ψ defined as
 |
(1) |
where Npl and Mpl are the plastic bending moment and axial force resistances of the cross-section, respectively. For every FE model that was analysed – note that geometric non-linearity is accounted for - this index is plotted against the non-dimensional displacement (Δ/m). A threshold corresponding to Δu/m, where Δu is the ultimate displacement, is taken as a reference value to evaluate the extent of the membrane forces that had developed in the flange. The minimum value of Ψ at Δu/m for the three reference cross-sections – this generally coincides with section A since M is maximum at that location - is tabulated in Table 2. Fig. (7) plots two typical examples, where Ψ ≈ 0 (M18-3-15) and Ψ >> 0 (M18-2-5). Comparing the F - Δ curves in Fig. (5) with their corresponding index Ψ given in Table 2, it is evident that the models that are most affected by second order effects are, in fact, the ones with a greater Ψ value. Moreover, Fig. (7) shows that high values of Ψ were also obtained for Δ/m << Δu/m. The results highlight the need for a more general criterion to determine a lower bound for Ψ above which geometric non-linearity cannot be neglected.
| Model | Ψ | Model | Ψ | Model | Ψ |
|---|---|---|---|---|---|
| M16-2-5 | 0.25 | M18-2-5 | 0.34 | M20-2-5 | 0.29 |
| M16-2-10 | 0.23 | M18-2-10 | 0.30 | M20-2-10 | 0.33 |
| M16-2-15 | 0.03 | M18-2-15 | 0.05 | M20-2-15 | 0.07 |
| M16-2-20 | 0.02 | M18-2-20 | 0.02 | M20-2-20 | 0.02 |
| M16-3-5 | 0.29 | M18-3-5 | 0.41 | M20-3-5 | 0.32 |
| M16-3-10 | 0.31 | M18-3-10 | 0.36 | M20-3-10 | 0.31 |
| M16-3-15 | 0.09 | M18-3-15 | 0.11 | M20-3-15 | 0.20 |
| M16-3-20 | 0.03 | M18-3-20 | 0.03 | M20-3-20 | 0.09 |
| M16-4-5 | 0.33 | M18-4-5 | 0.45 | M20-4-5 | 0.34 |
| M16-4-10 | 0.35 | M18-4-10 | 0.39 | M20-4-10 | 0.31 |
| M16-4-15 | 0.12 | M18-4-15 | 0.14 | M20-4-15 | 0.20 |
| M16-4-20 | 0.05 | M18-4-20 | 0.05 | M20-4-20 | 0.09 |
| M16-5-5 | 0.32 | M18-5-5 | 0.47 | M20-5-5 | 0.35 |
| M16-5-10 | 0.37 | M18-5-10 | 0.41 | M20-5-10 | 0.40 |
| M16-5-15 | 0.14 | M18-5-15 | 0.16 | M20-5-15 | 0.20 |
| M16-5-20 | 0.06 | M18-5-20 | 0.05 | M20-5-20 | 0.09 |
CONCLUSION
This paper presents the results of a preliminary FE investigation into the influence of second order effects on the de-formation capacity of T-stubs. A parametric study of 48 different T-stub geometries was performed. The combination of geometric parameters that are most affected by second order effects, induced by large displacement, was iden-tified. A preliminary method, using a non-dimensional index Ψ, is proposed to assess the contribution of membrane ef-fects in the flange. Results show that there is a direct correspondence between the extent of second order effects that has developed with the index Ψ: a higher index implies a greater influence by second order effects. The methodology proposed here is the subject of an ongoing investigation which will be published elsewhere.
CONSENT FOR PUBLICATION
Not applicable.
CONFLICT OF INTEREST
The authors declare no conflict of interest, financial or otherwise.
ACKNOWLEDGEMENTS
Declared none.

