All published articles of this journal are available on ScienceDirect.

Energy Renovation of Buildings the Skin of a Building 70’s Housing Developments in Barcelona Montbau’s Housing Developments Renovation
Authors Info & Affiliations
Abstract
This study, considering the current conditions of our planet, proposes to analyze how efficient is to renovate building skins to meet energy, economic, and CO2 emission criteria.
A building envelope is the part of a building that is most exposed to weather conditions and therefore it has an impact on the internal energy demand of its inhabitants so that they can comfortably there. Studying building skins and their status in terms of energy, economic costs, and CO2 emissions will allow renovation to produce benefits in the medium and long-term.
This study was conducted in the neighborhood of Montbau, a housing development of around 30 buildings, each with different characteristics, built in the 70’s and currently having energy losses through their skins, which results in a high demand of internal energy for heating and cooling purposes, in addition to doubled emission of CO2e released into the atmosphere.
Improvements are proposed to adapt the conditions of these buildings. Two solutions are proposed in addition to evaluating energy costs caused by CO2e emissions and any other economic costs year 2012. Other studies analyze the behavior of buildings already implementing such solutions and their corresponding energy, emission, and economic reductions.
The importance of such studies lays on the need to analyze options such as renovation instead of considering demolition as an alternative, and to suggest the future building of housing developments in pro of the sustainability of our planet and offer an alternative for a sustainable future, housing and shelter under optimal conditions. The figures herein offer solid results in terms of expenses, costs and energy savings, as well as the reduction of CO2 emissions released into the atmosphere. The graphs and tables here contained offer a clear reading and suggest topics for further research and even for starting up building projects, both locally and worldwide.
TOWARDS A SUSTAINABLE DEVELOPMENT AND RENOVATION
In 1987, the “Brundtland Report (Our Common Future)”, defined the term sustainable as “development which meets the needs of the present without compromising the ability of future generations to meet their own needs.” Given the evidence of the disasters caused by the indiscriminate use of non-renewable natural resources, pollution of water resources, the drying out of said resources, and the emission of greenhouse gases released into the atmosphere, among others, alerts are becoming more frequent and consequences are much more serious as the 21st Century advances.
In 1997, during the United Nations Framework Convention on Climate Change, the Kyoto Protocol was established: an agreement made by 140 countries to address the problem of global warming, with the primary objective of reducing the increase of gases produced by the greenhouse effect.
By the 60’s, with the boom of the Modern Movement, mass housing developments started to appear, trying to provide shelter for a growing population. Housing developments emerged as an aesthetic proposal with high and large buildings would provide housing to population who did not owned a house. Their construction allowed managing large plots of land at once to facilitate city development mechanisms and opened new views on urban growth. The Modern Movement intended, along with the new aesthetics and new solutions, the use of different building materials which also adapted to economic requirements.
By the end of the 20th Century, the Brunald Report defined the term sustainable, at the same time that the need for social equity and resource management arose, but changes in recent years make imperative to recover the housing stock that was built during those times as an essential part of the construction of cities to face the future of our planet. Therefore, it is necessary to renovate, reconstruct and reuse buildings. Occupation of the territory beyond measure must come to an end, but it is also necessary to recover the right to a decent and fair housing. The substitution of buildings for new ones brings higher and increasing costs. Economic conditions and drastic changes in the economy in recent decades oblige us to stop and contemplate the need for alternatives to recover our environment and create sustainability.
As for the current conditions, it is estimated that an average global warming in excess of 2°C may generate irreversible problems on ecosystems and, therefore, affect economy, productive models, agriculture, and produce extreme weather events with devastating effects that we are already facing in our daily life. The increase of CO2e emissions released into the atmosphere is linked to human activities such as intensive use of fossil fuels and destruction of forests, causing droughts and destructing aquifers. Cities, buildings, factories and vehicles emit high amounts of CO2e to work. For instance, a housing building emits high amounts of CO2e to be able to provide heating to its inhabitants, and such heating is emitted by sources and resources that tend to run out. Everyday, more and more emissions are generated.
This study develops and poses as a hypothesis the renovation of building skins on buildings constructed before the NBE-CT-79 regulation on energy saving was enacted.
Even if the conditions of the studied buildings are good, their construction took place over fifty years ago when the need for shelter was a priority over the indiscriminate use of natural resources. These buildings require immediate intervention to meet necessary comfort conditions that are consistent with the respect for the environment. Renovation would allow the recovery of housing developments, in addition to ensure their habitability over time and contribute to building a sustainable city, mitigating CO2e emissions released into the atmosphere and reducing energy costs.
The studies and results of the renovation of the skin of similar buildings, along with the proposed solutions are posed as a tool for further analysis on the impact and need for renovation as a feasible option. While the specific case of the buildings in Montbau, Barcelona, Spain, is analyzed herein, based on the current and deteriorated economic scope, the methodology and analysis at local or international level may be replicated for similar cases in the future.
1. STATE OF THE ART. BUILDING AS A WHOLE AND THE NEIGHBORHOOD OF MONTBAU
A building is a construction whose purpose is to lodge different human activities - “a construction made of resistant materials for human habitation” (RAE) - a consumer of material resources and a great energy exchanger. From the process of its construction and subsequent use, a building will be a medium to exchange energy, which finally and in some cases is used in building deconstruction.
Construction, housing in particular, is a consumer item such as any other good (cars, computers, etc.), that can be bought, sold, possessed, inherited, and with prices that flow on markets. However, permanence of buildings over time can take years or even centuries; a fact that gives buildings a different and attractive characteristic.
Traditionally, buildings were constructed having into account varied environmental conditions such as geographical location and climate. Traditional architecture was respectful of the scope of buildings and their construction took into account such characteristics, by using transparent or opaque skins, to harness or get protection against external conditions.
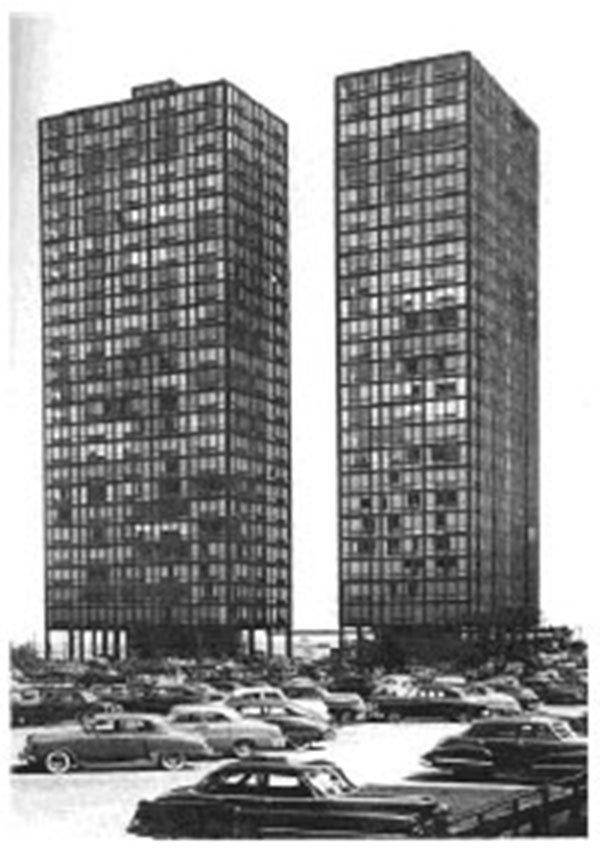
In the early 20th Century, in Europe, and especially in the US, modernity and industrialization proposed the use of new materials for construction such as steel and glass (Fig. 1), which transformed architecture and the design of building skins by reducing mass and increasing transparent surfaces. This change in materials required the use of energy sources, initially inexpensive, such as oil, which allowed a degree of comfort and habitability. Any material was then used for building skins or any constructive solution was allowed since temperature regulation was produced by energy-consuming means either for heating or cooling.
Global social and economic conditions in the mid-twentieth Century varied drastically. The growth of cities, the excessive exploitation of non-renewable natural resources, the crisis of economic patterns, among other factors, were evident in the needs and wants of large cities. In the 70’s, energy becomes expensive and the oil crisis is announced, the world revolves around the search for alternative energy resources. The United States, France, and the Soviet Union take a chance on nuclear power plants, industrialized countries without energy resources seek to decrease energy consumption in various areas: industry, transport, and housing. Regulations are driven to achieve such savings and therefore there is an impact on the way of building and living in cities.
In Spain, the first regulation on energy saving, the NBE-CT-79 standard was worded by the end of the 70’s, in response to the crisis. By then, most of the buildings constructed in the previous decades, especially in the 50’s and 60’s, that were not considered historical patrimony did not meet current minimum “sustainability” requirements and therefore the idea is to prevent the loss of energy through their skin as the materials used in their construction were not intended to such purpose.
Indoor environmental conditions depend on the heat flow established through the various enclosures comprising a building. The enclosure and the way the interiors of buildings are constructed have an impact on the indoor ‘weather’ and comfort needs.
1.1. The Skin of a Building
A building is a machine immersed in the middle of nature with its thermal, lighting, acoustic conditions, etc. These may vary over time and they do not usually match the physical needs of human beings, which are relatively constant and stable. To achieve this stability, it is necessary to act on the skin of the building. The environment is variable and it has been necessary to create envelopes, -skins protecting such variability-, leaving some indoor spaces free for various human activities to take place.
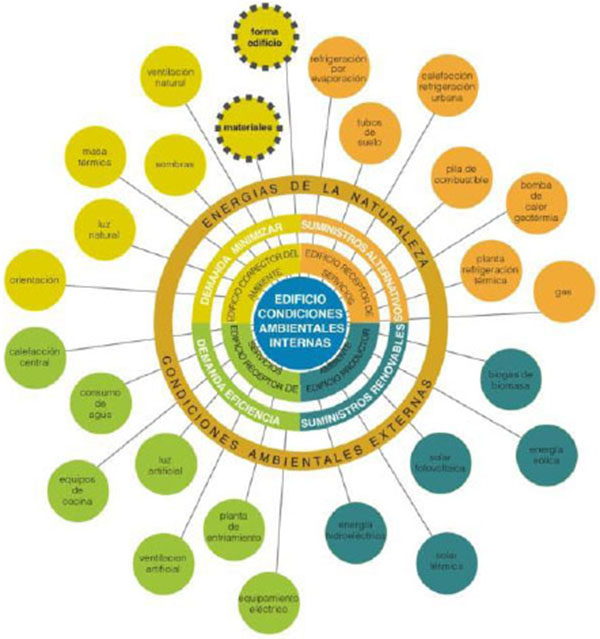
A good performance on the skin of the building, either built or renovated, will mean a decrease in energy consumption, needed to achieve desired indoor comfort. Constant indoor environmental conditions are desired. A building can correct its environment through passive systems, such as insulation, radiation, light, ventilation, etc. or even become in a producer of its environment through active systems, such as solar panels, photovoltaic cells, among others. The materials and the shape of a building are the cornerstones of a good design that results in a good construction. This study will focus on the use of insulation materials -with their ability to modify the internal environment of the building-adaptable to the shape of the building and the existing envelope (Fig. 2).
Consumption is controlled from the very design, although in areas with energy surplus, direct energy production tends to replace the right design. Peter Reyner Banham [2], defines two types of cultures that differ in their attitude towards a tree: one would build an insulating wall with the tree, and the other would burn it. Our society strongly agrees with the second standpoint, although the alarm voices of our planet are making us to be aware and change our attitude and assume our responsibilities.
That which is not achieved with these resources should be sought through external energy for its operation. Most of such energy comes from fossil resources or limited energy production plants such nuclear plants, with a cost difficult to appraise in the future, both economic and environmental (Chernobyl or Fukushim, for instance). It is important to highlight that in recent years, great progress has been made in terms of solar power plants and wind farms, mainly.
1.2. Building Energy Performance
In order to measure energy performance, a study on the different programs validated to fit our interests has been conducted. Based on the article Contrasting the Capabilities of Building Energy Performance Simulation Programs [3], a comprehensive comparison between 20 programs was carried out to evaluate the topics they deal with and their reliability in the opinion of the experts consulted for such purpose. Such topics as “General Modelling; Building Envelope, Day Lighting and Solar; Infiltration, ventilation, (…); Renewable Energy Systems; Electrical System and Equipment; Environmental Emissions (various types of gases); Economic Evaluation; (…)” were discussed. Currently, however, topics such as gas emission (CO2e) and economic implications have increasingly acquired more importance.
Recent works as “Establishing a Method to Perform a BPS - Building Performance Simulation” [4] deal the need to reformulate the “Building Performance Simulation” approach so that it matches more modern approaches such as BIM [5, 6].
In this paper, we have used DesignBuilder® since it is the ‘user-friendly interface’ of Energy Plus. This latter software, along with TRNSYS, the most widely validated software by the scientific community in the field of energy simulation.
1.3. Renovation
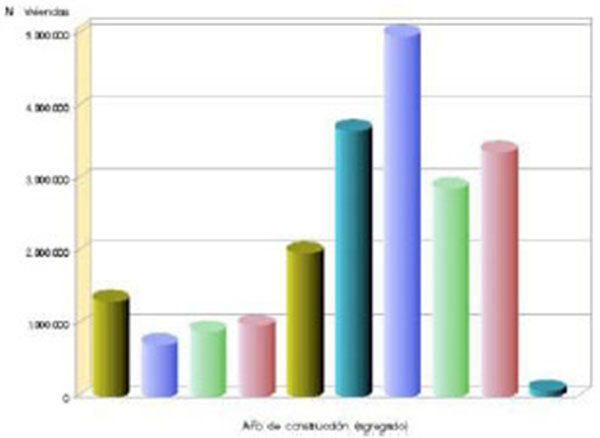
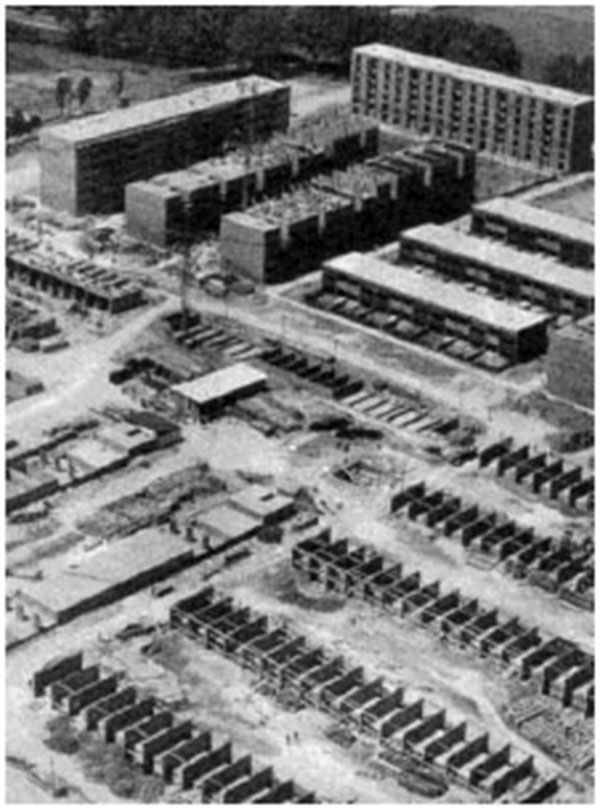
24,000,000 houses currently exist in Spain, out of which approximately 15 million were built before the 80’s (INE, 2007). Over half of the country's houses were not built taking into account any standards to avoid excessive energy consumption, since at that time no legislation or standards existed to regulate construction processes, neither there were suggestions for their maintenance and utilization (Fig. 3).
As a strategy to improve buildings, renovation, and intervention, specifically their skin, is here proposed. Renovation is a continuous action made on an existing building in order to adapt it to current needs and conditions. Improving the skin of a building, will stabilize indoor temperature conditions and, hence, the demands for comfort.
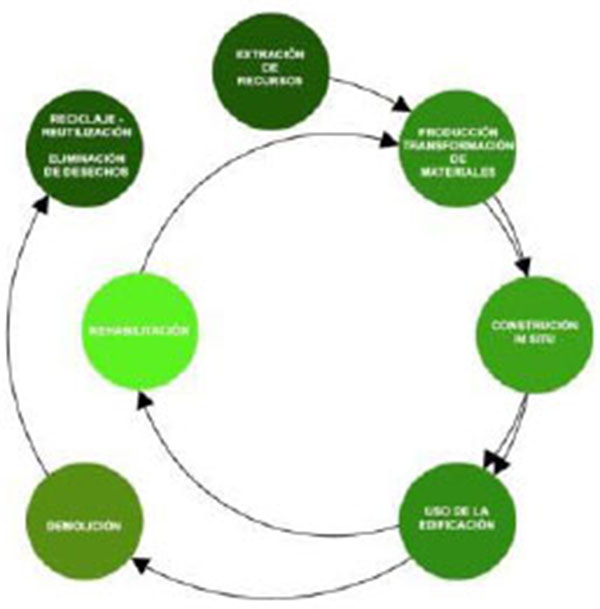
It is necessary to renovate, reconstruct, and reuse (Il s'agit de ne jamais demolir, ne jamais retrancher ou remplacer, toujours ajouter, transformer et utilitser) [7]. Unmoderated occupation of the territory must stop. The substitution of buildings for new ones, increasingly represent higher and hardly acceptable costs in economically degraded environments. It is imperative to modify the lifespan of a building by renovating it and giving it a new life that is consistent with current times, both in terms of regulations, environment, and comfort. (See suggestions for maintenance and utilization (Fig. 4).
Technology and means to carry out renovation are available, and it is important to demonstrate the capacity and the impact said actions can have. Renovation has other facets, such as the improvement and optimization of facilities or the inclusion of active systems, such as photovoltaic cells or panels for water heating; however, this study analyzes a single aspect of renovation: how to treat a building’s skin.
1.4. Actions in our Environment
-Actions at European Level
Europe is a continent with a rich history that has been constructed throughout centuries. As such, rehabilitation and intervention of historic buildings must be respectful allowing their past features to be rescued to offer better habitability conditions for our current times. Regarding edifications, especially houses built between the 60s and 80s in the 20th century that have not been considered as a cultural heritage or a monument, interventions can be performed on them to improve their habitability without the limitations of a property declared as cultural heritage good.
Various interventions have been performed to recover and intervene buildings and neighborhoods in different European countries such as Sweden, Italy, Austria, Germany, and France, among others. In most of them, the main criteria taken into account for intervention are energy efficiency, mobility, waste management, construction materials and vegetation, CO2e saving levels, among others to achieve a global standard for possible interventions and results in the future. Some of the actions carried out include the need to conduct sociology studies (demography, age groups, occupations, education, economic status, etc.) so that it is possible to address management efforts and project management.
For instance, in Malmö, Sweden, the need to intervene one of the recently built neighborhoods, called Augustenborg, was considered in 1998. The neighborhood was built in the late 40s, but by the late 90s it had already started to deteriorate notoriously, mainly because of the elimination of the traditional, heavy industry dismantling and the resulting unemployment caused. The neighborhood was home to around three thousand people and needed a comprehensive intervention. The project proposed the rehabilitation and recovery of the environmental conditions, public spaces, roads, and mobility, and its inhabitants were involved through participatory workshops and specific actions to implement it and achieve a sense of belonging. Experiments were conducted with such things as an “electric pool car” inhabitants may use as long as they return it. Also, waste management procedures were implemented, so 50% of the waste was actually recycled. On the other hand, a series of actions were commenced on the buildings, such as improvements in the isolation materials of the facades, installation of thermal solar panels and photovoltaic panels, use of geothermal energy in sports facilities, and renewal of green areas and growing of vegetation on the roofs. The project is still ongoing and it has shown excellent results [8].
In Torino, Italy, as part of the “Urban Regeneration and Development” program, an intervention project started in 2001 in suburbs that were built during the industrialization boom in the late 19th century until the middle 60s in the 20th century. The economic crisis of the late 20th century caused important changes in those suburbs, and intervention was planned to include urbanism, renovation, infrastructure, socio-economic changes, participation of inhabitants, sociology analysis, participatory workshops, and culture activities. Arguata, another neighborhood, built in the 1920s, was intervened in terms of public spaces, roads, infrastructure, and edifications, already deteriorated due to abandonment, through efficiency measures such as insulation of roofs, reduction of thermal bridges, new low-emissivity windows, and solar protection. Likewise, a natural gas co-generation plant was built to heat the buildings and produce electric energy. Actions reduced CO2 emissions (1997) in 52% per year [9].
Another example is Winarskyhof in Viena. Between 2005 and 2008, rehabilitation of a set of buildings constructed in 1924 started. 127 homes (7,200 m2) were intervened. New low-emissivity windows and doors were installed; facades and balconies were insulated; water and electricity grids were renewed; lifts were installed, and yards and parks were redesigned. 76 new apartments were built to replace the mansards, which also allowed the project to be funded [10].
In France, architects Fréderic Druot, Anne Lacaton & Jean Phillippe Vassal, proposed action strategies in the “Banlieue”, bad reputation suburbs of large French cities. The French State wanted to demolish them to substitute them with small two-storey houses. The proposal of the architects was to revalue these neighborhoods and reclassify them based on the idea of projecting the houses to the external areas so that day light and sun energy was harnessed, increase the surfaces and create large terraces with greenhouses to control energy. By reinterpreting the large buildings in terms of height and their enormous potential, the concentration of utilities and the optimization of the territory occupancy was going to be allowed. The project proposed to potentiate community spaces and the way the buildings relate to bathroom areas, community lounges, restaurants, playfields for children, among other characteristics. It was a constructive, typological, and global program of intervention on residential buildings [7].
This study especially approaches the importance of rehabilitating buildings, house developments, and neighborhoods, and the advantages of their costs over time versus the consequences of demolishing and build again. The rehabilitation of a building in the Boulevard du Bois le Petre clearly showed the advantages and feasibility of conducting such type of interventions over the simple act of demolishing and build again.
1.5. Estate and Local Actions
Interest in rehabilitation has increased in Spain as a consequence of the crisis of the construction industry. However, many working groups have rigorously and continually been working for a long while now on documenting the topics dealt with in this document.
In Zaragoza, the Mayorship Housing Rehabilitation Service is conducting a rigorous work by acting on several levels not only in terms of buildings and environment, but also in terms of social issues- as most of the inhabitants of the area are low-income population. This working group attempts to act in terms of urbanization and planning, improving the deficit of community spaces, facilities, etc. First, they study the buildings and, according to results, act on such topics as accessibility, roofs, damp, insulation, window and door frames, climatization, etc [11].
In Madrid, a working group of Universidad Politécnica, led by Margarita de Luxán, conducted a study paid by “Empresa Municipal de la Vivienda” in order to study the buildings of the center of the city, their physical characteristics: shading, ventilation systems, and possible enhancements. A very interesting document addressed to architects and builders in that specific area of the city is the result of such study [12].
Margarita de Luxán and Gloria Gómez intervened a building of apartments in San Cristóbal de los Ángeles, Madrid, by reoriented the windows of the building so that sunlight could easily and efficiently be collected by eliminating the roof and the façade and creating a ventilation system (heating and cooling the air), and the interior spaces were improved. The building now satisfies the habitability comfort need of its inhabitants [13].
In Cataluña, ADIGSA has intervened various buildings in the neighborhood of Verdum, and has also intervened buildings in Trinidad, Barcelona, and in the cities of Terrassa and Planoles. The company has improved accessibility, window and door frames, insulation, and many other features. Interventions commence with a diagnosis of the building status as well as the areas to be intervened by simulating energy performance possible savings [14].
2. HOUSING DEVELOPMENTS IN BARCELONA
After the postwar period, economic emergence affected the growth of the city and its population. Housing developments built in Barcelona during the 60’s and 70’s were an answer to the need to accommodate a growing population who came to the city looking for work and were hired as cheap labor.
In 1929, the Housing Board was created and its aim was to eliminate shantytowns and commence housing construction for its inhabitants. The first barracks were built by the new residents who arrived in the city and were retained as labor for the construction of the 1929 Barcelona International Exposition, built mostly in the mountain of Montjuïc. Then, inexpensive houses were built to accommodate this population [15].
In 1941, a tool, whose operator was the Association for Home Labor -the main statewide-level promoter linked to the vertical union- was created. In Barcelona, together with the Municipal Patronage, the first actions inspired by the housing development proposals submitted by the dictatorship of 1929 began. Garden neighborhoods with a rural character, located in rural districts, started to be built and featured single-family houses larger than the ones built in previous years.
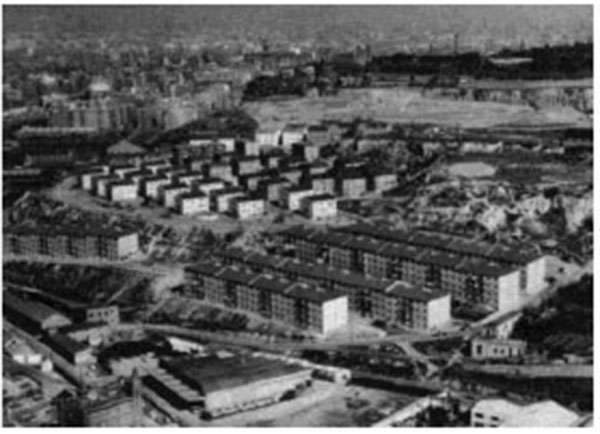
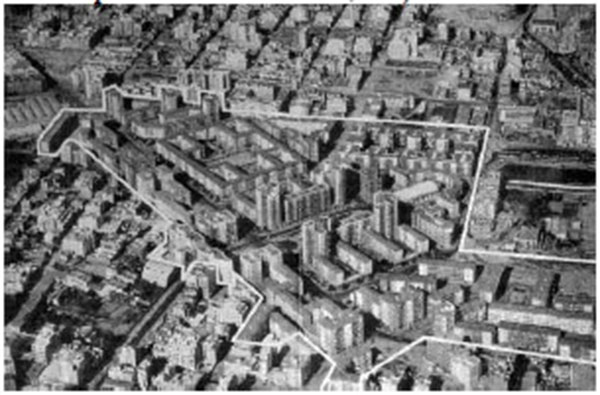
The first housing developments that were built, such as El Polvorín, in Montjuïc in 1953 (Fig. 5 Aerial view of the buildings of El Polvorín) have completely been renovated. Others, such as Torre Llobeta located at Paseo Maragall, follow the urban design proposed in 1950, where five blocks of the Eixample are built. The church supplied, in some cases, the deficiencies of the State and to celebrate the 35th Eucharistic Congress, it commences the construction of Viviendas del Congreso Eucarístico (Houses of the Eucharistic Congress) with around 2,700 units built over ten years, between 1952 and 1962 (Fig. 6). Aerial view of Viviendas del Congreso Eucarístico).
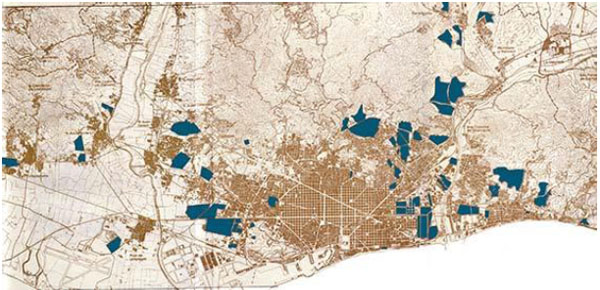
In 1953, the “Regional Plan” is worded as an ideological and urbanistic instrument for Barcelona and its area of influence. This plan, in the context of a permissive management, led to speculative processes that ended up over populating housing developments and the city in general. In 1957, the Social Emergency Plan was worded which most of the housing developments were created and foreseen, including Southwest Besòs, Montbau, Guineueta, Badalona, Baró de Viver, Bon Pastor, St. Martín, Cornellà and, Bellvitge [16] (Fig. 7 Situation of polygons in the Barcelona area).
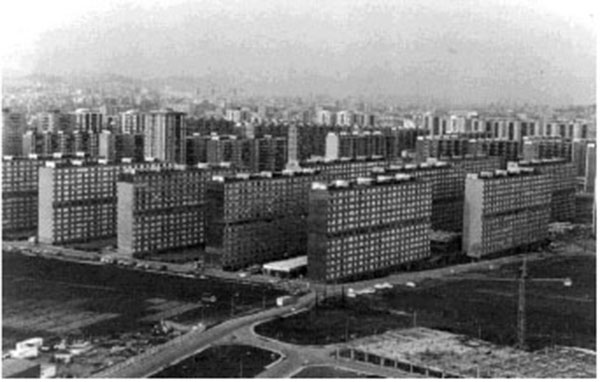
Large housing developments create small cities -within the city- with thousands of houses and inhabitants. In 1968, Bellvitge housing development created a city with 13,000 houses and between 30,000 to 40,000 inhabitants (Fig. 8 Bellvitge). In view of the need of construction projects, the private sector decided to become a key player in the construction of houses, both in lands made available by the town hall an in private-owned lands. Construction to house increasing population in house developments opens the door to larger populations and speculation for profit [17]. (Fig. 9 Southwest Besòs).
Housing developments, for better or worse, over time became one of Barcelona’s key growth drivers. Allowing expansion to strong demographic pressures, housing developments started to grow in a disorderly manner and had late responses to a number of estimates and calculations that were never sufficient.
Therefore, in the past twenty years, policies towards the construction of a large number of houses -without considering urban furnishing and public space- as well as the deficient and poor-quality construction of houses generated a sort of unfinished city [16]. The arrival of democracy began to balance these weaknesses by fostering a heavy investment in public space and utilities and by renovating buildings.
3. THE NEIGHBORHOOD OF MONTBAU
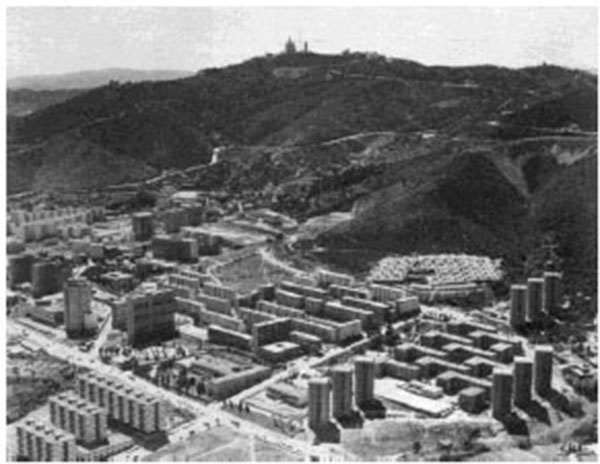
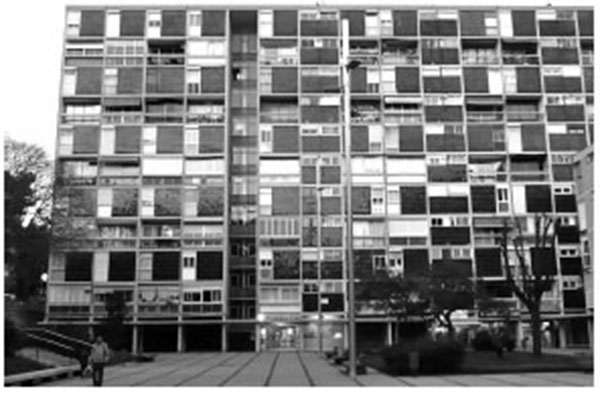
Montbau is located at the foot of Collserola Mountain, above the Ronda de Dalt, between Hospital Universitario of Vall d'Hebron and Barcelona’s Regional Government Mundet, recently transformed in offices and colleges (Fig. 10 Montbau’s first and second phase constructed).
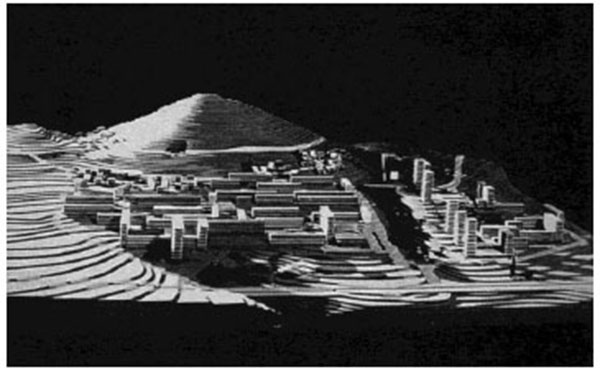
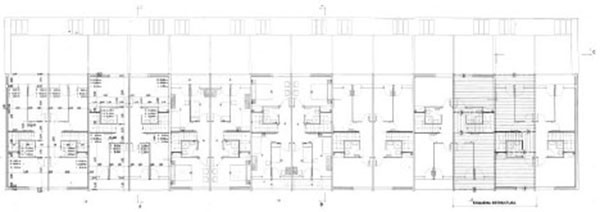
Montbau’s house development was constructed by public initiatives that took place between 1953 and 1961 by architects Xavier Subias, Guillem Giràldez and Pedro López Iñigo. Its design reflects a clear modern sensibility; structured around a central park and divided into two nuclei, it responds to topography and the environment, which determine the layout of buildings. Several types of buildings with different sizes and heights, including duplex and individual apartments, are part of this housing development [18] (Fig. 11).
Montbau represented the trends the city patronage wanted for its housing developments proposals. For this change to happen, the manager, the deputy consultant, and the architects retained by the city patronage visited several European cities, especially in Germany. They walked around Frankfurt, Bonn, Cologne, and Berlin, where they visit the Interbau, including other sites under construction at that moment [15].
Barcelona’s Municipal Housing Patronage commissioned architects Guillermo Giraldez, Pedro Lopez Iñigo and Xavier Subías/LIGS to draft Montbau’s Partial Plan. These young architects developed the initial proposal in a few days to be submitted in an exhibition. After the exhibition, the City Council complemented and reformulated some of the initial proposal points and submitted the Plan again for final approval [18].
The two largest housing developments of the Municipal Patronage at that time were Montbau and Southwest Besòs. The former became an operation of prestige and with possibilities for experimentation. The aim was to build 1,440 apartments of 60, 80, and 100 m2, in 31 hectares, with a variety of buildings, towers, linear blocks, and single-family houses of various shapes. One of Montbau’s differentiators regarding other developments was the emphasis put on social infrastructure [15].
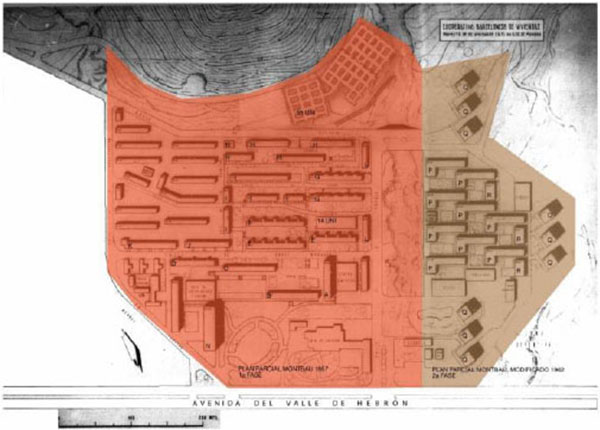
The first sector was located on the Southwestern/SW area -first stage- and architects Guillermo Giraldez, Pedro López Iñigo and Xavier Subías / LIGS were commissioned in 1958. The second stage was developed in the Northwestern/NW area and was three years later M. Baldrich -Deputy Developer- A. Bonet, who had not returned from exile after a few years in Argentina, J. Soteras and Pedro J. Lopez, architects of the municipality [18] were commissioned. Some initial criteria started to be depreciated and during the first development stage, an additional story was added to all projected buildings. During the second stage, the building density was doubled by amending the development plan, which was approved in July 1962 (Fig. 12).
The neighborhood has been maintained, over the years, in good conditions. Buildings have not undergone major changes, saved the closure of some galleries or terraces and the modification of some of their window frames, without affecting the original design of the buildings. In the NE area, some neighbor communities have made important changes such as the replacement of tiles or plastering in some of the facades. Modification attempts are described in a publication of the Municipal Patronage containing proposals for the 1957-1960 three-year period. The concentration of houses in large housing developments, access to housing ownership on a deferred basis, increase of investment and social unrest with the purpose of creating facilities in the neighborhood (schools, community centers, etc.) are dealt with in said publication.
Montbau was a neighborhood for experimentation, based on the visits to Europe, the trends proposed by modernity and the path dictated by the Athens Charter. A new type of apartments was built to respond to the new needs of the growing industrial society. Building efficient, all-inclusive, comfortable apartments, with minimal space was the rule.
3.1. Block A - Duplex Buildings (Common Hallway Distribution)
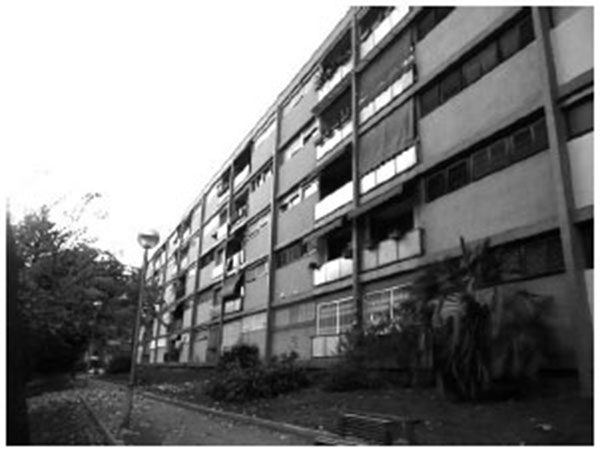
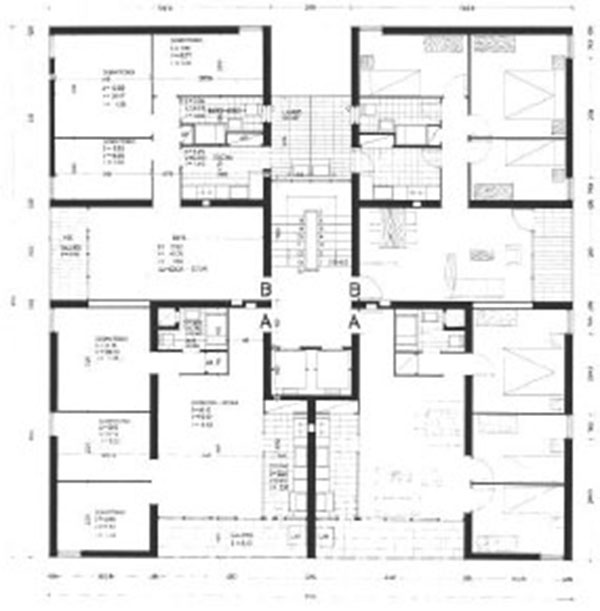
Block A was one of the first buildings ever to be built in Montbau. It is a Ground-Floor Building+10, with only one staircase and an elevator; hallways lead to each one of the apartments. There are two types of apartments: 20 two-bedroom apartments and 30 three-bedroom apartments (Figs. 13 and 14). The building located towards the Northeast - Southwest, with the facade of the living rooms facing the afternoon sun. Such orientation is favorable in winter for heating. Sun can be handled using blinds, curtains, etc. in summer to avoid overheating (Fig. 15). The other duplex building, Block N, is located in the same orientation.
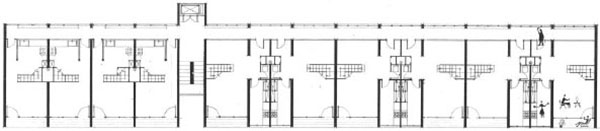
3.2. Linear Block E-F (Apartments per Floor)
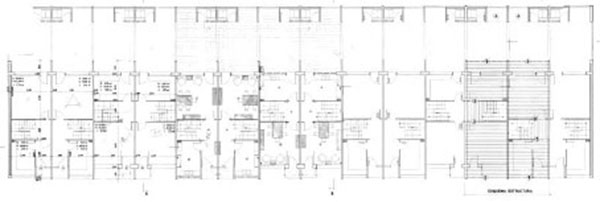
Block E-F is the typical type of apartment building in the area. These blocks are shallow, where apartments face both facades, allowing good illumination in all the rooms and a good cross-ventilation design for summer time (Fig. 16). Their orientation is Southeast - Northwest. The Southeaster facade receives most of the sun hours and the rear part receives just a few sun hours and only during summer time (Fig. 17).
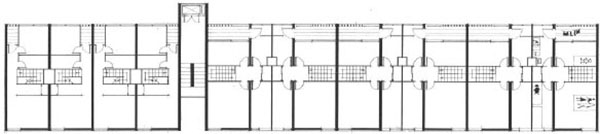
3.3. Tower Q (4 Apartments per Story)
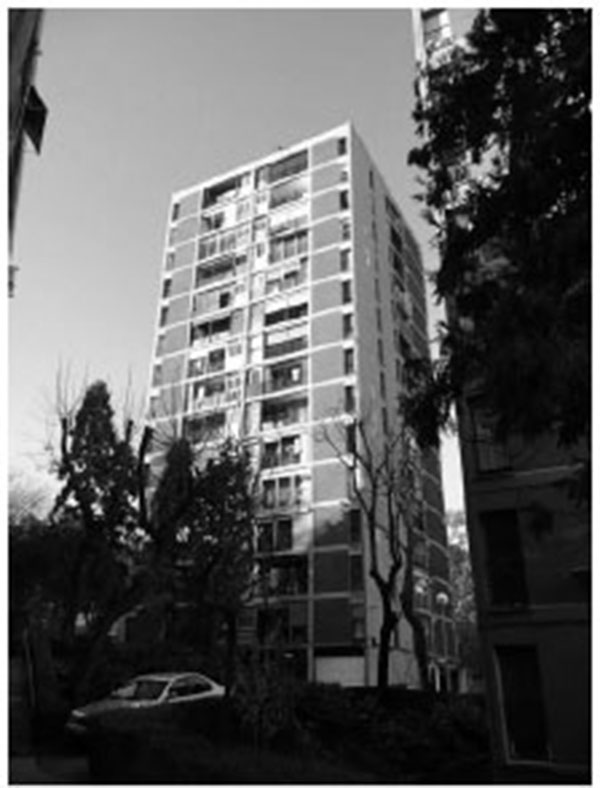
Block Q, with a tower design, holds 9 towers, each with 15 floors and 4 apartments per floor (Fig. 18). This block has two different types of space: A and B. A-type apartments face South. B-type apartments face East and West. In general, all apartments have good ventilation and illumination in all rooms (Fig. 19).
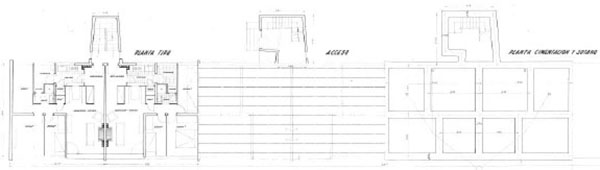
3.4. UNI14 - (Single-Family Attached Houses)
There are two types of houses in core Montbau. This study focuses on a unit of 14 UNI14 attached houses that include workshops as a complement to the shopping mall (Figs. 20 and 21). This housing development is organized as the linear blocks: Southeast - Northwest. The building is located on a slope of land. Access to houses is located on the main road, and following the topography, a staircase connects, at a lower level, the adjoining workshop floor. The houses are in pairs and distributions have minor differences (Fig. 22).
4. BUILDING SKIN CONSTRUCTION SYSTEMS USED IN THE NEIGHBORHOOD OF MONTBAU
The skin of a building separates it from the external conditions and protects it against weather conditions. This protection has been formed over time and depends on the climate where buildings are located at. The separation between the envelope and the structure encourages the emergence of new enclosure surfaces. Said enclosure transmits its own weight, as well as other loads, such as wind, onto the structure. This separation occurs in modern architecture by the emergence of new technologies such as concrete and steel, which are the new enclosures defining buildings. In general, the skin does not hold the building, but does change its composition. These trends are seen in some buildings in Montbau, where three basic systems of skins are evident: concrete walls (screens and precast), concrete block walls, and ceramic walls [1].
From the table below (See Table 1 Summary of building types per block), it can be concluded that many buildings keep their ceramic load-bearing walls as said structures are a common and simple construction system. On the other hand, higher buildings (A, N, and Q) required innovative structural systems and concrete structures, pillars and screens. Prefabricated systems were used also in buildings Blocks C and D, in which these systems were used both in the structure and in the enclosure.
The enclosure study concludes that most of the buildings suffer large energy losses since none of them have insulation systems in their walls - except Block L, which has 5 cm of insulating wool in the deck. Therefore, comfort conditions are poor and it is necessary to have systems that consume energy to get them comfortable.
| BUILDING NAME | Concret structure | Walls oo ceramic | Concret diaphragm walls | Precats concret walls | Concret block walls | Ceramic walls | Flat roof | Pitched roof | Metalwork with simple glass | Wood work with simple glass |
|---|---|---|---|---|---|---|---|---|---|---|
| BUILDING A | X | X | X | X | X | |||||
| BUILDING B | X | X | X | X | X | |||||
| BUILDING C - D | X | X | X | X | ||||||
| BUILDING E - F | X | X | X | X | ||||||
| BUILDING G | X | X | X | X | ||||||
| BUILDING H | X | X | X | X | ||||||
| BUILDING I | X | X | X | X | ||||||
| BUILDING J | X | X | X | X | ||||||
| BUILDING K | X | X | X | X | ||||||
| BUILDING L | X | X | X | X | ||||||
| BUILDING N | X | X | X | X | X | |||||
| SINGLE FAMILY 14 | X | X | X | X | ||||||
| SINGLE FAMILY 52 | X | X | X | X | ||||||
| BUILDING P | X | X | X | X | ||||||
| BUILDING Q | X | X | X | X | ||||||
| BUILDING R | X | X | X | X |
For this study, the status of the four targeted buildings was analyzed: Block A, duplex apartments; Linear Block E-F, Block Q, Towers, UNI14 Single-Family houses. Also, a summary was written for the different buildings of the complex [15].
5. EVALUATION OF TYPICAL BUILDING IN MONTBAU
Building skins is the envelope that allows specific conditions to occur and isolates living spaces from the external environment. Its design and construction must provide solutions for comfort with a minimum energy consumption, through the contributions provided by constructive solutions, adapted to weather and environmental conditions. The skin takes on a greater role in situations of lack or reduction of energy resources [19, 20]. The skin is a physical barrier that should help produce balanced climatically buildings. Skin conditions will impact the mechanical environmental needs -low or null- that allow regulating a low energy consumption during the lifespan of the building and ensure an adequate internal thermal comfort [21].
The construction of buildings in Spain, did not take into account these considerations until the energy crisis in the 70’s, -a crisis that affected all the industrialized countries, especially in Europe, with limited sources of energy- leading, among other measures, to a considerable increase in energy prices. Given the crisis and the economic costs of maintaining the minimum comfort conditions, it was necessary to reconsider the construction system, forcing the emergence of regulations that governed and regulated such type of envelope - NBE-CT-79 Standard-.
Buildings constructed between the 50’s and 70’s, -subject to analysis in this study- despite their acceptable conditions, do not meet the minimum comfort standards. Currently, these apartments consume large amounts of energy to achieve acceptable internal comfort conditions [22].
This study analyzes the current consumption of the 4 types of buildings in the neighborhood of Montbau. This study will allow the analysis of the current characteristics of the skin of several buildings, as well as knowing the energy demand of air conditioning, C02e emissions and their economic cost to guarantee inhabitants the acceptable level of thermal comfort. The analysis, limits its scope to the evaluation of consumption, costs, and CO2e emissions, needed to achieve the thermal comfort required to warm the different spaces, without refrigerating them. Weather, location -the neighborhood of Montbau in Barcelona, and the arrangement of buildings- their current position in the territory through cross-ventilation, allow air currents that generate a regular acceptable temperature in summer time [23].
Simultaneously and complementarily, the study includes an analysis of the behavior of buildings in other climatic zones of Spain -Madrid and Girona- to assess the impact suffered in different climatic conditions.
For this particular case, DesingBuilder [24] was used. This tool allows controlling temperature, lighting, and energy analysis of buildings in any climatic situation, as well as assessing comfort and CO2e emissions, among others. The tool offers the possibility of analyzing both existing buildings and future buildings during their any of the stages of the design process.
The software allowed to model buildings type A, E-F, Q, and UNI14. Modeling basically consists in geometrically defining the building, characterizing its constructive elements, defining its occupancy rate, its air conditioning system and the external environment and climate. The software provides a series of results that will allow the analysis and the evaluation of the building behavior and thus estimate the various possibilities for future building envelope improvements.
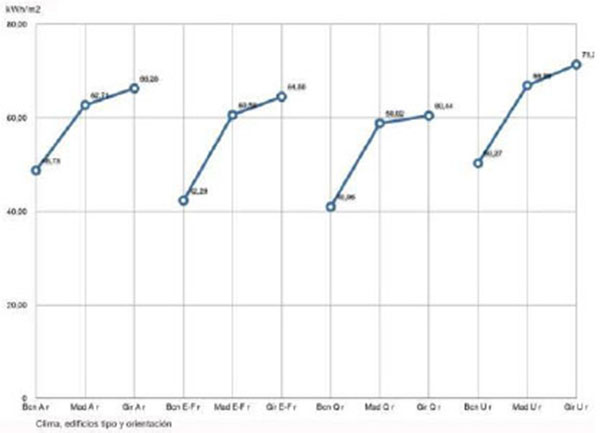
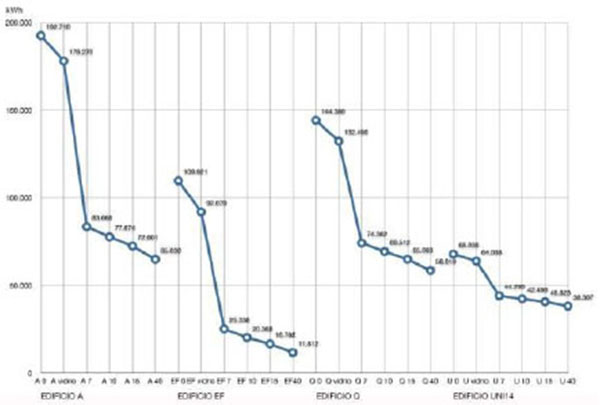
All buildings have high energy consumption, produce high CO2e emissions, and are considerably expensive in terms of internal comfort. However, the buildings with the highest consumption rate are the single-family UNI14 type, followed by duplex apartments -Block A-, linear blocks -Block E-F- and finally apartment towers -Block Q (Figs. 23-25). The most compact buildings -E-F and Q- consume less. The type of housing affects consumption; the more compact a building is, the less energy it losses is. This is so because there is less skin in contact with the outside, a key situation to achieve comfortable spaces with a minimum consumption.
Current global study of the neighborhood proves the use of significant amounts of energy with its corresponding CO2e rates and a considerable economic cost. It is assumed, based on the studies, that most houses present discomfort.
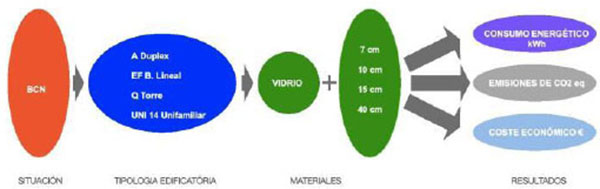
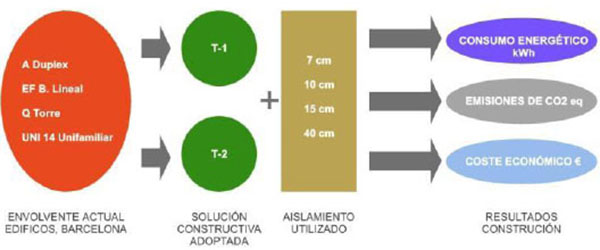
6. QUANTIFICATION OF BUILDING TYPE A, E-F, Q AND UNI 14, ACCORDING TO INSULATION THICKNESS AND TYPES IN BARCELONA
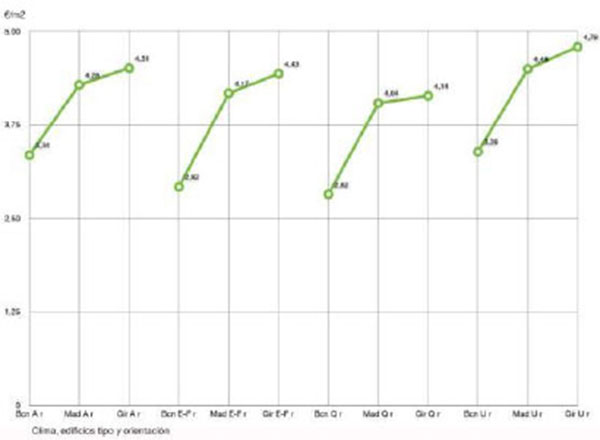
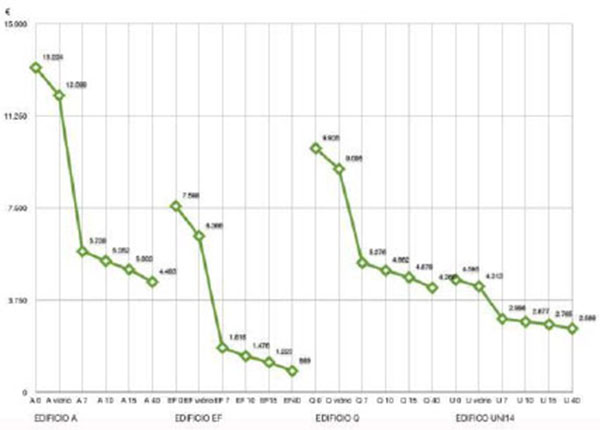
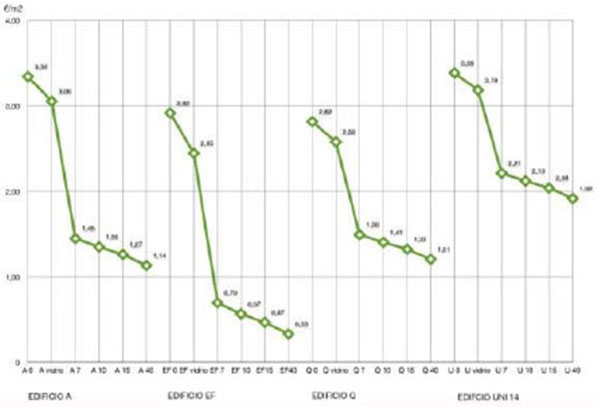
The objective is to show the evolution of energy needs, CO2e emissions and their cost, depending on the different insulation thickness proposed for model buildings, by renovating their glazing. To perform this analysis, insulation modification is studied, and the effect at a global level and per square meter of the building is taken into account to create a comparison table between them (Fig. 26).
Graphs summarize all the results. In the case of Barcelona, amendments will allow a clear improvement in all the buildings; sample analysis, in the modifying of window frames and glazing, shows an improvement between 5 and 16% depending on the building. When the whole building envelope is intervened with a 7 cm thick insulation system, improvement reaches 77% in Block E-F, followed by Block A at 56%, Block Q at 49%, and finally the Single-Family houses block at 35%. The graph shows that the use of a 7 cm and 40 cm insulation thickness, has a steady improvement, but a minor affectation, depending on the insulation thickness used (Figs. 27-32). We found that the reduction of energy loss through high insulation levels is the most effective way to conserve energy and establish a stable internal comfort. Increasing the thickness of the insulation system in 4-6 cm is comparable, in terms of savings, to that obtained when increased in 6-12 cm. The graphs show that constructing buildings that are fully insulated may have a higher cost performance than the performance obtained, as showed in the reduction of energy consumption (Fig. 26) insulation effect on the consumption of heating energy) in which it is shown that using 7 cm insulation represents a reduction of 94,602 kWh and an 8-cm increase represents a reduction of only 11,067 kWh. It is necessary to carefully study the location and external conditions to provide the right solutions [25].
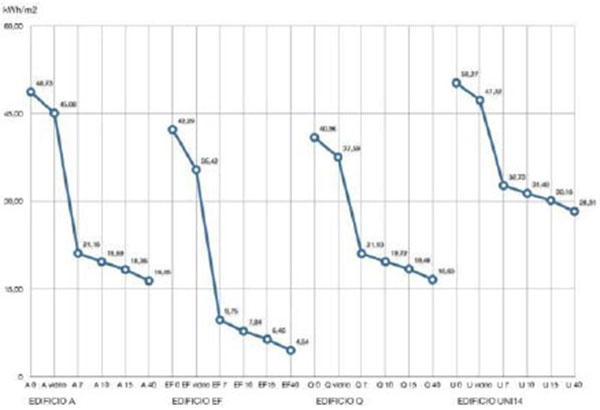
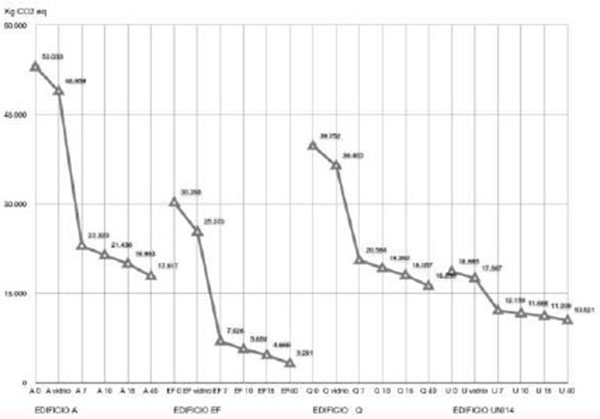
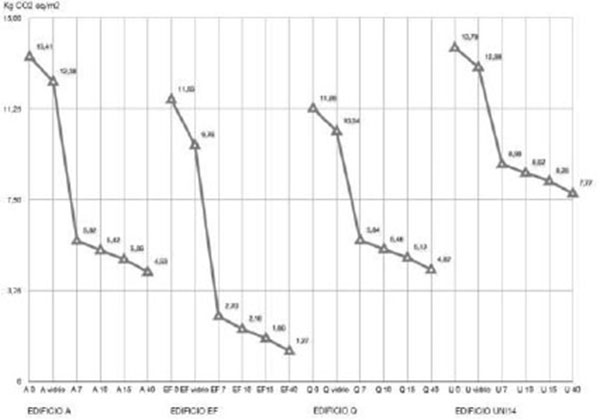
Graphs show that Linear Block E-F has a higher reduction by going from 42.29 kWh/m2 to 9.75 kWh/m2 or 76.94%. The renovation of the envelope of the duplex building improves substantially, going from 48.73 kW/m2 to 21.16 kW/m2 - 7 cm of insulation - or 56.57%, Tower Q would have a substantial consumption reduction down to 21.10 kW/m2 or 48.48%. Single-family houses, or UNI14, are the ones with the highest reduction with 23.05%, reaching 32.73 kW/m2 by using 7 cm insulation thickness (Fig. 24).
The graphs with the summary of the data show a substantial improvement due to insulation, and show considerable reductions in energy consumption, CO2e emissions, and economic costs to achieve the desired comfort in apartments and houses.
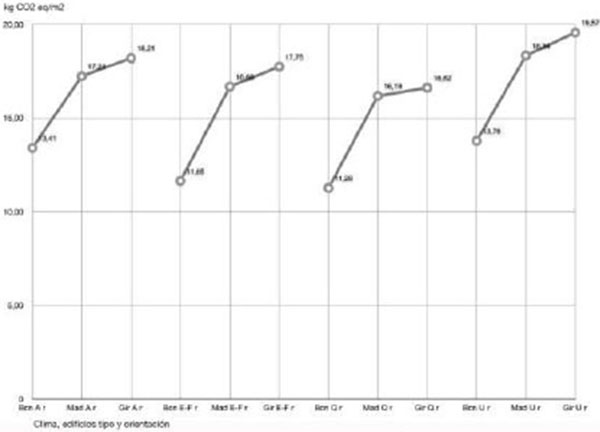
The graphs (Figs. 29 and 30) show that the effect on CO2e emissions and cost are parallel to energy consumption and CO2e emissions which have the same reduction ratios. Improving the envelope of buildings proves a reduction in energy consumption and emissions associated with its use. The most effective way to reduce CO2e emissions is to reduce the energy demand required to obtain the desired indoors habitability. It is necessary to seek efficiency, mainly in the end use -buildings-, capture, transformation, and transport of materials [26].
The type of building that responds less effectively and efficiently to the proposed improvements is the single-family house, followed by duplex buildings, and towers. The most efficient building is the linear block (Figs. 28, 30, 31).
This research develops the impact of improvements to building envelopes as a whole and at neighborhood level. With this overall assessment, it is confirmed that it is not necessary to demolish or occupy more territory to contribute to the urban development of cities and their environment balance [27].
Summary Table 2 shows that the action on the envelope produces immediate benefits in both energy consumption and reduction of greenhouse gases emission, and depending on the insulation thickness it is possible to achieve reductions in energy consumption, emissions, and cost between 64 and 77%, depending on the case. To reduce 30% of greenhouse gases emissions in the European Union by 2020 - DB HE Basic Document: Energy Savings, (2013), with error corrections by BOE 08711/2013- is the current environmental objective. Such objective can be achieved by acting on the building envelopes and acting in a comprehensive manner on the various neighborhoods of our cities.
| WHOLE NEIGHBORHOOD MONTBAU | Number of households | Constructed area | Surface helpfu | Total heating energy kWh | % current heating energy reduction stateal | Total emissions Kg CO2 eq | % CO2 eq emissions reduction heating state acts | Total Cost € heating energy | % energy cost reduction current heating status |
|---|---|---|---|---|---|---|---|---|---|
| RESULTS CURRENT STATUS | 1.959 | 160.286 | 145.715 | 6.913.507 | 1.903.629 | 475.901 | |||
| RESULTS 7 CM THICK | 1.959 | 160.286 | 145.715 | 2.407.869 | 65 | 665.251 | 65 | 169.863 | 64 |
| RESULTS 10 CM THICK | 1.959 | 160.286 | 145.715 | 2.134.982 | 69 | 590.811 | 69 | 151.536 | 68 |
| RESULTS 15 CM THICK | 1.959 | 160.286 | 145.715 | 1.920.413 | 72 | 532.121 | 72 | 136.715 | 71 |
| RESULTS 40 CM THICK | 1.959 | 160.286 | 145.715 | 1.612.742 | 77 | 448.455 | 76 | 115.390 | 76 |
Acting on the envelope with the proposed improvements will enhance the quality of life of its residents, the facades of buildings, that have been degraded over time or have received none or little maintenance, and the interaction of buildings with the environment. These transformations with the different degrees of existing performance revitalize and consolidate neighborhoods and cities.
7. CONSTRUCTIVE IMPROVEMENTS AND QUATIFICATION
Time affects the targeted buildings. Most of these buildings do not meet the minimum requirements of comfort, or even regulations. The materials they were built with are deficient and make it difficult to meet the basic requirements regarding living conditions and comfort.
The skin of the buildings must ensure the protection of their users against weather conditions, noise, and pollution, among others. External conditions pierce building skins and affect their internal habitability and desirable conditions. External conditions impact the envelope over time, degrading its conditions and causing a lower degree of comfort [28].
Apartment buildings are slowly updated and most of the times do not get the minimum necessary maintenance works for their preservation. The division of most buildings in “condominiums”, along with a poor management on the part of owners, makes renovation difficult. The current economic change -a brake on new construction projects and an economic and environmental crisis- requires action on existing buildings to develop a new way to build and provide houses and apartments with the required comfort conditions [27].
Any action for renovation of an existing building implies adding a layer of new materials on an existing envelope. Therefore, it represents energy consumption, CO2e emissions and an economic cost at the time of its construction. New materials will be added to allow the lifespan of buildings to be extended.
The objective of this section is to define the demand for materials based on the constructive solutions established and then calculate energy costs and CO2e emissions produced by acting on the envelopes.
To conduct this study and define demand, the construction software called TCQ-2000 ITEC - Institut de Tecnologia i Edificació de Catalunya- was used. The software consists of a set of informatics apps that provide support to drafting, procurement, planning, and project control activities. By using this software, it is possible to calculate the economic and energy costs of a building, in addition to CO2e generation. This study establishes two types of construction solutions, both for the facades and the roof that fit our sample buildings -A, E-F, Q and UNI14- with various insulation thickness using conductivity materials that are similar between them. Likewise, two types of window frames -aluminum and wood-, used to complement the regeneration of the skin of the building are studied. This study is not intended to be an executive construction project, but aims at establishing parameters to analyze how the building behaves after an intervention on its skin, in terms of energy costs, greenhouse gases emissions, and economic costs, according to standardized solutions with insulation thickness that has already been established (Fig. 33).
Two constructive proposals are analyzed. Both options have variable insulation thickness. The first proposal, T1 (overlying), will bear a double mortar layer placed over the insulation. This method allows the recovery of the image of the building as it can replicate shapes and moldings. The recovery of the material is difficult in the future and that is why insulating material has been incorporated within a stone mass. T2, the second proposal, is having a ventilated facade where all the materials are joint by mechanical systems, allowing future disassembly and recycling. Also, this type of ventilated facade is more favorable in warmer climates, as they allow chamber ventilation and reduce the impact the sun has on the interior of buildings.
To assess energy, economic, and emission costs, these two constructive solutions, T1 (overlying) and T2 (ventilated facade), are proposed, and by using the TCQ 2000 software, the economic cost of the constructive reform is assessed. The software allows estimating the energy cost of the adaptation and the emissions that occur when analyzing the performance of the facade. These solutions are tailored to type A, E-F, Q and UNI14 buildings.
Having demonstrated the technical feasibility and obtained the economic, energy, and CO2e emission value per square meter of the constructive solutions adapted to the targeted buildings, the renovation cost of each building, according to their construction type, is evaluated, as well as the insulation thickness and window frames chosen.
To establish said values, wall enclosure surfaces are evaluated, as well as any openings and the roof of each one of the targeted buildings. The foregoing is conducted for both constructive proposals, T1 (overlying) and T2 (ventilated facade), to obtain the results [1].
For each type of building these two constructive solutions -T1 (overlying) and T2 (ventilated facade)- are proposed, including two types of window frames (aluminum or wood), both with double glazing and the four types of insulation thickness -7, 10, 15, and 40 cm-. For each of these proposals, the energy cost of CO2e and economic value that should be invested to renovate the envelope and recover the habitability of the interior spaces is obtained.
Facade renovations costs are influenced by the type of building materials chosen. The influence of aluminum is very high in all the buildings. Energy costs and CO2e emissions can be doubled or tripled when building the same openings with wooden structures. It is necessary to assess maintenance costs considering that as time passes these costs are balanced.
8. EFFICIENCY BETWEEN CO2e EMISSIONS AND ECONOMIC COSTS
The envelope of the targeted buildings was constructed in a specific time, on a number of techniques, constructive, economic, and environmental characteristics of that specific time. The needs of habitability and legal environmental conditions have changed over the years and as mentioned in previous sections, an adaption to new needs, in terms of comfort, energy consumption, and greenhouse gases emissions, is necessary [22].
Spain imports much of the energy it uses. It depends 76% on an external energy source. Spain's energy balance is negative, and therefore, reducing consumption will improve the overall trade balance of the country. Through this study, it will be possible to prove energy reductions and assess the economic cost represented by renovation [29].
In the previous sections, the heating demand was established with its corresponding energy, CO2e, and economic needs, for the current envelope. Then, the incidence of acting on the envelope of the various buildings -A, E-F, Q, UNI14- was assessed considering various insulation materials with different thickness -7, 10, 15, and 40 cm- and modifying the window frames -wood or aluminum- using double glazing. After that, the costs of the improvements and updating of the envelope was assessed using two constructive proposals: T1 (overlying), and T2 (ventilated facade), based on the thickness established using adaptable materials that can fit existing materials and constructions in Montbau. Energy, economic, and CO2e emissions impact is assessed. In terms of the economic variable, existing aids for renovation are not considered as they may vary over time and distort the final global values. Finally, values per square meter of renovation of the envelopes were established, as well as their energy expenditure and the levels of CO2e emissions that would occur by renovating the buildings (Fig. 34).
Three scenarios were set for the analysis of the increase in energy costs, which suggest an equilibrium between the investment in the renovation of facades and the cost in their use. These scenarios foresee a percentage of annual increase, which may drastically change, subject to the variable operating costs and the scarcity of non-renewable resources. The price of energy may vary due to demand, production, and availability of fossil fuel reserves, and that is why said sensitivity scenarios have been established. It is difficult to establish its evolution, since several variables are involved, including economic crisis -demand decrease-, taxes, internal conflicts in producing countries, natural disasters, discovery of new reserves, etc. Likewise, there are large variations between the forecast of fossil-fuel depletion which, based on Hubert’s Peak Theory, establish a production peak and subsequent decline, a matter that would impact consumption and prices will then fluctuate.
Therefore, costs can be easily overcome depending on the energy market, strongly influenced by an increasing fuel consumption and reserves difficult to forecast. In 2012, there was an annual increase of 9%, in 2013 3.58%, and it was expected, by the end of 2013, a possible increase of 11% in 2014 [30]. For this analysis, three scenarios of energy sensitivity are established, forecasting an increase in the cost of energy by 3%, 6% and 10% per year.
To develop the research, spreadsheets where prepared and the cost of renovation - energy kWh, CO2e and economic costs in € for the year 2012- were included for the constructive solutions -T1 (overlying) and T2 (ventilated facade)- using different insulation thickness -7, 10, 15, and 40 cm- and two types of window frames -wood and aluminum. For the latter, maintenance costs were included taking into account the aforementioned variables, for periods of four-years [30]
Also, this analysis attempts to demonstrate that energy renovation is useful to boost the construction industry and reactivate the sustainable economic growth. Therefore, transforming buildings to be energy efficient will help consolidate the country's prosperity in the long term [31].
Improving energy emissions and economic performance will boost the cohesion and shared responsibility among the various European countries, now that many of them are working specifically on that matter. Existing houses and apartments are one of the largest energy consumers and CO2e. Therefore, the actions performed on the existing housing developments -as outlined in this study- will define the energy performance of the housing development sector for the decades to come [32].
Based on these data, we have analyzed the crossing point of the various construction options proposed, with their corresponding structures and insulation thickness, before and after the intervention on the buildings. It is then necessary to establish a selection parameter -CO2e emissions in this case- and their relationship with the three proposed economic scenarios to obtain improvements that allow benefits to occur -energy, emissions, and economic benefits- depending on the standard construction proposed, with the respective structure and insulation thickness. The strategic point to be analyzed will be CO2e emissions because of the implications their reduction will have, which exceed the purely economic impacts at local level, to become a global issue.
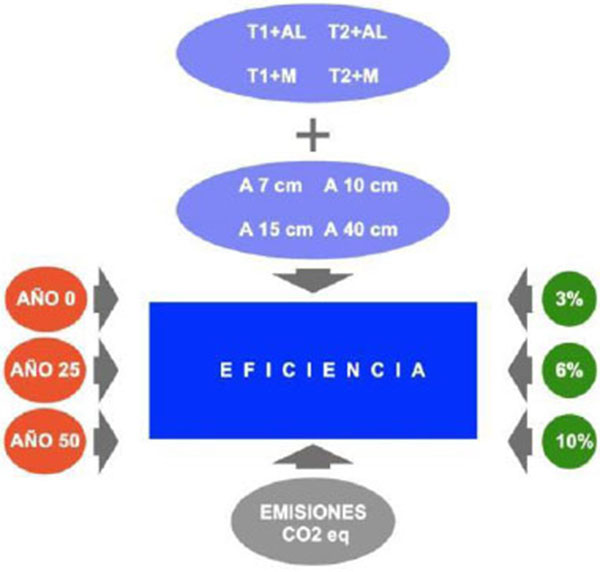
A relationship between CO2e emissions and economic costs -3%, 6%, and 10% of annual accumulated difference- will be established between non-renovated and renovated buildings. The values discussed are the difference between the annual accumulated costs of the building before its renovation and the accumulated annual values of the building that has already been renovated with the various proposed solutions, plus the economic cost and emissions resulting from improvements made to the envelope. The analysis will be conducted starting in year zero -in which all options are identical- and the values will be negative -since an initial investment must be made to improve the envelope-, then in year 25, medium term, and finally in year 50. In the latter case, positive or negative values can be obtained depending on the balance between investment costs and energy consumption when the envelope has been already improved (EOTA- The European Organization for Technical Assessment-1999, establishes an estimated illustrative lifespan for products, works, and constructions in which an estimated lifespan category is established for each work: Brief = 10 years, medium = 25 years, normal 50 years and long = 100 years. Those terms are the ones adopted for the periods of this study), the constructive solutions proposed and their respective thickness. This analysis will show the results obtained for CO2e emissions in relation to economic costs, with both constructive solutions proposed, structure works and more efficient insulation thickness for each one of the targeted buildings.
8.1. Block A Efficiency
Block A is a duplex building. In all the three time points established -0, 25, and 50 years-, the reduction of emissions is evident along with the economic costs over years 25 and 50 (Table 3 Block A Efficiency. CO2e emissions and Economic Cost Reductions after Renovating the Skin of Block A Buildings, years 0-25-50).
The table shows the evolution -resulting from the difference between the building without any renovation and the various renovation proposals- CO2e emissions, with the use of envelopes of various thickness for the years proposed above, and the speculative energy price increase. Year 0 is identical for all the constructive proposals and economic scenarios, because this is the year in which the investment has to be made to renew the facade.
| Kg CO2 eq | Cost 3% | Cost 6% | Cost 10% | |||||||||
|---|---|---|---|---|---|---|---|---|---|---|---|---|
| Year | 0 | 25 | 50 | 0 | 25 | 50 | 0 | 25 | 50 | 0 | 25 | 50 |
| T1 + Aluminium | ||||||||||||
| A7 | -679.829 | 70.421 | 820.671 | -599.594 | -318.509 | 270.019 | -599.594 | -164.293 | 1.703.960 | -599.594 | 210.147 | 8.983.447 |
| A10 | -711.292 | 78.633 | 868.558 | -610.499 | -314.844 | 304.192 | -610.499 | -152.634 | 1.812.465 | -610.499 | 241.216 | 9.469.298 |
| A15 | -769.920 | 56.080 | 882.080 | -637.384 | -328.623 | 317.854 | -637.384 | -159.222 | 1.892.986 | -637.384 | 252.086 | 9.889.237 |
| A40 | 1.057.988 | -180.088 | 697.812 | -751.209 | -423.333 | 263.166 | -751.209 | -243.445 | 1.935.810 | -751.209 | 193.326 | 10.427.085 |
| T1 + Wood | ||||||||||||
| A7 | -134.502 | 568.939 | 1.272.379 | -363.064 | -236.721 | 197.065 | -363.064 | -82.505 | 1.631.006 | -363.064 | 291.935 | 8.910.492 |
| A10 | -165.965 | 577.151 | 1.320.266 | -373.969 | -233.056 | 231.238 | -373.969 | -70.846 | 1.739.510 | -373.969 | 323.004 | 9.396.344 |
| A15 | -224.593 | 554.597 | 1.333.788 | -400.854 | -246.835 | 244.900 | -400.854 | -77.434 | 1.820.032 | -400.854 | 333.874 | 9.816.283 |
| A40 | -512.661 | 318.430 | 1.149.520 | -514.678 | -341.545 | 202.214 | -514.678 | -161.657 | 1.862.855 | -514.678 | 275.114 | 10.354.131 |
| T2 + Aluminium | ||||||||||||
| A7 | -716.785 | 33.465 | 783.715 | -624.244 | -343.159 | 245.370 | -624.244 | -188.943 | 1.679.311 | -624.244 | 185.497 | 8.958.797 |
| A10 | -730.494 | 59.431 | 849.356 | -635.784 | -340.129 | 278.907 | -635.784 | -177.919 | 1.787.180 | -635.784 | 215.931 | 9.444.013 |
| A15 | -756.336 | 69.664 | 895.664 | -662.115 | -353.354 | 293.123 | -662.115 | -183.953 | 1.868.255 | -662.115 | 227.355 | 9.864.506 |
| A40 | -890.145 | -12.245 | 865.655 | -778.888 | -451.012 | 235.487 | -778.888 | -271.124 | 1.908.130 | -778.888 | 165.647 | 10.399.406 |
| T2 + Wood | ||||||||||||
| A7 | -171.457 | 531.983 | 1.235.423 | -387.713 | -261.371 | 172.415 | -387.713 | -107.155 | 1.606.356 | -387.713 | 267.285 | 8.885.843 |
| A10 | -185.167 | 557.948 | 1.301.064 | -399.254 | -258.341 | 205.953 | -399.254 | -96.131 | 1.714.225 | -399.254 | 297.719 | 9.371.059 |
| A15 | -211.009 | 568.182 | 1.347.372 | -425.585 | -271.566 | 220.168 | -425.585 | -102.166 | 1.795.300 | -425.585 | 309.143 | 9.791.552 |
| A40 | -344.818 | 486.273 | 1.317.363 | -542.358 | -369.224 | 162.532 | -542.358 | -189.337 | 1.835.176 | -542.358 | 247.435 | 10.326.452 |
The mid-term results year 25 using constructive solutions T1 (overlying) and T2 (ventilated facade) with wooden structures and 7 to 15 cm insulation thickness, show reduction values for CO2e emissions, being a little more elevated if 15 cm insulation thickness is used. In scenarios with differences of 3 and 6% in the cost of the stored energy, deficit seems to occur. In the case of an alleged increase in the cost of energy by 10%, the graph shows, in year 25, a benefit obtained from the investment made. (Table 3) Block A Efficiency. CO2e emissions and Economic Cost Reductions after Renovating the Skin of Block A Buildings, years 0-25-50).
For year 50, it is evident that the use of solutions T1 or T2, with wooden structures and 15 cm insulation thickness, would achieve a better relation between reducing CO2e emissions and recovering investment. In the three alleged economic scenarios, the recovery of investment is shown in the medium term.
Constructive solutions T1 (overlying) and T2 (ventilated facade) using aluminum structures, show a high initial investment in CO2e, which will be stabilized over time, but will always be higher than the results showed by the use of wooden structures. The economic cost in this case will be very similar to the cost of using wooden structures and its amortization will produce similar values between them.
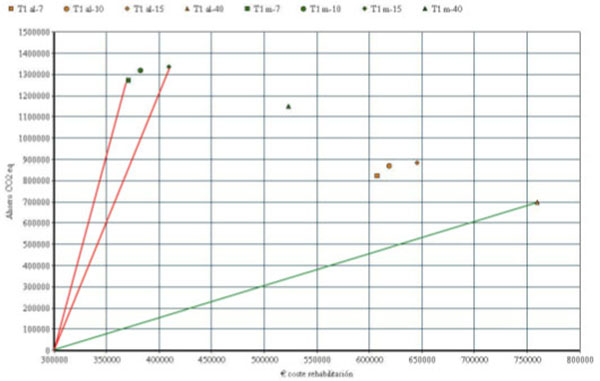
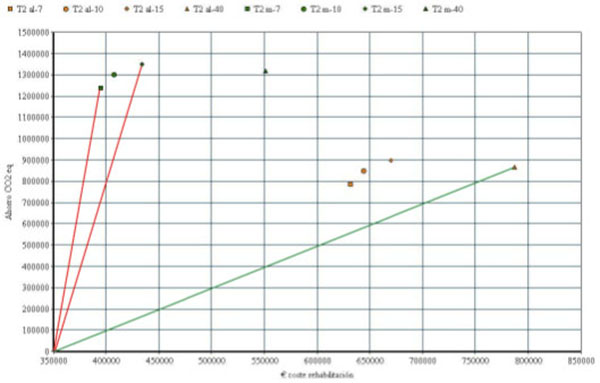
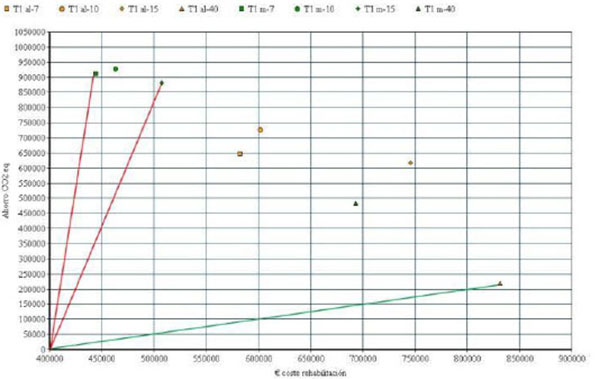
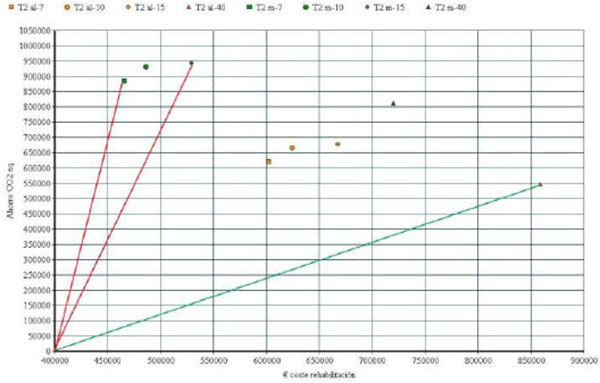
A summary of the above analysis would consist in relating the building skin renovation investment and reducing CO2e emissions over time -in this case, year 50-. Therefore, it is possible to evaluate the results obtained and relate them to the angle occurring when point zero is joint to the studied point and the abscissa axis. The widest angle indicates the optimal renovation choice and the narrowest angle indicates the most deficient choice. If both angles are known, then the rest of the angles will give us guidance on the most feasible proposal.
For Block A (Table 4 Block A, Efficiency between Renovation Investment and Reduction of CO2e Emissions in Year 50, and Figs. (35 and 36)), graphs show that the widest angle occurs using wooden structures with 7cm insulation thickness in either of the constructive proposals. The narrowest angle is produced using aluminum structures with 40 cm insulation thickness in solutions T1 (overlying) and T2 (ventilated facade).
The most efficient point between investment and reduction of CO2e emissions is proposal T2, using wooden structures and 7 cm insulation thickness to reduce emissions by 1,235,423 kg CO2e with an investment of €395,198. Angles in proposal T2 (ventilated façade), with 7, 10 and 15 cm insulation thickness are very close, as shown in the graphs (Fig. 37), in which 15 cm insulation thickness is to produce a greater reduction of CO2e emissions, but with a slightly higher economic cost.
| Constructive proposal | T1-7 | T1-10 | T1-15 | T1-40 | T1-7 | T1-10 | T1-15 | T1-40 | |
|---|---|---|---|---|---|---|---|---|---|
| Carpentry AL € | 607.079 | 618.372 | 645.606 | 759.940 | Carpentry M € | 370.549 | 381.842 | 409.076 | 523.409 |
| Reduction CO2 eq | 820.671 | 868.558 | 882.080 | 697.812 | Reduction CO2 eq | 1.272.379 | 1.320.266 | 1.333.788 | 1.149.520 |
| Constructive proposal | T2-7 | T2-10 | T2-15 | T2-40 | T2-7 | T2-10 | T2-15 | T2-40 | |
| Carpentry AL € | 631.729 | 643.657 | 670.337 | 787.619 | Carpentry M € | 395.198 | 407.127 | 433.807 | 551.089 |
| Reduction CO2 eq | 783.715 | 849.356 | 895.664 | 865.655 | Reduction CO2 eq | 1.235.423 | 1.301.064 | 1.347.372 | 1.317.363 |
8.2. Block E-F Efficiency
Block E-F is a linear block with 4 staircases and two apartments per floor. Year 0 is when renovation investment occurs and investment shows deficit the renovation process will produce more emissions than the ones emitted in an entire year. However, after that in the years to come, the reduction of emissions will be evident as well as the economic cost (Table 5 Block E-F Efficiency. Reduction of CO2e emissions and economic costs after Renovating the skin of a Block E-F building, Years 0-25-50).
| Kg CO2 eq | Cost 3% | Cost 6% | Cost 10% | |||||||||
|---|---|---|---|---|---|---|---|---|---|---|---|---|
| Year | 0 | 25 | 50 | 0 | 25 | 50 | 0 | 25 | 50 | 0 | 25 | 50 |
| T1 + Aluminium | ||||||||||||
| A7 | -515.919 | 65.431 | 646.781 | -577.009 | -360.290 | 93.470 | -577.009 | -241.388 | 1.199.051 | -577.009 | 47.308 | 6.811.599 |
| A10 | -505.172 | 110.353 | 725.878 | -595.510 | -365.986 | 114.587 | -595.510 | -240.058 | 1.285.495 | -595.510 | 65.697 | 7.229.680 |
| A15 | -664.315 | -23.940 | 616.435 | -639.694 | -400.706 | 99.681 | -639.694 | -269.587 | 1.318.866 | -639.694 | 48.775 | 7.508.132 |
| A40 | -1.130.999 | -456.274 | 218.451 | -824.860 | -572.579 | -44.358 | -824.860 | -434.166 | 1.242.645 | -824.860 | -98.095 | 7.776.191 |
| T1 + Wood | ||||||||||||
| A7 | -196.822 | 357.138 | 911.097 | -438.604 | -312.432 | 50.781 | -438.604 | -193.530 | 1.156.362 | -438.604 | 95.166 | 6.768.910 |
| A10 | -249.075 | 339.060 | 927.194 | -457.105 | -318.128 | 71.898 | -457.105 | -192.200 | 1.242.806 | -457.105 | 113.555 | 7.186.991 |
| A15 | -345.218 | 267.767 | 880.751 | -501.289 | -352.848 | 56.991 | -501.289 | -221.729 | 1.276.177 | -501.289 | 96.633 | 7.465.442 |
| A40 | -811.902 | -164.567 | 482.767 | -686.455 | -524.721 | -87.047 | -686.455 | -386.308 | 1.199.956 | -686.455 | -50.237 | 7.733.502 |
| T2 + Aluminium | ||||||||||||
| A7 | -542.632 | 38.718 | 620.068 | -596.730 | -380.011 | 73.750 | -596.730 | -261.109 | 1.179.331 | -596.730 | 27.587 | 6.791.878 |
| A10 | -564.243 | 51.282 | 666.807 | -618.327 | -388.803 | 91.770 | -618.327 | -262.875 | 1.262.678 | -618.327 | 42.880 | 7.206.863 |
| A15 | -603.796 | 36.579 | 676.954 | -661.555 | -422.567 | 77.819 | -661.555 | -291.448 | 1.297.004 | -661.555 | 26.914 | 7.486.270 |
| A40 | -804.232 | -129.507 | 545.218 | -851.810 | -599.529 | -71.307 | -851.810 | -461.115 | 1.215.695 | -851.810 | -125.045 | 7.749.241 |
| T2 + Wood | ||||||||||||
| A7 | -223.535 | 330.424 | 884.384 | -460.325 | -334.153 | 29.060 | -460.325 | -215.251 | 1.134.641 | -460.325 | 73.445 | 6.747.189 |
| A10 | -245.146 | 342.989 | 931.123 | -479.922 | -340.945 | 49.081 | -479.922 | -215.017 | 1.219.989 | -479.922 | 90.738 | 7.164.174 |
| A15 | -284.699 | 328.285 | 941.270 | -523.150 | -374.710 | 35.130 | -523.150 | -243.590 | 1.254.315 | -523.150 | 74.772 | 7.443.581 |
| A40 | -485.135 | 162.200 | 809.534 | -713.405 | -551.671 | -113.997 | -713.405 | -413.257 | 1.173.006 | -713.405 | -77.187 | 7.706.552 |
The table above shows the evolution of CO2e emissions, with the various insulation thicknesses for the years studied and the three assessed energy increases. Year 0 is identical for all the constructive proposals and scenarios, since it is the year in which investment is made to renovate the facade.
In year 25, using wooden structures in both solutions T1 (overlying) and T2 (ventilated facade) and 7 -15 cm insulation thickness, CO2e emissions reductions are very close to each other, with the highest change given by constructive solution T1 if 7 cm insulation thickness is used. The use of aluminum in both proposals, T1 (overlying) and T2 (ventilated facade), show a wider gap between both proposals when using wooden structures, and even some values are negative. From the economic point of view, the constructive proposals will be in deficit, saved on the assumption of an annual increase of 10% in the accumulated price of energy.
For year 50, the table shows that by using wooden structures for solutions T1 (overlying) and T2 (ventilated facade) and 15 cm insulation thickness, a better relationship between the reduction in CO2e emissions and return on investment would be achieved, followed, at a short distance by the same type of solution and aluminum structures with an insulation thickness of 10 cm (Table 5 Block E-F Efficiency. Reduction of CO2e emissions and economic costs after renovating the skin of a Block E-F building, Years 0-25-50.
Constructive solutions T1 (overlying) and T2 (ventilated facade) using aluminum structures show a high initial investment in CO2e emissions, which is gradually balanced over time, but will always be higher than the results provided after using wooden structures.
As in case A, we relate the investment in the renovation of the building skin and the reduction of CO2e emissions over time -50 years.
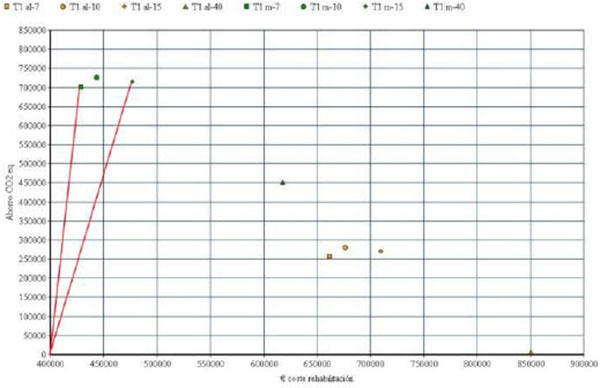
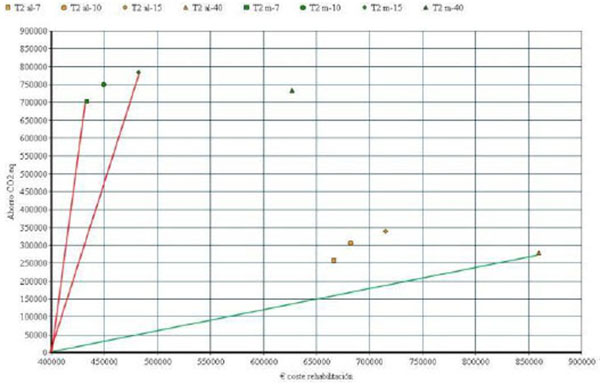
In Block E-F (Table 6 Block E-F, Efficiency between investment in renovation € and CO2e emissions reduction for year 50 and Figs. 38 and 39) the graphs show that the widest angle occurs when using wooden structures and 7 cm insulation thickness in any of the constructive proposals. The narrowest angle occurs when using aluminum structures with 40 cm insulation thickness in solutions T1 (overlying) and T2 (ventilated facade).
The most efficient point between investment and reduction of CO2e emissions will be proposal T1 using wooden structures and 7 cm insulation thickness to reduce CO2e emissions by 911.097 kg with an investment of 444,375€. The angles of proposal T1 and proposal T2 with 7, 10 and 15 cm grades of are very close, as shown in the graphs (Figs. 38 and 39). Proposal T2 would get the maximum reduction of CO2e emissions with 941,270 kg but with a significantly higher cost of 941,270 €.
| Constructive proposal | T1-7 | T1-10 | T1-15 | T1-40 | T1-7 | T1-10 | T1-15 | T1-40 | |
|---|---|---|---|---|---|---|---|---|---|
| Carpentry AL € | 582.780 | 601.622 | 646.058 | 831.578 | Carpentry M € | 444.375 | 463.217 | 507.653 | 693.173 |
| Reduction CO2 eq | 646.781 | 725.875 | 616.435 | 218.451 | Reduction CO2 eq | 911.097 | 927.194 | 880.751 | 482.767 |
| Constructive proposal | T2-7 | T2-10 | T2-15 | T2-40 | T2-7 | T2-10 | T2-15 | T2-40 | |
| Carpentry AL € | 602.501 | 624.439 | 667.919 | 858.528 | Carpentry M € | 466.096 | 486.034 | 529.514 | 720.123 |
| Reduction CO2 eq | 620.068 | 666.807 | 676.954 | 545.218 | Reduction CO2 eq | 884.384 | 931.123 | 941.270 | 809.534 |
8.3. Block Q Efficiency
Block Q is a ground floor tower with 14 floors and four apartments per floor. CO2e emissions in year 25 will be reduced only by using wooden structures in both constructive proposals T1 (overlying) and T2 (ventilated facade). In year 50, the two constructive solutions will provide positive results, although the proposals using aluminum structures are at a considerable distance from the rest (Table 7 Block Q Efficiency. CO2e Emissions and Economic Cost Reductions after Renovating the skin of a Block Q Building, Years 0-25-50).
| Kg CO2 eq | Cost 3% | Cost 6% | Csot 10% | |||||||||
|---|---|---|---|---|---|---|---|---|---|---|---|---|
| Year | 0 | 25 | 50 | 0 | 25 | 50 | 0 | 25 | 50 | 0 | 25 | 50 |
| T1 + Aluminium | ||||||||||||
| A7 | -704.099 | -223.999 | 256.101 | -656.974 | -482.014 | -115.687 | -656.974 | -386.023 | 776.862 | -656.974 | -152.955 | 5.307.941 |
| A10 | -743.457 | -231.207 | 281.043 | -671.264 | -484.475 | -93.380 | -671.264 | -381.994 | 859.515 | -671.264 | -133.168 | 5.696.945 |
| A15 | -815.685 | -273.310 | 269.065 | -704.820 | -507.403 | -94.057 | -704.820 | -399.092 | 913.054 | -704.820 | -136.108 | 6.025.714 |
| A40 | -1.167.068 | -580.668 | 5.732 | -845.047 | -631.934 | -185.721 | -845.047 | -515.010 | 901.468 | -845.047 | -231.116 | 6.420.652 |
| T1 + Wood | ||||||||||||
| A7 | -166.992 | 267.004 | 701.000 | -424.009 | -401.459 | -187.542 | -424.009 | -305.468 | 705.007 | -424.009 | -72.400 | 5.236.087 |
| A10 | -206.351 | 259.795 | 725.941 | -438.299 | -403.920 | -165.235 | -438.299 | -301.439 | 787.660 | -438.299 | -52.613 | 5.625.091 |
| A15 | -278.578 | 217.693 | 713.964 | -471.855 | -426.849 | -165.912 | -471.855 | -318.537 | 841.199 | -471.855 | -55.553 | 5.953.859 |
| A40 | -629.962 | -89.666 | 450.630 | -612.083 | -551.379 | -257.576 | -612.083 | -434.455 | 829.614 | -612.083 | -150.561 | 6.348.797 |
| T2 + Aluminium | ||||||||||||
| A7 | -703.742 | -223.642 | 256.458 | -662.113 | -487.154 | -120.827 | -662.113 | -391.163 | 771.722 | -662.113 | -158.094 | 5.302.802 |
| A10 | -718.733 | -206.483 | 305.767 | -677.275 | -490.486 | -99.392 | -677.275 | -388.005 | 853.503 | -677.275 | -139.179 | 5.690.934 |
| A15 | -745.959 | -203.584 | 338.791 | -710.071 | -512.655 | -99.309 | -710.071 | -404.343 | 907.802 | -710.071 | -141.360 | 6.020.463 |
| A40 | -885.615 | -299.215 | 287.185 | -854.345 | -641.232 | -195.019 | -854.345 | -524.308 | 892.171 | -854.345 | -240.414 | 6.411.354 |
The table shows that in the medium term -year 25- when investment is yet to be returned, for all the constructive solutions and insulation thickness, and with a difference in the accumulated annual energy costs in the 3%, 6%, and 10% proposed scenarios. This is so, because Q-type buildings, due to their constructive features -compact buildings with a balanced ratio of solid parts and openings- show heating costs of 9,935€ without being intervened. In case of an intervention using any of the constructive solutions, either wooden or aluminum structures, with 15 cm insulation thickness, the cost will be 4,678€ per year. Therefore, economic investment will require a longer time for repayment.
For year 50, it is evident that the use of solutions T1 (overlying) and T2 (ventilated facade) with wooden structures and 10-15 cm insulation thickness, would show a better relationship between reducing CO2e emissions and obtaining a return on investment between 6% and 10% of the differences of annual cumulative energy costs.
As in previous cases, the investment in the renovation of the building skin and the reduction of CO2e emissions is related over time -50 years.
For Block Q (Table 8 Block Q, Efficiency between Renovation Investment and Reduction of CO2e Emissions in Year 50 and Figs. (39 and 40), the graphs show that the widest angle occurs using wooden structures, and 7cm insulation thickness in either of the constructive proposals. The narrowest angle occurs using aluminum structures and 40 cm insulation thickness in solutions T1 (overlying) and T2 (ventilated facade). For solution T1, emission reduction is minimal.
The most efficient point between investment and CO2e emission reduction will be proposal T1-7 and T2-7 with similar investment and reduction values -T1/7 428.668€ - 701.00 kg CO2e and T2/7 433.808€ - 701.357 kg CO2e. The angles of the values between 7 and 15 cm insulation thickness using wooden structures are really close. The proposal that reduces CO2e emissions the most is proposal T2, with 15 cm insulation thickness and a slightly higher cost.
| Constructive proposal | T1-7 | T1-10 | T1-15 | T1-40 | T1-7 | T1-10 | T1-15 | T1-40 | |
|---|---|---|---|---|---|---|---|---|---|
| Carpentry AL € | 661.633 | 676.238 | 710.077 | 850.722 | Carpentry M € | 428.668 | 443.273 | 477.112 | 617.758 |
| Reduction CO2 eq | 256.101 | 281.043 | 269.065 | 5.723 | Reduction CO2 eq | 701.000 | 725.941 | 713.964 | 450.630 |
| Constructive proposal | T2-7 | T2-10 | T2-15 | T2-40 | T2-7 | T2-10 | T2-15 | T2-40 | |
| Carpentry AL € | 666.772 | 682.249 | 715.328 | 860.020 | Carpentry M € | 433.808 | 449.285 | 482.364 | 627.050 |
| Reduction CO2 eq | 256.458 | 305.767 | 338.791 | 287.185 | Reduction CO2 eq | 701.357 | 750.665 | 783.689 | 732.094 |
8.4. Block UNI14 Efficiency
A UNI14 building contains 14 single-family attached houses, each one with three levels, which originally had a level that was used as a workshop or production area, intended to render community services for the inhabitants of Montbau.
CO2e emissions show negative results in the graph for years 25 and 50, using any of the constructive solutions, T1 (overlying) and T2 (ventilated facade), and aluminum structures and insulation of any thickness. Same thing happens if wooden structures and insulation of any thickness are used for year 25, with constructive solution T2. For year 25, making improvements in year 50, solution T1 will show positive results if wooden structures and 7-15 cm insulation thickness are used, a proposal that would prove a greater beneficial impact in the medium and long terms. (Table 9 Block UNI14. Efficiency. CO2e Emissions and Economic Costs Reductions after Renovating the skin of a Block UNI14 Building, Years 0-25-50).
Negative results are caused by the high amount of envelope single-family houses have -the roof in this case-, which would require a higher initial investment in relation to the volume and inner surface of the building.
| Kg CO2 eq | Cost 3% | Cost 6% | Cost 10% | |||||||||
|---|---|---|---|---|---|---|---|---|---|---|---|---|
| Year | 0 | 25 | 50 | 0 | 25 | 50 | 0 | 25 | 50 | 0 | 25 | 50 |
| T1 + Aluminium | ||||||||||||
| A7 | -341.393 | -178.743 | -16.093 | -268.630 | -208.959 | -84.019 | -268.630 | -176.220 | 220.394 | -268.630 | -96.730 | 1.765.765 |
| A10 | -359.653 | -184.678 | -9.703 | -273.273 | -209.132 | -74.836 | -273.273 | -173.942 | 252.375 | -273.273 | -88.498 | 1.913.479 |
| A15 | -394.298 | -207.898 | -21.498 | -287.817 | -219.470 | -76.368 | -287.817 | -181.972 | 272.299 | -287.817 | -90.926 | 2.042.328 |
| A40 | -566.673 | -363.073 | -159.473 | -352.434 | -277.816 | -112.791 | -352.434 | -236.877 | 259.077 | -352.434 | -137.477 | 2.191.521 |
| T1 + Wood | ||||||||||||
| A7 | -96.072 | 45.520 | 187.113 | -162.225 | -172.166 | -116.839 | -162.225 | -139.427 | 187.575 | -162.225 | -59.937 | 1.732.946 |
| A10 | -114.332 | 39.586 | 193.503 | -166.867 | -172.339 | -107.655 | -166.867 | -137.148 | 219.555 | -166.867 | -51.705 | 1.880.659 |
| A15 | -148.976 | 16.366 | 181.708 | -181.411 | -182.677 | -109.187 | -181.411 | -145.179 | 239.480 | -181.411 | -54.133 | 2.009.509 |
| A40 | -321.351 | -138.809 | 43.733 | -246.028 | -241.023 | -154.402 | -246.028 | -200.084 | 226.258 | -246.028 | -100.684 | 2.158.702 |
| T2 + Aluminium | ||||||||||||
| A7 | -467.560 | -304.910 | -142.260 | -340.434 | -280.762 | -155.823 | -340.434 | -248.024 | 148.590 | -340.434 | -168.533 | 1.693.962 |
| A10 | -481.567 | -306.592 | -131.617 | -345.228 | -281.088 | -146.792 | -345.228 | -245.897 | 180.419 | -345.228 | -160.454 | 1.841.523 |
| A15 | -508.358 | -321.958 | -135.558 | -359.640 | -291.293 | -148.191 | -359.640 | -253.795 | 200.476 | -359.640 | -162.749 | 1.970.505 |
| A40 | -643.782 | -440.182 | -236.582 | -424.963 | -350.345 | -194.112 | -424.963 | -309.406 | 186.548 | -424.963 | -210.006 | 2.118.992 |
For proposals T1 (overlying) and T2 (ventilated facade) T2, using aluminum structures and insulation of any thickness, there is a deficit in the initial cost of CO2e emissions investment made for the renovation of the envelope. The economic costs will be negative in the medium term -year 25- in any of the scenarios in which the cost of energy is increased and using any of the proposed solutions. The numbers will be positive for year 50 in increase scenarios of 6% and 10% and constructive solutions T1 (overlying) and T2 (ventilated facade) using aluminum and wooden structures and insulation of any thickness.
It is evident, for year 50, that by using solutions T1 (overlying) or T2 (ventilated facade), with wooden structures and 10 cm insulation thickness, a better relationship between CO2e emissions reductions and return on investment would be achieved.
In the case of single-family houses, lower emissions and costs reductions will occur if compared to the rest of the buildings studied. The greatest amount of skin surface linked to a higher investment in renovation would produce more accurate results.
As in the previous cases, we relate investment in the renovation of a building skin and the reduction of CO2e emissions over time -50 years-.
For Block UNI14 (Table 10 Block UNI14. Efficiency Between Renovation Investment and CO2e Emission Reduction in Year 50 and Figs. 41 and 42), the graphs show that the widest angle point, therefore the most efficient, occurs when using wooden structures with 7 cm insulation thickness for proposal T1 (overlying) with a cost of 163,814€ and CO2 emissions reduction of 187,113 kg. The graphs (Figs. 41 and 42) show negative angles indicating a higher initial investment of CO2e emissions for materials used in the construction, than the benefits obtained in such period.
Proposal T1 (overlying) produces a greater reduction in CO2e emissions within the whole set with a minimum investment difference if compared to the most efficient one which is 4,716€.
| Constructive proposal | T1-7 | T1-10 | T1-15 | T1-40 | T1-7 | T1-10 | T1-15 | T1-40 | |
|---|---|---|---|---|---|---|---|---|---|
| Carpentry AL € | 270.219 | 274.981 | 289.637 | 354.421 | Carpentry M € | 163.814 | 168.575 | 183.231 | 248.015 |
| Reduction CO2 eq | -16.093 | -9.703 | -21.498 | -159.473 | Reduction CO2 eq | 187.113 | 193.503 | 181.708 | 43.733 |
| Constructive proposal | T2-7 | T2-10 | T2-15 | T2-40 | T2-7 | T2-10 | T2-15 | T2-40 | |
| Carpentry AL € | 342.023 | 346.936 | 361.460 | 426.950 | Carpentry M € | 235.617 | 240.531 | 255.054 | 320.545 |
| Reduction CO2 eq | -142.260 | -131.617 | -135.558 | -236.582 | Reduction CO2 eq | 60.946 | 71.589 | 67.648 | -33.376 |
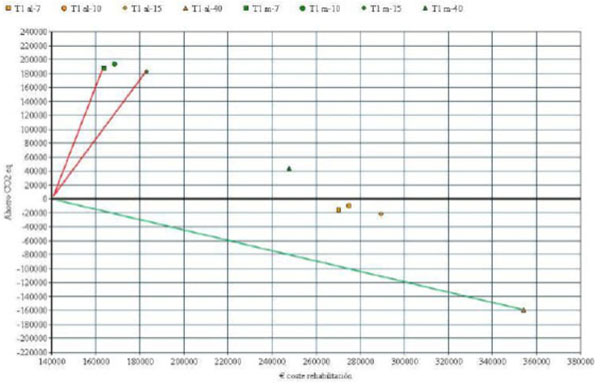
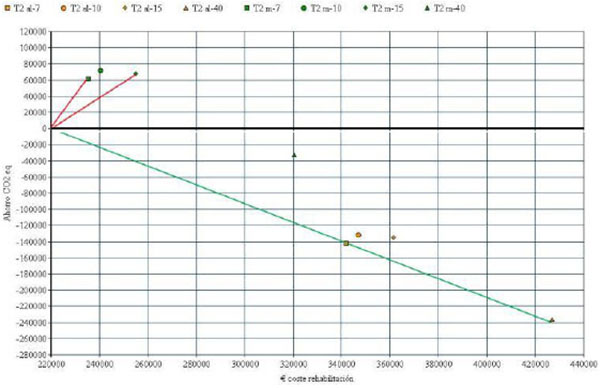
8.5. Efficient Renovation of Montbau
At this point, it is time to analyze the overall performance of the neighborhood of Montbau and its buildings. We start with the selection of the most efficient solutions and extrapolate the remaining buildings per square meter, studying their status in the medium term -year 25- and normal term year 50.
Depending on the point of optimization, the constructive solution is selected, as well as the materials for the structures and insulation thickness in order to establish optimal reduction rates for all the neighborhood.
The analysis of efficiency has led to propose more effective solutions for the conditions established in this studio. For type A duplex buildings, the most efficient constructive solution is T2 (ventilated facade), using wood materials and 15 cm insulation thickness. The same constructive proposal is useful for Linear Blocks E-F and Q Towers. Finally, for Block UNI14 or single-family houses, the most effective constructive solution would be solution T1 (Overlying) using wooden materials and 10 cm insulation thickness.
The results for the four types of buildings will be extrapolated to the remaining buildings in Montbau, to get an overall picture of what jointly acting would be like in this residential neighborhood.
We extract the values of heating energy consumption in kWh and CO2e emissions to choose the evolution in the cost of energy from 6%, as it is an intermediate situation between cheap energy, 3%, and a significant increase of 10%. (See Table 11 Montbau - like buildings with no renovation, year 25, and Table 12. Montbau-like buildings with no renovation, year 50)
| Year 25 | Type of building | Constructed area | Total heating energy kWh | Heating energykWh/m2 | Total emissions Kg CO2 eq | Emissions Kg CO2 eq/m2 | Heating energy cost 6% € | Heating energy cost 6% €/m2 |
|---|---|---|---|---|---|---|---|---|
| BUILDING A | Duplex | 3.954 | 5.010.460 | 1.267,19 | 1.378.858 | 348,72 | 782.248 | 197,84 |
| BUILDING E - F | Lineal | 2.599 | 2.857.920 | 1.099,62 | 787.280 | 302,92 | 448.819 | 172,69 |
| BUILDING Q | Tower | 3.524 | 3.753.880 | 1.065,23 | 1.033.552 | 293,29 | 587.719 | 166,78 |
| SINGLE FAMILY 14 | single family | 1.353 | 1.768.910 | 1.307,40 | 485.290 | 358,68 | 271.232 | 200,47 |
| Year 50 | Type of building | Constructed area | Total heating energy kWh | Heating energykWh/m2 | Total emissions Kg CO2 eq | Emissions Kg CO2 eq/m2 | Heating energy cost 6% € | Heating energy cost 6% €/m2 |
| BUILDING A | Duplex | 3.954 | 9.828.210 | 2.485,64 | 2.704.683 | 684,04 | 4.082.990 | 1.032,62 |
| BUILDING E - F | Lineal | 2.599 | 5.605.920 | 2.156,95 | 1.544.280 | 594,18 | 2.342.532 | 901,32 |
| BUILDING Q | Tower | 3.524 | 7.363.380 | 2.089,49 | 2.027.352 | 575,30 | 3.067.491 | 870,46 |
| SINGLE FAMILY 14 | single family | 1.353 | 3.469.785 | 2.564,51 | 951.915 | 703,56 | 1.415.647 | 1.046,30 |
| Kg CO2 eq | Cost 3% | Cost 6% | Csot 10% | |||||||||
|---|---|---|---|---|---|---|---|---|---|---|---|---|
| Year | 0 | 25 | 50 | 0 | 25 | 50 | 0 | 25 | 50 | 0 | 25 | 50 |
| T1 + Aluminium | ||||||||||||
| A7 | -704.099 | -223.999 | 256.101 | -656.974 | -482.014 | -115.687 | -656.974 | -386.023 | 776.862 | -656.974 | -152.955 | 5.307.941 |
| A10 | -743.457 | -231.207 | 281.043 | -671.264 | -484.475 | -93.380 | -671.264 | -381.994 | 859.515 | -671.264 | -133.168 | 5.696.945 |
| A15 | -815.685 | -273.310 | 269.065 | -704.820 | -507.403 | -94.057 | -704.820 | -399.092 | 913.054 | -704.820 | -136.108 | 6.025.714 |
| A40 | -1.167.068 | -580.668 | 5.732 | -845.047 | -631.934 | -185.721 | -845.047 | -515.010 | 901.468 | -845.047 | -231.116 | 6.420.652 |
| T1 + Wood | ||||||||||||
| A7 | -166.992 | 267.004 | 701.000 | -424.009 | -401.459 | -187.542 | -424.009 | -305.468 | 705.007 | -424.009 | -72.400 | 5.236.087 |
| A10 | -206.351 | 259.795 | 725.941 | -438.299 | -403.920 | -165.235 | -438.299 | -301.439 | 787.660 | -438.299 | -52.613 | 5.625.091 |
| A15 | -278.578 | 217.693 | 713.964 | -471.855 | -426.849 | -165.912 | -471.855 | -318.537 | 841.199 | -471.855 | -55.553 | 5.953.859 |
| A40 | -629.962 | -89.666 | 450.630 | -612.083 | -551.379 | -257.576 | -612.083 | -434.455 | 829.614 | -612.083 | -150.561 | 6.348.797 |
| T2 + Aluminium | ||||||||||||
| A7 | -703.742 | -223.642 | 256.458 | -662.113 | -487.154 | -120.827 | -662.113 | -391.163 | 771.722 | -662.113 | -158.094 | 5.302.802 |
| A10 | -718.733 | -206.483 | 305.767 | -677.275 | -490.486 | -99.392 | -677.275 | -388.005 | 853.503 | -677.275 | -139.179 | 5.690.934 |
| A15 | -745.959 | -203.584 | 338.791 | -710.071 | -512.655 | -99.309 | -710.071 | -404.343 | 907.802 | -710.071 | -141.360 | 6.020.463 |
| A40 | -885.615 | -299.215 | 287.185 | -854.345 | -641.232 | -195.019 | -854.345 | -524.308 | 892.171 | -854.345 | -240.414 | 6.411.354 |
The values per square meter are extended to other buildings in the neighborhood, by setting two tables with the values of buildings that are not renovated for the years 25 and 50 (Tables 13 and 14 Summary of non-renovated buildings in the neighborhood of Montbau) and two additional tables with the values of buildings renovated for the years 25 and 50 (Tables 15 and 16 Summary of buildings renovated with optimal proposals in the neighborhood of Montbau).
| No rehabilitate year 25 | Type of building | Number of households | Constructed area | Heating energyn kWh/m2 | Total heating energy kWh | EmissionsKg CO2 eq/m2 | Total emissions de Kg CO2 eq | Heating energy cost 6% €/m2 | Total Coste energía de calefacción al 6% € |
|---|---|---|---|---|---|---|---|---|---|
| BUILDING A | Duplex | 32 | 3.954 | 1.267,19 | 5.010.469 | 348,72 | 1.378.839 | 197,84 | 782.259 |
| BUILDING B | linear | 50 | 4.350 | 1.099,62 | 4.783.347 | 302,92 | 1.317.702 | 172,69 | 751.202 |
| BUILDING C - D | linear | 56 | 5.220 | 1.099,62 | 5.740.016 | 302,92 | 1.581.242 | 172,69 | 901.442 |
| BUILDING E - F | linear | 140 | 8.960 | 1.099,62 | 9.852.595 | 302,92 | 2.714.163 | 172,69 | 1.547.302 |
| BUILDING G | linear | 140 | 9.733 | 1.099,62 | 10.702.601 | 302,92 | 2.948.320 | 172,69 | 1.680.792 |
| BUILDING H | linear | 150 | 10.552 | 1.099,62 | 11.603.190 | 302,92 | 3.196.412 | 172,69 | 1.822.225 |
| BUILDING I | linear | 142 | 8.958 | 1.099,62 | 9.850.396 | 302,92 | 2.713.557 | 172,69 | 1.546.957 |
| BUILDING J | linear | 40 | 3.398 | 1.099,62 | 3.736.509 | 302,92 | 1.029.322 | 172,69 | 586.801 |
| BUILDING K | linear | 51 | 4.036 | 1.099,62 | 4.438.066 | 302,92 | 1.222.585 | 172,69 | 696.977 |
| BUILDING L | linear | 30 | 1.798 | 1.099,62 | 1.977.117 | 302,92 | 544.650 | 172,69 | 310.497 |
| BUILDING N | Duplex | 120 | 13.504 | 1.267,19 | 17.112.134 | 348,72 | 4.709.115 | 197,84 | 2.671.631 |
| SINGLE FAMILY 14 | single family | 14 | 1.353 | 1.307,40 | 1.768.912 | 358,68 | 485.294 | 200,47 | 271.236 |
| SINGLE FAMILY 52 | single family | 52 | 7.366 | 1.307,40 | 9.630.308 | 358,68 | 2.642.037 | 200,47 | 1.476.662 |
| BUILDING P | linear | 387 | 33.361 | 1.099,62 | 36.684.423 | 302,92 | 10.105.714 | 172,69 | 5.761.111 |
| BUILDING Q | tower | 504 | 39.150 | 1.065,23 | 41.703.755 | 293,29 | 11.482.304 | 166,78 | 6.529.437 |
| BUILDING R | linear | 51 | 4.713 | 1.099,62 | 5.182.509 | 302,92 | 1.427.662 | 172,69 | 813.888 |
| TOTAL | 1.959 | 160.406 | 179.776.348 | 49.498.919 | 28.150.418 |
| No rehabilitate year 50 | Type of building | Number of households | Constructed area | Heating energyn kWh/m2 | Total heating energy kWh | EmissionsKg CO2 eq/m2 | Total emissions de Kg CO2 eq | Heating energy cost 6% €/m2 | Total Coste energía de calefacción al 6% € |
|---|---|---|---|---|---|---|---|---|---|
| BUILDING A | Duplex | 32 | 3.954 | 2.485,64 | 9.828.221 | 684,04 | 2.704.694 | 1.032,62 | 4.082.979 |
| BUILDING B | linear | 50 | 4.350 | 2.156,95 | 9.382.733 | 594,18 | 2.584.683 | 901,32 | 3.920.742 |
| BUILDING C - D | linear | 56 | 5.220 | 2.156,95 | 11.259.279 | 594,18 | 3.101.620 | 901,32 | 4.704.890 |
| BUILDING E - F | linear | 140 | 8.960 | 2.156,95 | 19.326.272 | 594,18 | 5.323.853 | 901,32 | 8.075.827 |
| BUILDING G | linear | 140 | 9.733 | 2.156,95 | 20.993.594 | 594,18 | 5.783.154 | 901,32 | 8.772.548 |
| BUILDING H | linear | 150 | 10.552 | 2.156,95 | 22.760.136 | 594,18 | 6.269.787 | 901,32 | 9.510.729 |
| BUILDING I | linear | 142 | 8.958 | 2.156,95 | 19.321.958 | 594,18 | 5.322.664 | 901,32 | 8.074.025 |
| BUILDING J | linear | 40 | 3.398 | 2.156,95 | 7.329.316 | 594,18 | 2.019.024 | 901,32 | 3.062.685 |
| BUILDING K | linear | 51 | 4.036 | 2.156,95 | 8.705.450 | 594,18 | 2.398.110 | 901,32 | 3.637.728 |
| BUILDING L | linear | 30 | 1.798 | 2.156,95 | 3.878.196 | 594,18 | 1.068.336 | 901,32 | 1.620.573 |
| BUILDING N | Duplex | 120 | 13.504 | 1.267,19 | 17.112.134 | 684,04 | 9.237.276 | 1.032,62 | 13.944.500 |
| SINGLE FAMILY 14 | single family | 14 | 1.353 | 2.564,51 | 3.469.782 | 703,56 | 951.917 | 1.046,30 | 1.415.644 |
| SINGLE FAMILY 52 | single family | 52 | 7.366 | 2.485,64 | 18.309.224 | 703,56 | 5.182.423 | 1.046,30 | 7.707.046 |
| BUILDING P | linear | 387 | 33.361 | 2.156,95 | 71.958.009 | 594,18 | 19.822.439 | 901,32 | 30.068.937 |
| BUILDING Q | tower | 504 | 39.150 | 2.089,49 | 81.803.534 | 575,30 | 22.522.995 | 870,46 | 34.078.509 |
| BUILDING R | linear | 51 | 4.713 | 2.156,95 | 10.165.705 | 594,18 | 2.800.370 | 901,32 | 4.247.921 |
| TOTAL | 1.959 | 160.406 | 335.603.543 | 97.093.345 | 146.925.283 |
| Rehabilitate year 25 | Type of building | Number of households | Constructed area | Heating energyn kWh/m2 | Total heating energy kWh | EmissionsKg CO2 eq/m2 | Total emissions de Kg CO2 eq | Heating energy cost 6% €/m2 | Total Coste energía de calefacción al 6% € |
|---|---|---|---|---|---|---|---|---|---|
| BUILDING A | Duplex | 32 | 3.954 | 699,01 | 2.763.886 | 205,03 | 810.689 | 223,68 | 884.431 |
| BUILDING B | linear | 50 | 4.350 | 584,77 | 2.543.750 | 176,60 | 768.210 | 266,41 | 1.158.884 |
| BUILDING C - D | linear | 56 | 5.220 | 584,77 | 3.052.499 | 176,60 | 921.852 | 266,41 | 1.390.660 |
| BUILDING E - F | linear | 140 | 8.960 | 584,77 | 5.239.539 | 176,60 | 1.582.336 | 266,41 | 2.387.034 |
| BUILDING G | linear | 140 | 9.733 | 584,77 | 5.691.566 | 176,60 | 1.718.848 | 266,41 | 2.592.969 |
| BUILDING H | linear | 150 | 10.552 | 584,77 | 6.170.493 | 176,60 | 1.863.483 | 266,41 | 2.811.158 |
| BUILDING I | linear | 142 | 8.958 | 584,77 | 5.238.370 | 176,60 | 1.581.983 | 266,41 | 2.386.501 |
| BUILDING J | linear | 40 | 3.398 | 584,77 | 1.987.048 | 176,60 | 600.087 | 266,41 | 905.261 |
| BUILDING K | linear | 51 | 4.036 | 584,77 | 2.360.132 | 176,60 | 712.758 | 266,41 | 1.075.231 |
| BUILDING L | linear | 30 | 1.798 | 584,77 | 1.051.416 | 176,60 | 317.527 | 266,41 | 479.005 |
| BUILDING N | Duplex | 120 | 13.504 | 699,01 | 9.439.431 | 205,03 | 2.768.725 | 223,68 | 3.020.575 |
| SINGLE FAMILY 14 | single family | 14 | 1.353 | 1.053,49 | 1.425.372 | 329,42 | 445.705 | 301,83 | 408.376 |
| SINGLE FAMILY 52 | single family | 52 | 7.366 | 1.053,49 | 7.760.007 | 329,42 | 2.426.508 | 301,83 | 2.223.280 |
| BUILDING P | linear | 387 | 33.361 | 584,77 | 19.508.512 | 176,60 | 5.891.553 | 266,41 | 8.887.704 |
| BUILDING Q | tower | 504 | 39.150 | 742,36 | 29.063.394 | 211,73 | 8.289.230 | 258,66 | 10.126.539 |
| BUILDING R | linear | 51 | 4.713 | 584,77 | 2.756.021 | 176,60 | 832.316 | 266,41 | 1.255.590 |
| TOTAL | 1.959 | 160.406 | 106.051.437 | 31.531.808 | 41.993.197 |
| Rehabilitate year 50 | Type of building | Number of households | Constructed area | Heating energyn kWh/m2 | Total heating energy kWh | EmissionsKg CO2 eq/m2 | Total emissions de Kg CO2 eq | Heating energy cost 6% €/m2 | Total Coste energía de calefacción al 6% € |
|---|---|---|---|---|---|---|---|---|---|
| BUILDING A | Duplex | 32 | 3.954 | 1.193,03 | 4.717.241 | 342,52 | 1.354.324 | 578,58 | 2.287.705 |
| BUILDING B | linear | 50 | 4.350 | 765,70 | 3.330.795 | 232,02 | 1.009.287 | 418,71 | 1.821.389 |
| BUILDING C - D | linear | 56 | 5.220 | 765,70 | 3.996.954 | 232,02 | 1.211.144 | 418,71 | 2.185.666 |
| BUILDING E - F | linear | 140 | 8.960 | 765,70 | 6.860.672 | 232,02 | 2.078.899 | 418,71 | 3.751.642 |
| BUILDING G | linear | 140 | 9.733 | 765,70 | 7.452.558 | 232,02 | 2.258.251 | 418,71 | 4.075.304 |
| BUILDING H | linear | 150 | 10.552 | 765,70 | 8.079.666 | 232,02 | 2.448.275 | 418,71 | 4.418.228 |
| BUILDING I | linear | 142 | 8.958 | 765,70 | 6.859.141 | 232,02 | 2.078.435 | 418,71 | 3.750.804 |
| BUILDING J | linear | 40 | 3.398 | 765,70 | 2.601.849 | 232,02 | 788.404 | 418,71 | 1.422.777 |
| BUILDING K | linear | 51 | 4.036 | 765,70 | 3.090.365 | 232,02 | 936.433 | 418,71 | 1.689.914 |
| BUILDING L | linear | 30 | 1.798 | 765,70 | 1.376.729 | 232,02 | 417.172 | 418,71 | 752.841 |
| BUILDING N | Duplex | 120 | 13.504 | 1.193,03 | 16.110.677 | 342,52 | 4.625.390 | 578,58 | 7.813.144 |
| SINGLE FAMILY 14 | single family | 14 | 1.353 | 1.867,39 | 2.526.579 | 560,54 | 758.411 | 884,03 | 1.196.093 |
| SINGLE FAMILY 52 | single family | 52 | 7.366 | 1.867,39 | 13.755.195 | 560,54 | 4.128.938 | 884,03 | 6.511.765 |
| BUILDING P | linear | 387 | 33.361 | 765,70 | 25.544.518 | 232,02 | 7.740.419 | 418,71 | 13.968.584 |
| BUILDING Q | tower | 504 | 39.150 | 1.228,29 | 48.087.554 | 352,91 | 13.816.427 | 633,24 | 24.791.346 |
| BUILDING R | linear | 51 | 4.713 | 765,70 | 3.608.744 | 232,02 | 1.093.510 | 418,71 | 1.973.380 |
| TOTAL | 1.959 | 160.406 | 157.999.235 | 46.743.719 | 82.410.581 |
In year 25, consumption would be 179,776,348 kWh, with CO2e emissions released into the atmosphere equivalent to 49,498,919 kg and an energy cost, with 6% price increases, of 28,150,418€ in case 1,959 houses and apartments within an area of 160,406 m2 were not renovated. If we do the exercise for year 50 -non-renovated houses and apartments- the total energy consumption would be 335,603,543 kWh, with CO2e emissions released into the atmosphere equivalent to 97,093,345 kg, and a cumulative energy cost of 146,925,283€. Accumulated consumption values and emissions are doubled over time and economic costs are fivefold.
By Renovating with the optimal values estimated in this chapter -which include the necessary renovation energy, gas emissions released into the atmosphere, and their economic cost in year 2012- the following results are obtained for year 25: energy consumption equal to 106,051,437 kWh, 31,531,808 kg of CO2e emissions, and a price increased energy cost of 6% equal to 41,993,197€. The same variables for the year 50 are 157,999,235 kWh in energy consumption, 46,743,719 kg of CO2e emissions, and a cost of 82,410,581€ in energy. Between one and the other date, the increase in energy consumption and CO2e emissions is approximately 49%, and costs almost doubled between the two dates.
The results summary table (Table 17 Overall summary of renovated and non-renovated buildings scenario in the neighborhood of Montbau) shows that in the first 25 years, with the proposed improvements to buildings, reduction in energy consumption is 41% and 36% in CO2e emissions. The cost of energy shows a deficit of 49% caused by the initial investment in the renovation of facades. The economic value may vary, as already mentioned, depending on energy prices. On the other hand, the energy consumption reduction values and reduced emissions of greenhouse gases far exceed purely economic values.
When comparing the scenario in year 50, for non-renovated and renovated buildings, there is a decrease in energy consumption of 53%, CO2e emission reductions of 52%, and a decrease in energy costs of 45%.
Renovating the envelope of buildings using an optimal solution between investment costs and results can lead to reductions in consumption, emissions, and economic costs over 50% of consumption in non-renovated buildings. Usage values are considerably reduced, but initial investment values impact the overall results. Overall results confirm the need to act on the envelopes of the buildings and the benefits in the medium-term -year 25- and normal-term -year 50-.
| ASSEMBLY DISTRICT OF MONTBAU | Number of households | Constructed area | Total heating energykWh | % Reduction in heating energy | Total emissions Kg CO2 eq | % Reduction in CO2 eq emissions heating | Total Cost of heating energy 6% € | % Reduction in heating energy cost |
|---|---|---|---|---|---|---|---|---|
| NO REHABILITATION, YEAR 25 | 1.959 | 160.286 | 179.776.348 | 49.498.919 | 28.150.418 | |||
| REHABILITATE, YEAR 25 | 1.959 | 160.286 | 106.051.437 | 41 | 31.531.808 | 36 | 41.993.197 | -49 |
| NO REHABILITATION, YEAR 50 | 1.959 | 160.286 | 335.603.543 | 97.093.345 | 149.925.283 | |||
| REHABILITATE, YEAR 50 | 1.959 | 160.286 | 157.999.235 | 53 | 46.743.719 | 52 | 82.410.581 | 45 |
CONCLUSION
The thermal envelop of a building is one of the main elements that can be modified in order to optimize energy savings, CO2e emissions, and economic efficiency, in order to offer comfort to its inhabitants. Thermal losses through the envelop of buildings suppose energy waste, resulting in an increase in CO2e emissions and economic costs, as consumption increases due to thermal systems overuse to compensate loses and, therefore, satisfy users’ needs, and contributing to the sustainability of the city and the planet.
As a conclusion, consequences are pointed out depending on the type of materials used, the type of intervention performed on the building envelop, the type and shape of the building, the construction option, its effectiveness, the different insulation thickness and the global vision of the renovation of the buildings in the neighborhood and the possible consequences for our planet.
The current envelopes of the buildings in Montbau, do not meet the minimum comfort requirements set forth in the current legislation, and to do so, a considerable amount of energy must be used, implying that CO2e emissions will be released into the atmosphere and high economic costs will be caused. The type of buildings consuming the most are the single-family houses –Block UNI14-, followed by duplex buildings -Block A-, linear blocks –Block E-F- and towers –Block Q. Most compact buildings -Blocks Q and E-F- consume the least energy, followed by Block A and Block UNI14.
Analysis and results allow concluding that there is a marked relationship between the amount of a building envelope and a building useful surface in its internal part. The less external surface by a higher internal surface, the less energy loses through the envelope that separates the building from the external environment. Therefore, single-family houses will have the highest energy transfer to the exterior due to a greater proportion of envelope, followed by A-Type buildings, duplex buildings, linear blocks, and towers.
Modifying the glazing and the structures that uphold the buildings, have none or poor impact on the reduction of energy consumption and CO2e emissions. Therefore, it is necessary to act on the openings, since they can be treated individually in single houses or in massive buildings. This study results show improvements in the behavior of buildings when modifications are performed on the openings -between 8 and 16%-, which still proves to be inefficient. The analysis shows that the use of specific insulation materials on the envelope, no matter the type of materials, may produce improvements in the comfort of inhabitants, CO2e emissions, energy consumption and costs in the future. For Barcelona, if the studied insulation materials are used, reductions between 34.9% (7cm insulation thickness for UNI14) and 89% maximum (40 cm insulation thickness for Block E-F) are obtained. It is necessary to find the balance point for the insulation thickness, since if thickness increases, it can result in a decreasing performance and savings with the first centimeters are comparable to the performance obtained by doubling or tripling it.
Studies allow affirming that the type of building impacts on the consumption results for the same insulation thickness used in different buildings. Linear Block E-F works better with a 7cm insulation thickness, improving in 76% in comparison to its initial status; Block A, duplex apartments, shows improvements of up to 56%; Block A improves up to 48%, and UNI14 single-family attached houses improve up to 35%. Differences are caused by the shape of buildings and the quantity of skin in contact with the external environment. Single-family houses are the least efficient since they have a great amount of skin due to the space they occupy.
Both of the constructive solutions proposed fit the targeted buildings and therefore to all the buildings in Montbau. Both proposals –T1 (overlying) and T2 (ventilated facade)- involve similar construction consumption, CO2e emissions, and economic costs. Proposal T2 has a higher construction consumption, but lower CO2e emissions.
Regarding roofs, proposal T1 produces much less CO2e emissions when using gravel than proposal T2. Proposal T2 transforms roofs in a useful space, which is something that deserves attention in an architectonic project. Economic costs are similar, although higher in Proposal T1 than in proposal T2.
Regarding openings, wooden structures are the best option, even if maintenance is necessary every four years. On the other hand, aluminum structures do not require maintenance, although manufacturing costs are higher as well as their energy consumption and CO2e emissions if compared to wooden structures.
Chosen constructive proposals act from the external part of the buildings. Renovating buildings from their external part have various advantages. Costs in terms of displacement of inhabitants are not caused, the useful surface of houses is not affected, waterproofing of buildings is improved, thermal bridges are reduced, and the general image of buildings is improved.
Investment, in terms of energy (kWh) to renovate buildings plus energy use -reduced thanks to building renovation- in comparison to the energy consumed when a building has not been renovated, is balanced within a prudent period of time (between 4 years, as a minimum, and 25 years, as a maximum, for buildings A, E-F, and Q, for both of the solutions proposed) taking into account insulation thickness and structures. Proposals that involve wooden structures are optimized in a shorter term, between 4 and 10 years, due to the energy used in their manufacturing in comparison to aluminum structures. Single-family houses -UNI14- need a longer period of time to be optimized, between 11 years –T1 (overlying) with 7, 10 and 15 cm insulation thickness and wooden structures- and a maximum of 46 years –T2 (ventilated facade) with 40 cm insulation thickness and aluminum structures.
The reduction of greenhouse gases emissions (kg of CO2e) runs a process parallel to the energy consumption process. Renovation investment costs in addition to use, in comparison to emissions by similar buildings that are not renovated are optimized between 5 and 30 years as a maximum for buildings A, E-F and Q, using constructive proposals T1 and T2 and the different insulation thickness and wooden structures. If aluminum structures are used, optimization terms vary between 19 and 38 years. Single-family houses need a longer optimization term exceeding 50 years for proposals using aluminum structures. Constructive proposal T1 (overlying) using wooden structures and 7 - 15 cm insulation thickness are optimized between 17 and 22 years depending on thickness.
Three economic scenarios were established, suggesting annual increases in energy prices of 3, 6 and 10%. Said scenarios may flow in several ways, although their trend is to increase. Considering the results of the study, in an increase of 3% scenario, optimization would take place after 50 years; 30 and 40 years if increase is 6%, and between 21 and 30 years if increase is 10%.
The results of the analysis allow concluding that renovation extends the lifespan of buildings and, although benefits are shown in the long-term graphs, energy costs will be one of the most important variables in all the cases.
Efficiency relations between greenhouse gases emissions and the several economic cost scenarios lead us to choose constructive options for each one of the types of buildings analyzed herein, which prove to be the most efficient ones regarding the criteria established in the study. The most efficient proposal for duplex buildings -Block A-, linear blocks -E-F buildings- and towers -Block Q- is T2 (ventilated facade), using wooden structures and 15 cm standard insulation. For UNI14 single-family houses, the most appropriate proposal is T1 (overlying) with wooden structures and 10 cm insulation thickness.
If these constructive proposals are extended to all the buildings in Montbau, and supposing an increase in energy costs of 6%, energy consumption will decrease in 41% after 25 years, CO2e emissions will decrease in 36%, and there will be a deficit of 49% in economic costs. After 50 years, consumption decreases to 53%, CO2e emissions decrease up to 52%, and economic costs decrease in 45%.
The data above confirms that intervening the current envelop of the buildings in Montbau produce energy, environmental, and economic benefits. Renovating the skin of the existing buildings may be a major factor since energy consumption is decreased, CO2e emissions also decrease, and comfort increases and contributes to the economic and environmental equilibrium and regeneration of the planet.
Analysis allow concluding that there is a need to renovate the facades of the buildings in order to contribute to the sustainability of the environment and face the crisis of our planet with medium-term and long-term solutions. The analysis of the graphs allows evaluating important figures, in terms of CO2e emissions released into the atmosphere produced by non-renovated buildings, energy consumption and costs. Figures show energy savings of up to 50% and reduction of CO2e emissions released into the atmosphere by using the constructive solutions and insulation thickness proposed, which were established taking into account their durability, effectiveness, and environmental management.
Also, recovering these buildings will allow the recovery of other spaces, rebuild social fabrics, and offer fair and balanced habitability conditions for an optimal social development.
CONFLICT OF INTEREST
The authors confirm that this article content has no conflict of interest.
ACKNOWLEDGEMENTS
We thank our families, with all our heart, their patience and understanding during the development of this work.

