All published articles of this journal are available on ScienceDirect.
Composite Timber Panel Optimization for a New-type Cold-Formed Steel Shear Wall
Abstract
Background and Methods:
This paper illustrates a research on the behavior of the composite timber panels used in a new-type cold-formed steel shear wall, when subjected to monotonic and reversed cyclic in-plane loading. The framing members of this new-type cold-formed steel shear wall are made of cold-formed steels. The inner timber frameworks, sheathed with veneer plywood, form the composite timber panels.
Objective:
In order to improve the lateral performance of the new-type cold-formed steel shear wall, two different optimized composite timber panels were proposed and tested, namely, increasing the thickness of the sheathings and the addition of steel X-bracings. The main objective of the study is to determine the quantification of the improvement in lateral performance of these two optimized composite timber panels.
Results and Conclusion:
Observed failure modes, structural performance parameters and the data of the strain gauges were given for each specimen, which indicates two optimized panels both have better lateral performance. But larger deformation and damage of the sheathings happened on the panels with steel X-bracings, so the panels with thick sheathings are more suitable and practical for normal use.
1. INTRODUCTION
The cold-formed steel wall panel systems have become increasingly widely used in low-rise residential and commercial buildings, acting as an alternative to the conventional masonry and concrete buildings. The seismic capacity of cold-formed steel wall panel systems is better because of their lighter weight, making them more suitable for earthquake-prone areas. Since their components can be prefabricated in the factory, they can be handled and constructed at the construction site more easily. Other advantages, such as recyclability and energy conservation, also contribute to their use and output worldwide [1, 2].
The most common form of Cold-Formed Steel Shear Wall (CFSSW) is “Cold-Formed Steel (CFS) framing sheathed on one side or both sides” form, namely, a CFS framing is set up and different sheathings are applied to one side or both sides of the CFS framing members. Over the past years, researches on CFSSWs have focused on their axial load bearing capacity [3-5] and lateral performance [6-9]. Tian [3] and Vieira Jr [4] reported that axial load bearing capacity of CFS studs could be improved because of the existence of sheathing materials, and it was affected by the type of the board used. Tian [5] presented an analytical model to predict the axial failure load of CFS studs with sheathing materials, finding out the influence of the screw spacing, the stud spacing and the characteristics (thickness, Poisson ratio, elastic modulus) of the sheathing materials. As illustrated by Nithyadharan [6], the screw shear strength could be used to calculate the wall panel strength, and the calculated strength was close to the values obtained from the experiments. Pan [7] and Ye [8] also found out that the failure of sheathing-to-frame connections was the main reason to cause the degeneration of the in-plane behavior of a CFSSW. Seim [9] concluded that it was not the mechanical properties of the sheathings, but the strength of sheathing-to-frame connections that determines the in-plane lateral performance of CFSSW.
It can be concluded that the lateral performance of a CFSSW is mainly determined by the sheathing-to-frame connections, and the strength of the CFSSW decreases as long as the connections fail. This characteristic means that the mechanical properties of the sheathings cannot be sufficiently taken into account in the structural analysis. To deal with this shortcoming, a new form of CFSSW was proposed and has been studied [10] this paper is based on that work. The new-type CFSSW includes framing members formed by CFS; composite timber panels (CTP) formed by timber beams and sheathings. The previous study showed that the lateral performance of the new-type CFSSW was determined by the lateral performance of the CTPs, because the failure was largely due to the failure of CTPs [10].Thus, it can make full use of the strength of CTPs. In addition, the new-type CFSSW is labor-saving and more convenient to construct, as the connection between CTPs and CFS framing is easy and convenient, that is, directly placing the CTPs into the channels of the steel studs.
According to the previous study, it is proved that improving the lateral performance of the CTPs is an effective way to improve the lateral performance of the new-type CFSSW [10]. Influence of the existence of steel X-bracing [11] and the thickness of sheathings [9, 12] in CFSSWs have also been widely studied. These studies indicated that adding steel X-bracing and increasing the thickness of sheathings can both increase the lateral performance of CFSSWs. Therefore, in order to improve the lateral performance of the new-type CFSSW, two methods to optimize the CTPs were employed, including adding steel X-bracings and increasing the thickness of sheathing material. One original CTP and two optimized CTPs were tested under monotonic and reversed cyclic loading. In this paper, shear capacity, deformability, failure characteristics and energy dissipation of each specimen are presented. Results indicate the quantification of the improvement in lateral performance of these two optimized CTPs.
2. PREVIOUS STUDY
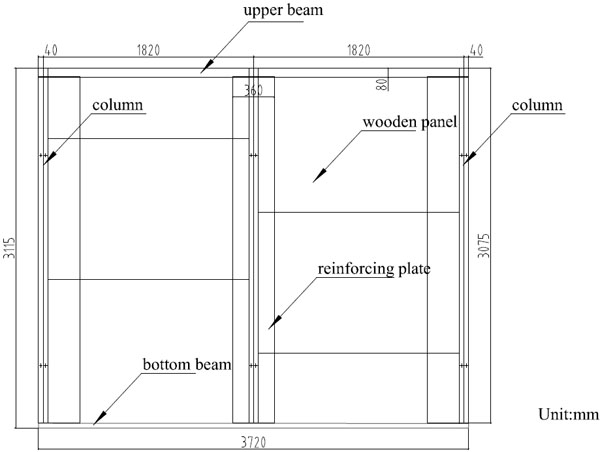
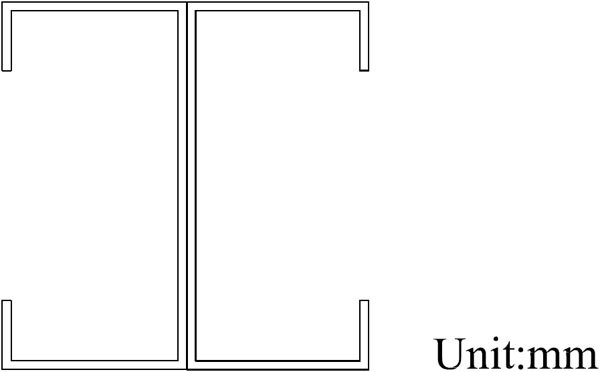
This paper is based on a new-type CFSSW, which was proposed and has been studied in our previous study [10]. As shown in Fig. (1), the full-scale new-type CFSSW is composed of three steel studs, one steel upper beam, one steel bottom beam, three timber reinforcing plates and six CTPs. Three steel studs are formed by welding two C-section CFSs back-to-back, as shown in Fig. (2). The steel upper beam and the steel bottom beam are both single C-section CFSs. The steel studs, the steel upper beam and the steel bottom beam are connected to each other by screws. The inner timber frameworks (composed of longitudinal timber beams and lateral timber beams), sheathed with veneer plywood, form the CTPs. CTPs are directly inserted into the CFS framing from the top to the bottom through the channels of the steel studs. The timber reinforcing plates are attached between the panels to reinforce their connection.
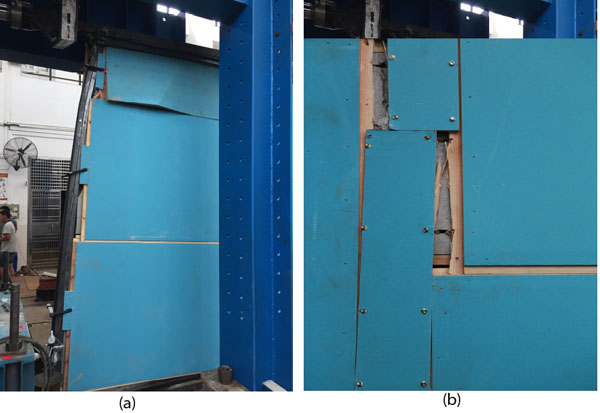
One full-scale new-type CFSSW was tested under monotonic loading. According to the experimental results, the most severe failure occurred in the CTPs, namely, bending and fracture in the sheathings of CTPs and cracks in the inside longitudinal timber beams (as shown in Figs. 3a and 3b). The failures in the CTPs would result in the failure of the entire specimen.
The values of strain gauges, which were attached on the sheathings of CTPs, changed irregularly during the loading procedure. Particularly, there were many sudden changes on the strain-time curves in the vertical direction. Therefore, it can be indicated that the longitudinal timber beams of CTPs had cracked on the early stage.
As is shown above, the main reasons for the failure of the entire shear wall were the failures of the CTPs, particularly the small ones. Aiming to increase the lateral performance of the CFSSW, a study on how to strengthen the CTPs was carried out, and then two optimized forms were put forward. The following studies focus on the CTPs and perform a series of experiments.
3. MATERIALS AND METHODS
3.1. Test Specimens
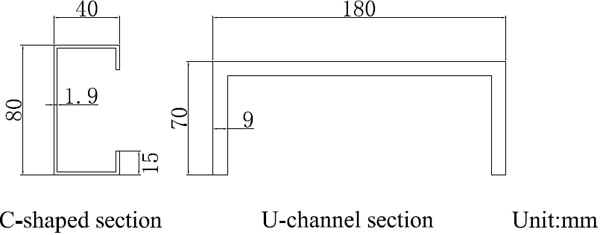
As shown in Fig. (4), the stud used for assembling the CFS framing is thin-walled cold-formed steel of 80 mm×40 mm × 630 mm × 1.9 mm (web depth × flange size × length × thickness) C-shaped section. The U-channel section hot-rolled steels with cross-sectional dimension 180 mm × 70 mm × 9 mm (web depth × flange size × thickness) are used as the steel upper beam and the steel bottom beam. The length of the steel upper beam is 2300 mm and the length of the steel bottom beam is 2600 mm. Material properties of steels are nominal values given by suppliers, as shown in (Table 1).
| Compressive Strength/MPa | Tensile Strength/MPa | Elastic Modulus/GPa | Density/kg-m-3 | Yield Strength/MPa | |
|---|---|---|---|---|---|
| Timber | 35.95 | 61.96 | 4.8 | 526 | – |
| Steel | – | – | 206 | 7850 | 235 |
The experimental studies were carried out on six CTPs with rectangular shape of 1800 mm wide and 625 mm high. The inner timber frameworks of the CTPs are composed of lateral timber beams and longitudinal timber beams, which were connected with each other by screws. To determine the material properties of the timber, compressive strength tests, tensile strength tests and moisture tests in parallel-to-grain direction were carried out according to the ASTM [13]. Material properties of the timber, which have been adjusted to the characteristic values at 15% moisture content according to ASTM [14], are shown in (Table 1).
Sheathing materials made of veneer plywood are attached to both faces of the inner timber framework. Sheathings 2 are connected in advance in factory using white latex and screws, while Sheathings1 are only connected using screws in laboratory as the strain gauges should be attached to the inner timber framework before connecting the sheathings to the panel. Each lateral timber beam is stretched out of the panel in two sides to be inserted into the channels of the C-section steel studs. Also, the upper and lower lateral timber beams are stretching out and pinching in, respectively, so that each panel can match each other when inserted into the steel studs.
Three types of CTPs (Type-A, Type-B and Type-C) are considered in the experimental study. Type-B and Type-C are the modified type from Type-A. Type-B thickens the sheathings from 5 mm to 9 mm, while Type-C changes the timber beams arrangement and the steel X-bracings are added. Details of the CTPs and the differences between three specimens are shown in (Fig. 5), (Tables 2 and 3).
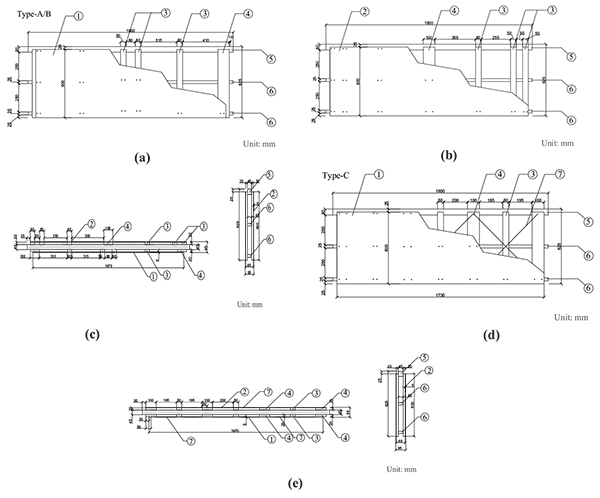
| Code | Name | Size(mm) | Quantity |
|---|---|---|---|
 |
Sheathing1 | 1670*600*5(9) | 3 |
 |
Sheathing2 | 1730*600*5(9) | 3 |
 |
Longitudinal timber beam | 20*50*600 | 52 |
 |
Longitudinal timber beam | 20*100*600 | 28 |
 |
Lateral timber beam | 45*50*1800 | 6 |
 |
Lateral timber beam | 45*25*1800 | 12 |
 |
Steel X-bracing | – | 12 |
| Specimen | Difference | Quantity |
|---|---|---|
| Type-A | 5 mm Sheathings | 2 |
| Type-B | 9 mm Sheathings | 2 |
| Type-C | With steel X-bracings | 2 |
3.2. Test Setup
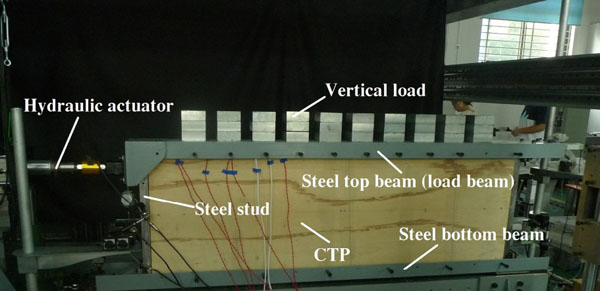
Details of the setup used for tests are given in Fig. (6). Steel studs, steel top beam (load beam), and steel bottom beam are made of CFSs. All of the steel was connected by bolts (M3.5) except angle iron which was welded on the top and the bottom of the steel studs. The CFS framing (except the load beam) was firstly assembled on the steel bottom beam, and then the CTP was inserted along the steel tracks formed by the steel studs on both sides. Finally the steel top beam was assembled upon the CFS framing. The loading system of the experiment consisted of 5-ton hydraulic actuator and mass blocks. The hydraulic actuator could exert both monotonic loading and reversed cyclic loading and it was connected with one side of the steel top beam by bolts. In the full-scale test, this CTP was subjected to the weight of two upper CTPs. To simulate this condition, thirty blocks, weighing 960 N in total, were applied to the test as vertical load, which was equal to the weight of two CTPs; it remained constant throughout the entire tests. To prevent the out-of-plane displacement during the loading process, bolts were applied to the steel top beam and steel bottom beam. Therefore, the specimen was placed vertically during the test.
3.3. Instruments
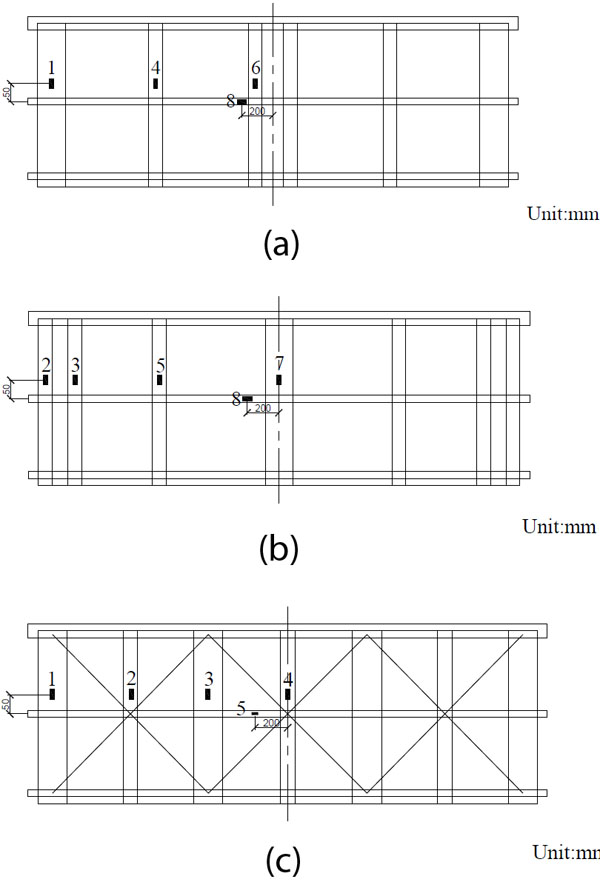
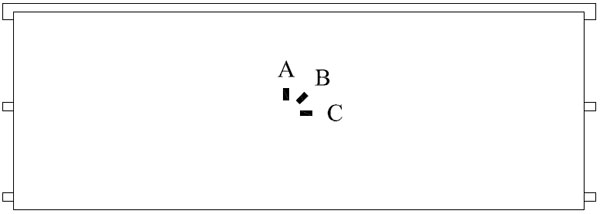
The actual shear displacement of the whole specimen was measured and recorded by a series of LVDT transducers. All the LVDT transducers are in ± 25 mm range and 1 mm least count. Fig. (7) shows the details of position where the transducers are located. D1 was applied to measure the lateral displacement of the steel top beam (load beam); D2 was applied to measure the lateral displacement of the specimen on top; D3 and D4 were applied to measure the vertical displacement of the specimen relative to the steel bottom beam; D5 and D6 were applied to measure the horizontal slip of the specimen relative to the steel bottom beam; D7 and D8 were applied to measure the vertical displacement of the steel bottom beam relative to the foundation. In order to measure the strain of the inner timber framework and sheathings, strain gauges were bonded to some typical locations. As shown in Fig. (8), No.1 to No.7 for Type-A and Type-B (No.1 to No. 4 for Type-C) were the strain gauges on the longitudinal timber beams, while No.8 was for Type-A and Type-B (No.5 for Type-C), which were the strain gauges on the lateral timber beams. All strain gauges in timber beams were located near the mid-point of the beams, where maximum strain was expected to occur. However, to avoid the influence of the screws at the mid-point, all strain gauges were offset 50mm and 200mm on the longitudinal timber beams and lateral timber beams, respectively. In order to compare strain on lateral timber beams and sheathings, strain gauges were located near the middle of the sheathings with white latex shown in Fig. (9), namely, the same position as strain gauges on lateral timber beams.

3.4. Test Procedure
The specimens were tested under monotonic and reversed cyclic loading under vertical load of 960 N. In the monotonic loading tests, the load method was displacement control, with the unidirectional in-plane displacement at the top of the specimen increasing at the rate of 0.03 mm/s. The in-plane displacement increased until the in-plane shear load reached a peak and fell to below 80% of the maximum value. In the reversed cyclic loading tests, the load method was displacement control. Firstly, bi-directional in-plane displacement increased at the rate of ±0.05 mm/s, reaching ±10 mm, ±20 mm and ±30 mm (positive values represented pulling, and negative values represented pushing). Following this, the displacement increased at the speed of +0.1 mm/s until the in-plane shear loading reached a peak and fell to below 80% of the maximum value.
In the actual debugging process, because of installation errors and other reasons, the actuator’s displacement and D1’s displacement did not change synchronously. So in the actual loading process, we pre-loaded for a period of time until D1 began to collect data.
4. RESULTS AND DISCUSSIONS
4.1. Failure Types of Specimens
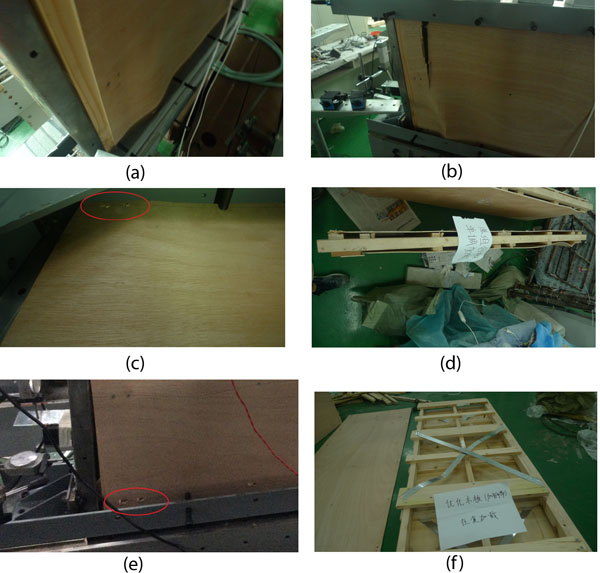
In monotonic and reversed cyclic tests, six different types of failure modes were observed (each failure type is shown in Fig. (10 a, b, c, d, e and f)). In the initial stage, the sheathing materials bended gradually with the applied force increasing. As for Type-C, the bending of steel X-bracings could also be observed at this stage. Then, the relative movement between sheathings and timber framework increased gradually, making the slippage of screws happen. The slippage of screws caused large shear stress and bearing stress in longitudinal timber beams and sheathings, leading to cracks in longitudinal timber beams and bearing failure in sheathings. Finally, the sheathing materials fractured when the sheathings bended at a large scale.
- Bending of sheathings. Initially, the sheathings were smooth, but with the development of time, it became wavy. The bending occurred mostly in the upper corner of the sheathings close to the applied load, and the lower corner of the other end of the sheathings. The deformation was largely caused by the relative movement of the sheathings and the inner timber framework. This failure was observed in all specimens, but less obvious in Type-B.
- Fracture of sheathings. With the increment of displacement and applied load, sheathings fractured in the curving area. The width of the cracks developed as the experiment progressed. The location of the cracks was not in the middle area of the panel, but at the corner of the panel. Similarly, this failure was found in all specimens, but less obvious in Type-B.
- Slippage of screws. The screws slippage was observed in all specimens and mainly occurred in the upper and lower part of the sheathings. Because of the relative movement of the sheathings and the inner timber framework, the displacement of the upper part was smaller than the inner timber framework, while the displacement of the lower part was larger than the inner timber framework. Therefore, as can be seen in Fig. (10) (c), the screws in the upper part tilted towards the applied load, while the screws in the lower part tilted towards the opposite direction.
- Cracks in longitudinal timber beams. The sheathings were attached to the inner timber framework by screws. When external forces were applied to the specimens, longitudinal timber beams were subjected to strong shear stress caused by screws, which led to the cracks. It was observed in the top and bottom area with screws penetrated in.
- Bearing failure of sheathings. The external forces were transferred between the inner timber framework and the sheathings through screws. Stress concentration phenomenon and bearing stress between the screws and sheathings occurred in the screw holes, which caused the bearing failure of the sheathings. This failure was obvious in the surrounding area of the screws in all the specimens.
- Bending of steel X-bracings. Steel X-bracings in Type-C bended for two main reasons. Firstly, the bending of the sheathings pushed the steel X-bracings and made them to bend. Secondly, steel X-bracings were subjected to compressive stress, which made them to bend.
4.2. Load and Displacement Diagram
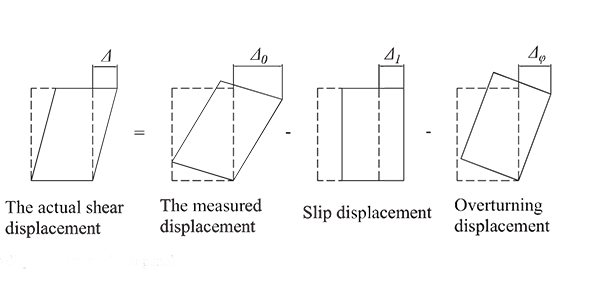
The actual shear displacements Δ consisted of slip displacement, overturning displacement and actual shear displacement [8]. The expression is summarized in the following equations:
 |
(1) |
 |
(2) |
 |
(3) |
 |
(4) |
 |
(5) |
 |
(6) |
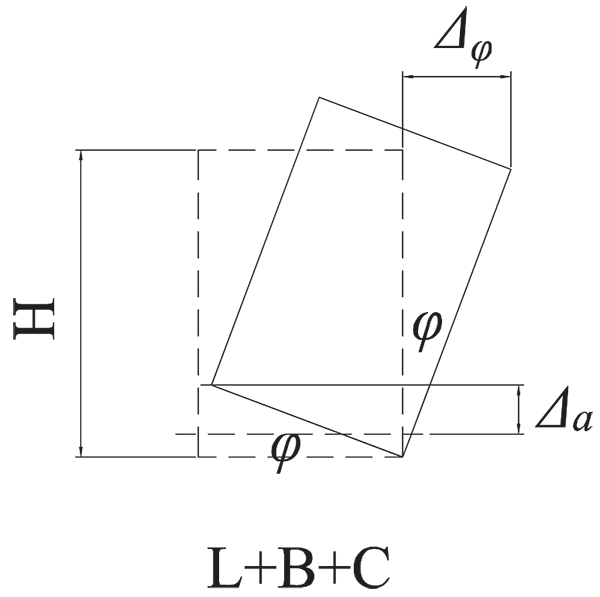
d1 to d8 are readings of the LVDT transducers D1 to D8, respectively. Δ is the actual shear displacement of the panel, as illustrated in Fig. (11). Δ0 is the measured displacement of the panel on top.Δ1 is the slip displacement of the panel relative to the foundation. Δφ is the overturning displacement, as illustrated in Fig. (12). H is the panel height. A is the distance between D1 and D2. L is the panel length. B and C are the horizontal distances between LVDT transducers D3, D4 and the specimen edges, respectively.
4.2.1. Behavior Under Monotonic Loading
Fig. (13) shows the lateral in-plane shear load (P) versus the net in-plane displacement (Δ) of all specimens. The general observations from the P-Δ curves of all specimens are:
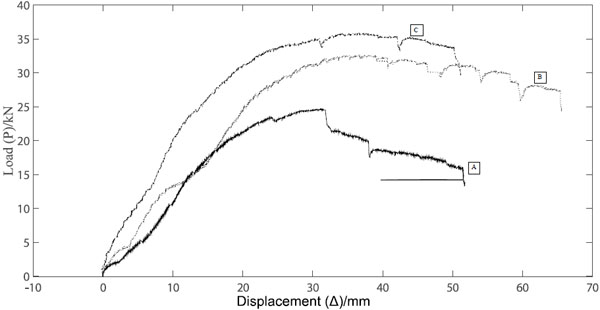
- During the initial period of loading, all the specimens were in the elastic state, and the curves were nearly linear. During this period, the stiffness was determined by the elastic deformation of the CFS framing, timber beams and the sheathings.
- With the development of the loading, non-linearity set in due to failures of the specimens
- When the load reached 23 kN, Type-A reached the ultimate state, and the curve reached the peak. The loads of two optimized panels increased continuously until the loads reached approximately 32 kN for Type-B and 35 kN for Type-C.
- After the load reached the maximum value, the displacement increased while the corresponding load decreased, indicating good ductility.
- The ultimate strength for Type-B and Type-C was similar, but the displacement corresponding to the same load for Type-B was more than that for Type-C. Displacements corresponding to the same load for Type-B and Type-C were much smaller than that of Type-A, showing that two optimized panels had more stiffness.
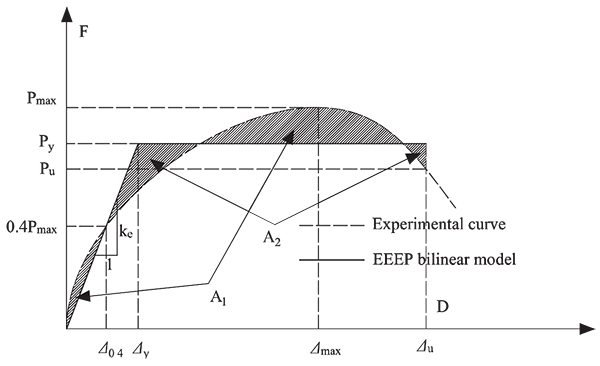
In the computation of the structural performance parameters, equivalent energy elastic-plastic (EEEP) bi-linear model in the AISI standard [15], as shown in Fig. (14), is employed. The structural performance parameters of the EEEP model for all specimens are presented in Table 4. Dissipated energy (E) represents the amount of energy consumed by a specimen until failure, which is the area under P-Δ curve for monotonic tests. Elastic shear stiffness (Ke) is defined as a slope measured by the ratio of the resisted shear load to the corresponding displacement, indicating the resistance to deformation of a specimen in the elastic state [15]. The shear capacity is defined as the ultimate strength per unit length [16]. The fundamental definition of ductility ratio is the ratio of ultimate displacement and the yield displacement [9], as follows:
 |
The following observations are based on the results in Table 4:
- The shear capacity of the panel with thick sheathings (Type-B) and with steel X-bracings (Type-C) was 37.4% and 50.2% more than that of the original panel, respectively. It shows that two optimized panels have better mechanic properties than the original one. Type-C had the highest yield strength, while Type-A had the lowest values. Compared with Type-A, the increase in yield strength for Type-B and Type-C was 34.8% and 48.5%, respectively.
- In the yield state, Type-C had the lowest displacement but subjected to the highest loading, indicating that Type-C had the highest stiffness, which can also be observed from the parameter Ke (2.7 kN·mm-1).
- The ductility ratios for Type-B and Type-C were 71.4% and 81.3% higher, respectively, compared to that of Type-A. Specimens with steel X-bracings (Type-C) had the highest ductility ratio, because when steel X-bracings yield, they can increase the panels’ ductility.
- The difference between the total energy dissipated in Type-B and Type-C was margin (1.0%). The absorbed energy in Type-B and Type-C was 95.6% and 97.5% higher, respectively, than that of Type-A.
| Specimen | Yield State | Ultimate State | Failure State |
Ductility Ratio μ=Δu /Δy |
Dissipated Energy E/J |
Ke /kN·mm-1 |
Shear Capacity /kN·m-1 |
|||
|---|---|---|---|---|---|---|---|---|---|---|
|
Py /kN |
Δy /mm |
Pmax /kN |
Δmax /mm |
Pu /kN |
Δu /mm |
|||||
| Type-A | 22.27 | 19.28 | 23.60 | 23.97 | 18.88 | 37.02 | 1.92 | 609.75 | 1.16 | 13.11 |
| Type-B | 30.02 | 14.22 | 32.42 | 25.52 | 25.93 | 46.83 | 3.29 | 1192.39 | 2.11 | 18.01 |
| Type-C | 33.06 | 12.21 | 35.44 | 32.42 | 28.36 | 42.53 | 3.48 | 1204.21 | 2.70 | 19.69 |
4.2.2. Behavior Under Reversed Cyclic Loading
Test specimens were subjected to three fully reversed cyclic displacements, each at the amplitudes of 10 mm, 20 mm and 30 mm. Fig. (15) shows the load-displacement (P-Δ) hysteretic and cyclic loading envelope curves of all specimens, along with the monotonic P-Δ curves. The general observations based on Fig. (15) are as follow:
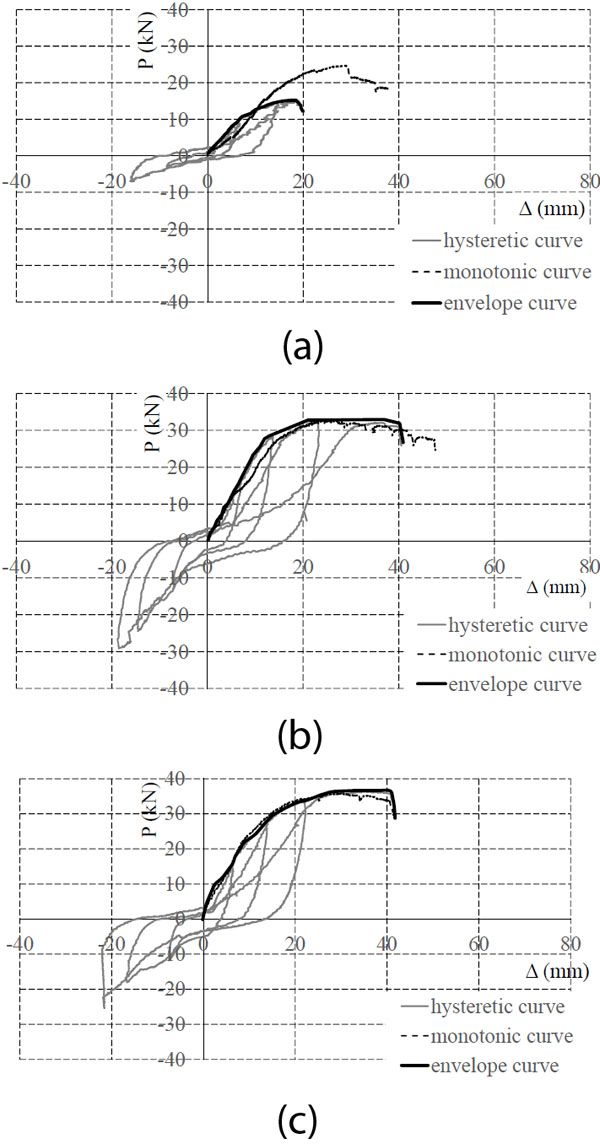
- •Type-A could only finish two fully reversed cyclic displacements and failed at the third cycle, showing a worse seismic behavior compared with two optimized panels.
- •Sizable pinching was observed in the hysteretic curve of Type-A, but it was less obvious in the hysteretic curves of other specimens. It indicates that the ability of energy absorption was better in two optimized panels.
- •The cyclic loading envelope curves of Type-A were much lower than the monotonic P-Δ curve, and the ultimate strength and ultimate displacement under cyclic loading were largely lower than the corresponding value in monotonic test. It shows that considerable strength degradation took place in Type-A under cyclic loading.
- •The cyclic loading envelope curves of Type-B and Type-C were similar to the corresponding monotonic P-Δ curve, with similar ultimate strength. Stiffness and strength degradation in two optimized panels were not obvious, indicating a better seismic behavior.
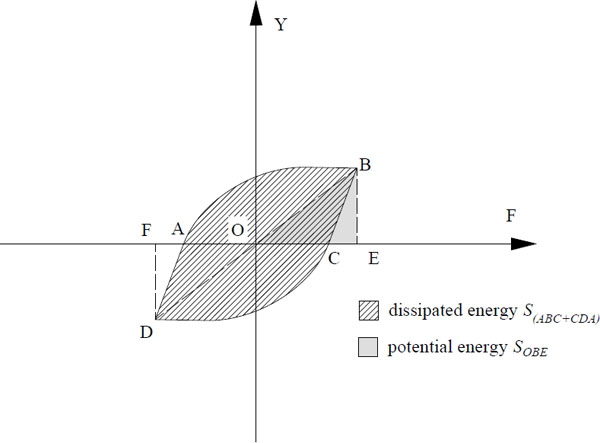
Structural performance parameters under cyclic loading are also calculated based on EEEP model, and the results are given in Table 5. Chopra [17] suggested that equivalent viscous damping ratio (υeq) could be used to evaluate the property of the energy dissipation,
 |
where S(ABC + CDA) is the area of the cycle with the maximum displacement amplitude and S(OBE) is the area of the triangle, as shown in Fig. (16). After comparing the values shown in Table 5, the following observations are given:
- Type-C had the highest ultimate strength and yield strength, while Type-A had the lowest values, which is the same as the condition in monotonic tests. The shear capacities of Type-B and Type-C were 117.0% and 144.7% more than that of the original panel, respectively. Compared with the values in monotonic tests, two optimized panels had similar shear capacity in two loading modes, while the shear capacity of the original panel was 54.6% lower in the cyclic tests. It indicates that under cyclic loading, considerable strength degradation occurred in Type-A, but it wasnot obvious in Type-B and Type-C.
- The ductility ratio of Type-C was the highest in three specimens (13.7% and 67.6% higher than Type-B and Type-A respectively), even higher than the data in monotonic loading, which indicates that steel X-bracings increased the ductility of the panel under cyclic loading. As for Type-A and Type-B, the difference between the ductility ratios under monotonic tests and cyclic tests was small.
- The equivalent viscous damping ratio ranged from 0.13 to 0.14. The values of Type-B and Type-C were nearly the same and they both 8% were higher, compared to that of Type-A. It shows that thick sheathings and steel X-bracings can increase the property of the energy dissipation.
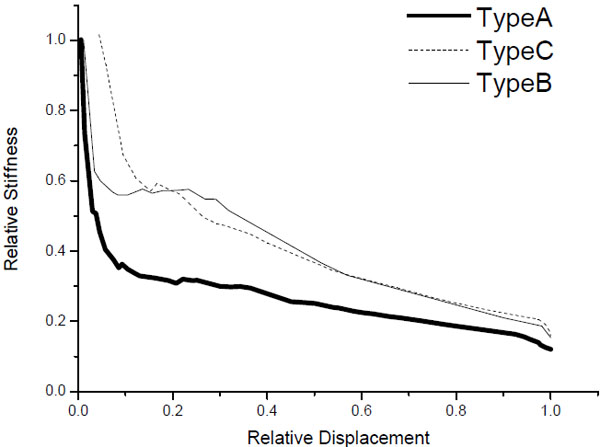
- Stiffness degradation is often used to evaluate the seismic performance of composite wallboard members [18], as shown in Fig. (17). Relative stiffness is defined as the ratio of equivalent stiffness to initial stiffness. Equivalent stiffness is the slope of the line connecting a point on the envelope curve and the origin, while initial stiffness is the lateral stiffness in the elastic stage. The ratio of the displacement of a point on the envelope to the failure displacement (Δu) is defined as relative displacement. As can be seen from Fig. (17), the overall tendency of stiffness change of all specimens is similar, that is, it reduced sharply during the initial stage and then reduced gradually until failure. In the initial stage, the decrease of stiffness of Type-B and Type-C was both near 40%, while that of Type-A, it was near 60%. In the failure stage, equivalent stiffness of all specimens reduced to only 20% of the initial stiffness. The overall trends of stiffness degradation for Type-A was much more significant than Type-B and Type-C, indicating that adding steel X-bracings and increasing the thickness of sheathing materials can increase the seismic performance.
| Specimen | Yield State | Ultimate State | Failure State |
Ductility Ratio μ=Δu /Δy |
Equivalent Viscous Damping Ratio υeq |
Ke /kN·mm-1 |
Shear Capacity /kN·m-1 |
|||
|---|---|---|---|---|---|---|---|---|---|---|
|
Py /kN |
Δy /mm |
Pmax /kN |
Δmax /mm |
Pu /kN |
Δu /mm |
|||||
| Type-A | 14.01 | 9.46 | 15.27 | 17.42 | 12.21 | 20.15 | 2.13 | 0.13 | 1.48 | 8.48 |
| Type-B | 31.81 | 13.03 | 33.12 | 20.07 | 26.49 | 40.92 | 3.14 | 0.14 | 2.44 | 18.4 |
| Type-C | 33.37 | 11.79 | 37.35 | 36.09 | 29.88 | 42.12 | 3.57 | 0.14 | 2.83 | 20.75 |
4.3. Analysis of Strain Gauges
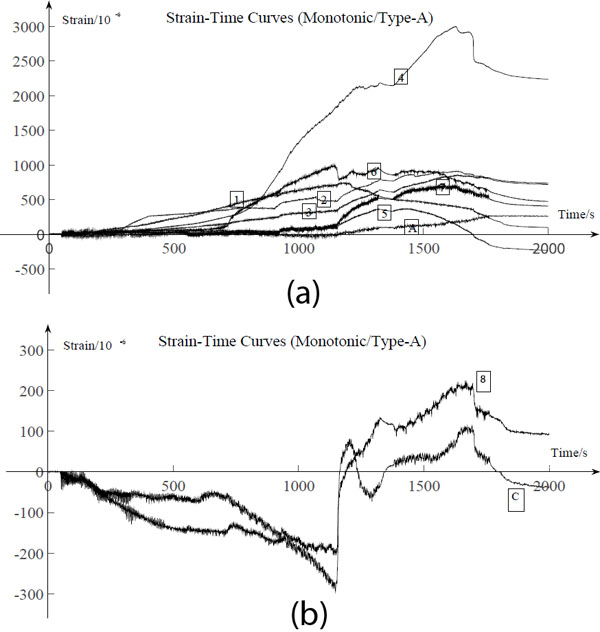
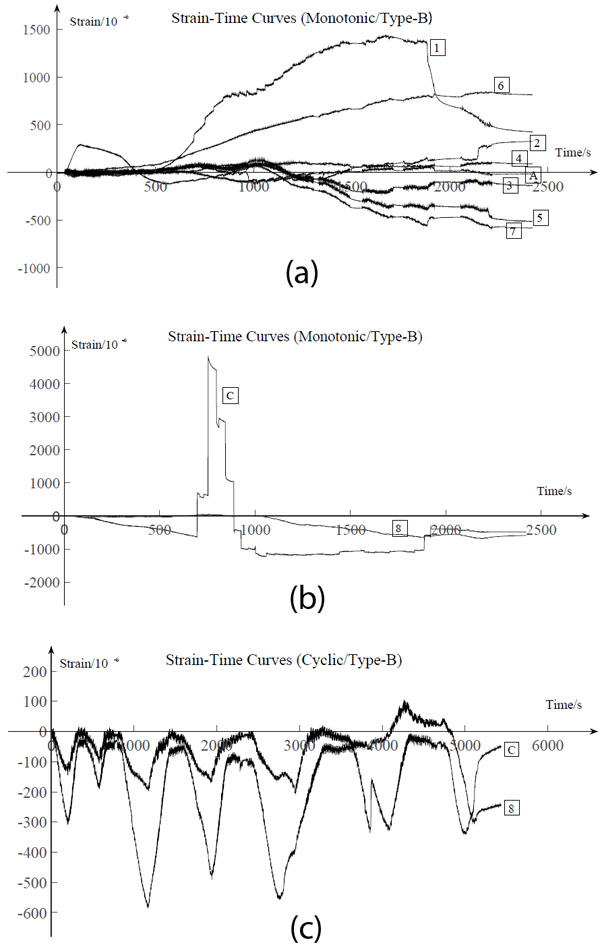
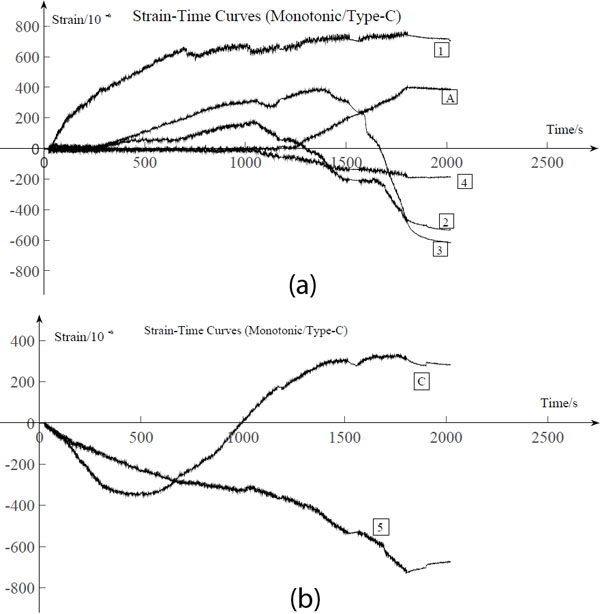
Figs. (18 to 20) show the strain-time curves of the timber beams and the sheathings at selected location on all specimens. They show some general phenomena and the function of steel X-bracings and the thick sheathings.
As can be seen from Figs. (18a and 19a), the strain of longitudinal timber beams are smaller on the side without white latex than the other side, for the loadings cannot be transferred to the timber beams efficiently from the sheathings on this side. It leads to a conclusion that white latex used to connect the sheathings and the inner timber framework makes a great contribution to the integrity. Also, the strains of the longitudinal timber beams vary when the position changes and have higher values on the edges of the panel. Figs. (18b and 19b), shows some sudden changes in the strain, which were mainly due to the cracking in the longitudinal timber beams and the fracture of the sheathings.
The effect of the steel X-bracings increased the integrity and to bear the load. It can be seen from Fig. (20a) that strains of longitudinal timber beams in Type-C were smaller, compared to those in other two specimens. Fig. (20b) also shows that the bending of the steel X-bracings may influence the deformation of the sheathings, whose strain changes from compression to tension because of the extrusion of the steel X-bracings.
Furthermore, the thick sheathings can increase not only the integrity, but also the stiffness of the panel. As can be seen in Figs. (19b and c), the development tendencies of the strain on the lateral timber beams and the sheathings were similar.
CONCLUSION
This paper presents the results and details of a research on the behavior of the CTPs used in a new-type form of CFSSW. As shown above, two groups of specimens were studied and tested and each group contained one original panel, one panel with thick sheathings and one panel with steel X-bracings. One group was tested under monotonic loading, while the other group was tested under reversed cyclic loading. Based on the experimental results, it was observed that:
- The sequence of main failures is as follow: the bending of sheathings (the bending of steel X-bracings in type-C), the slippage of screws (leading to the cracks in longitudinal timber beams and the bearing failure of sheathings), followed by the fracture of sheathings.
- Comparing the failure modes among three kinds of panels, the panel with the thicker sheathings had a lower degree of damage. Moreover, the other two panels were damaged seriously as many cracks occurred on the sheathings.
- Under the monotonic tests, the shear capacity of Type-B and Type-C were 37.4% and 50.2%, respectively, more than that of the original panel. The ultimate strength for Type-B and Type-C was similar, but the displacement corresponding to the same load for Type-B was more than that for Type-C. The total energy dissipated by Type-B and Type-C was both around twice as much as the total energy dissipated by Type-A.
- In the reversed cyclic tests, the increase in the shear capacity of Type-B and Type-C was 117.0% and 144.7%, respectively, compared with Type-A. Compared to the condition in the monotonic tests, considerable strength degradation occurred in Type-A, but it was less obvious in Type-B and Type-C. The equivalent viscous damping ratio of two optimized panels both increased to 8%, indicating a better ability to absorb energy.
- In the monotonic tests, the ductility ratio of the panel with steel X-bracings showed the highest value (3.48), while the corresponding values of Type-A and Type-B were 1.92 and 3.29, respectively. In the reversed cyclic tests, the ductility ratio of the panel with steel X-bracings had the highest value (3.57), while the corresponding values of Type-A and Type-B were 2.13 and 3.14, respectively. The value of ductility coefficient μ_code of components was commonly designed as 3.00 [19]. The increased coefficient (Qi=μ_eff/μ_code) was adopted from a study [20], where μ_eff is the ductility ratio we measured. Thus, Type-B (Qmonotonic =1.10 and Qcyclic=1.05) and Type-C (Qmonotonic =1.16 and Qcyclic=1.19) were available in the seismic design of composite shear wall system.
- Based on the strain of the timber beams and the sheathings, white latex is necessary in the process of connecting the longitudinal timber beams and the sheathings. Though steel X-bracings can increase the integrity and lateral performance of panels, the bending of steel X-bracings may increase the deformation of the sheathings. Therefore, steel X-bracings’ influence must be considered sufficiently when using them. Moreover, the thick sheathings can prevent the large deformation when the panels were under loading.
Test results show that under monotonic and reversed cyclic loading, the mechanic properties of two optimized panels are better than the original one, with shear capacity, ductility, stiffness and the ability to absorb energy improving significantly. However, larger deformation and damage of the sheathings happened on the panels with steel X-bracings, so the panels with thick sheathings are more suitable and practical for normal use.
CONSENT FOR PUBLICATION
Not applicable.
CONFLICT OF INTEREST
The authors declare no conflict of interest, financial or otherwise.
Funded by National Undergraduate Innovation and Entrepreneurship Training Program, and Open-end Fund for Innovative Research of Civil Engineering Undergraduates from Dalian University of Technology.
ACKNOWLEDGEMENTS
This study was supported by the experimental platform of structural mechanic in the Dalian University of Technology.

