All published articles of this journal are available on ScienceDirect.

Multi-Scale Analysis of In-plane Behaviour of Tuff Masonry
Abstract
Various methodologies are available today in engineering professional practice to analyse structures, in particular in the field of masonry structures. Many of the methods are derived from reinforced concrete frames but sometimes they suffer of lack of comprehensive experimental validation due to difficulties to simulate the many different kinds of masonries and they suffer from lack of critical comparison between them. In fact some methods seem to be able to provide accurate results, but are extremely expensive from a computational point of view and they require detailed material characterization and knowledge of actual geometry of the masonry and its constituents. However the usual uncertainty on the material mechanical properties and geometry details jeopardizes seriously the accuracy of the most refined analyses. Previous works by the authors remarked that nonlinear properties like as fracture energy, crucial for instance in the definition of post peak behaviour and ductility of masonry, have a crucial role at the single panel scale level analysis, while their impact is less and less crucial on the behaviour of entire walls and masonry structures. The aim of the overall work is to compare the most common methods of analysis for masonry from micro-scale to macro-scale, where not only geometrical refinement of the analysis is crucial, but also the number and details of required mechanical parameters. It is seen that macro-models are important to analyse large structures and the computational expense and required knowledge level are usually reasonable. To this scope a simple nonlinear material model for tuff masonry is proposed and results are compared between refined and simple models to simulate a tested real scale wall prototype with an opening.
INTRODUCTION
The aim of this study is to define a methodology (from a multiscale point of view) to calibrate a constitutive relationship for the description of the structural response of masonry buildings subjected to monotonic actions. The calibration of the constitutive relationship was implemented in the computer codes usually adopted in the professional practice. In the specific case the analyses were carried out by means of the software SAP 2000 (v.15) [1]. In particular the focus is on tuff masonry, whose behaviour is different from brick masonry where mortar is usually weaker than brick units.
This objective was pursued through comparison of the numerical results with those obtained from experimental tests conducted on masonry sub-structures subjected to monotonic and cyclic loadings. In this case, the experimental results of a test performed previously on a tuff masonry wall with opening tested in the laboratories of the Department of Structures for Engineering and Architecture at the University of Naples “Federico II” [2] are discussed.
Different numerical models of this wall were developed at different complexity levels: by means of nonlinear shells and assuming an equivalent homogeneous material or by means of equivalent frames with calibrated plastic hinges. The structural models took into account not only the physical and geometrical properties of the structure but also the loads applied during the experimental tests. In order to extend these types of analysis to entire buildings, hence not limited only to sub-structures or components, particular attention was paid to the definition of suitable geometric/mechanical models (coarse discretization of the mesh, simple constitutive relationships, etc.) [3-5]. The calibration of the constitutive relationships was carried out through the development of pushover analyses and comparison of numerical results with those obtained from the experimental tests. Previous works [6-9] remarked that nonlinear properties like as fracture energy, crucial for instance in the definition of post peak behaviour and ductility of masonry, have a crucial role at the single panel scale level analysis, while their impact is less and less crucial on the behaviour of entire walls and masonry structures. The experimental test used for calibration was conducted on a new masonry wall, hence not previously damaged or stressed.
Masonry Modelling
Today two different approaches are commonly used for the seismic analysis of masonry structures: very sophisticated finite element models or extremely simplified methods. Finite element models for masonry structures can be developed following different methods. There are methods that consider masonry as a composite material, focusing on the micro-modelling of each component (units and mortar) or on the macro-modelling of masonry as a composite. The aforementioned strategies refer to different fields of application: micro-models are applicable when the scope of the study is the local behaviour of the masonry, while macro-models are used when a compromise between accuracy and efficiency is required. Anyway, both of these strategies need an exhaustive description of the material (usually done by means of experimental programs on masonry specimens). In the detailed micro-modelling, continuum elements are used to describe units and mortar, while discontinuous elements are used to represent the unit-mortar interfaces. The behaviour of both units and mortar is taken into account and the interface is a plane of potential crack. The aforementioned strategy is the most accurate for describing masonry behaviour, but it requires high computational efforts. Thus, detailed micro-models are usually used only for detailed analysis of local response of small masonry components. In a further simplified micro-modelling, units are “expanded” and they are modelled as continuum elements, while joints and unit-mortar interfaces are concentrated in discontinuous boundary elements. In this way, units are directly bounded by potential fracture planes. Both strategies have been developed to analyse small masonry components accounting for the non-homogeneous state of stress and strain inside them. The macro-modelling approach is the most practice-oriented, due to its lower computational demand. This strategy needs an accurate description of the relationship between average stresses and average strains. Parameters which describe the continuum are evaluated by means of tests on large size masonry elements (i.e. incorporating at least one of each component: unit, mortar and interface) subjected to simple states of stress. Other advantages of macro-modelling include the fact that Finite Element meshes are simpler, since the internal structure of the masonry is not described, and meshes should not reproduce the masonry pattern. Moreover there are no interfaces because homogeneous properties already include them. Macro-models can be used when the purpose of the analysis is the seismic behaviour of old, complex, huge structures (i.e. bridges, cathedrals, historical buildings, etc.)
An anisotropic plasticity model was proposed by [10]. This implementation was (in its first formulation) suitable for modelling anisotropic materials under plane conditions: individual yield criteria were considered for tension and compression, according to different failure mechanisms.
The compression yield criterion (derived from Hill yield surface) was associated to a localized fracture process, while the tensile yield criterion (that refers to Rankine yield surface) was associated to a more distributed fracture process. Another model was proposed by [11] and [12] to model the seismic response of brick masonry. This model takes into account the mechanical behaviour of each component and interfaces (such as decohesion and slippage in mortar joints and failure in bricks). The approach is suitable for the evaluation of the lateral response of in-plane loaded brick masonry shear walls. The proposed continuum model is based on the assumption of an equivalent stratified medium made up of layers representative of the mortar bed joints and of the brick units and head joints, respectively. The constitutive equations are obtained through a homogenization procedure which involves the damage model of mortar joints [11] and simple damage constitutive equations for the brick layer. This approach is used in Finite Element Method (F.E.M.) analyses of the in-plane response of brick masonry shear walls loaded either by cyclic horizontal actions superimposed to vertical loads or by dynamic loads, which are representative of the seismic actions. Validation tests were carried out and experimental results on squat and slender shear walls agreed well with numerical results.
The "micro-model" accuracy in the analysis is not the same as "macro-modelling", however, the representation of the elements in the real structure could be very complicated and the computational cost disproportionate when modelling whole buildings. The parameters that influence the macro-modelling are the size of the mesh and the choice of the constitutive equations, which, if they include softening, becomes size dependant. The model accuracy and computational complexity are dependent on these two parameters. In this paper a compromise between modelling speed and accuracy of analysis results is sought. In particular usual homogenization procedures fall short in the case of tuff masonry where the usual assumption that mortar is weaker than units is not satisfied, while tuff stone tends to be weaker than mortar joints.
RESEARCH SIGNIFICANCE
The aim of this study is to define a multiscale methodology to calibrate constitutive relationships for the analysis of entire masonry buildings subjected to monotonic lateral loads. The constitutive relationship should be able to describe the rocking phenomena, too, which are relevant in some masonry configurations. The focus is the computer codes usually adopted in the professional practice. To this aim the most common methods of analysis for masonry from micro-scale to macro-scale, are compared. Differences are in the number and details of required mechanical parameters and required knowledge levels. Usual uncertainty on the material mechanical properties and geometry details jeopardizes seriously the accuracy of the most refined analyses, while such refined analyses have a disproportionate computational cost in the assessment of wide masonry aggregates or simply large masonry structures.
EXPERIMENTAL PROGRAM
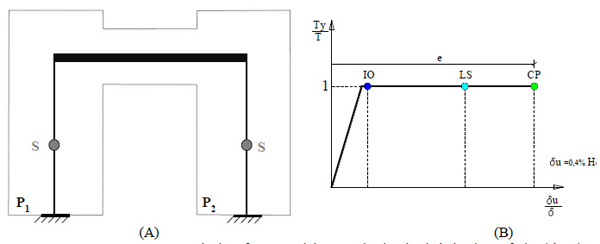
The results of an experimental test conducted on a full-scale masonry wall with opening in yellow tuff have been used to calibrate the constitutive relationships for the numerical model. Details on experiments can be found in [2]; a short summary is provided to recall the basic information and data used in the numerical analyses. The wall is single wythe made of tuff stone blocks and has an opening. It consists of two piers connected by a spandrel panel with a wooden lintel. The wooden lintel has an anchorage length of 15 cm, so it is essentially able to support the self-weight of the spandrel panel without providing any tensile strength to enhance the bending moment capacity of the spandrel. The wall was globally 510 cm long, 362 cm high, and 31 cm thick (see Fig. 1A). To apply gravity forces to the piers, yet ensuring structural continuity with an ideal upper story, three masonry rows were constructed over the piers. Both piers and spandrel panel had a length of 170 cm, whereas the height of the latter was equal to 100 cm. The masonry rows were alternated to get discontinuous vertical mortar joints with a thickness of 10 mm. In the context of a macro element idealization of the wall [13], the pier and spandrel panels had an height to length aspect ratio of 1.35 and 1.7, respectively. Therefore, the intersections between piers and spandrel, namely the joint panels assumed to be rigid and infinitely resistant in simplified seismic analysis methods, were 170 × 100 × 31 cm3 each in size. The masonry was made of yellow tuff bricks (150 × 300 × 100 mm3 in size) and a hydraulic mortar composed of natural sand and pozzolana like reactive powder with a water–sand weight ratio of 1:6:25. Tuff stones were characterized by means of uniaxial compression tests on cubic specimens with edge length of 70 mm, whereas mortar was characterized through similar tests on specimens with 40 × 40 × 160 mm3 dimensions. Ref [14] also estimated mechanical properties of the entire tuff masonry (assumed as a single “equivalent homogeneous material”) through two series of uniaxial compression tests along the directions parallel and orthogonal to the mortar bed joints of prisms (610 × 650 × 150 mm3 in size). The tuff units used for masonry prisms had the same dimensions of those employed for the tested wall and were bonded through pozzolana-like mortar joints with a thickness of 10 mm. The mechanical properties of tuff units, mortar and equivalent homogeneous material are shown in Table 1.
Mechanical properties of tuff masonry.
| Material | Tensile strength ft (MPa) |
Compressive strength fc (MPa) |
Young's modulus E (GPa) |
Shear modulus G (GPa) |
|---|---|---|---|---|
| Yellow tuff units | 0.23 | 4.13 | 1.54 | 0.44 |
| Pozzolana-like mortar | 1.43 | 2.5 | 1.52 | 0.66 |
| Tuff masonry (compression | to mortar bed joints) | -- | 3.85 | 2.07 | 0.86 |
Tuff masonry (compression
 to mortar bed joints) to mortar bed joints) |
-- | 3.96 | 2.22 | 0.92 |
Masonry parameters are different when compressive loads are parallel or orthogonal to the mortar bed joints. The mortar used is M2.5 class, it has compressive strength of 2.5 MPa. Young‘s ad shear modulii of masonry were higher than those related to tuff stone and mortar as shown in Table 1. This unusual feature is a consequence of the nature of the pozzolanic mortar, in fact pozzolana is a volcanic ash characterized by mechanical properties that significantly increase over time and in function of the humidity level. The presence of moisture inside the porous tuff unit induces a gradual tightening of the pozzolanic mortar and then of the whole masonry.
In the test the masonry wall was subjected to vertical load on the piers, and then to a horizontal load in a displacement controlled approach. Vertical loading consisted in 200 kN forces applied by hydraulic jacks at the top of the piers; such forces were kept constant during the following horizontal load. Horizontal loading consisted in a force at a height of about 300 cm from the base of piers, this force was applied through a servo-controlled hydraulic actuator supported by a reaction steel wall and a suspension system Fig. (1B).
Real-time measurements of the reaction force and the lateral displacement were obtained by a load cell located at the actuator side and a horizontal string potentiometer located at the opposite side. The instrumentation layout included LVDTs and string potentiometers to measure both flexural and shear deformations. The test was performed to investigate the in-plane nonlinear response of a masonry wall made of two piers and a spandrel panel.
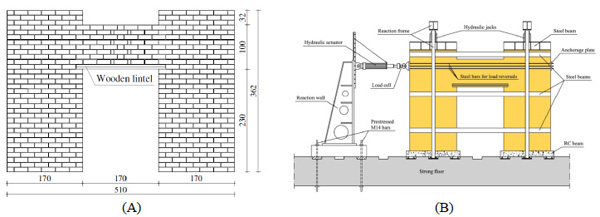
Experimental test: (A) Specimen geometry (dimensions in cm); (B) Experimental setup.
Modelling with SAP2000 Software
SAP2000 is a structural analysis software used for modelling the masonry wall, such software is widely used for structural design both in academia and in the profession. Masonry wall geometry and the mechanical properties were implemented in the software. Version 15 allows for nonlinear analysis with Shell elements, hence the portal frame was mashed into Shell elements (see Fig. 2) and nonlinear properties were assigned by means of constitutive equations for a "continuous homogeneous equivalent material", in fact tuff stone and mortar joints were not modelled separately. The wooden lintel placed over the opening was not modelled, however this did not affect the numerical analyses, as it will be shown later.
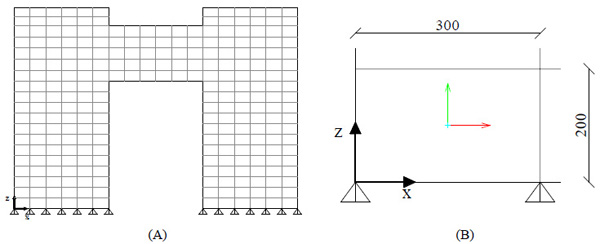
SAP model: (A) Geometry; (B) Dimensions of Shell elements (in mm).
A steel beam characterized by pure elastic behaviour was firstly inserted to simulate the metal plate used for the application of the lateral displacement in the experimental test. However stress concentration often led to non-convergence of the analysis. It was therefore assumed a pure elastic behaviour in the masonry elements close to the steel beam, preventing such stress concentrations to stop the analyses. A coarse mesh was adopted in order to reduce the computational effort and to calibrate a constitutive relationship compatible with the coarse model. This means that the constitutive relationship does not simulate local aspects of the response of the wall, but it allows simulating the average response of large portions of masonry.
In SAP200 the Shell element is a three or four node element that combines membrane and plate bending behaviour (Fig. 3). The Shell element can be of two types:
- Homogeneous is the most commonly used type of shell. It combines membrane and plate behaviour. The membrane behaviour uses an iso-parametric formulation that includes translational in-plane stiffness components and a “drilling” rotational stiffness component in the direction normal to the plane of the element [15, 16]. Plate-bending behaviour includes two-way, out-of-plane, plate rotational stiffness components and a translational stiffness component in the direction normal to the plane of the element.
- The layered shell allows any number of layers to be defined in the thickness direction, each one with an independent location, thickness, behaviour, and material. Material behaviour may be nonlinear. Out-of-plane displacements are quadratic and are consistent with the in-plane displacements. The layered shell usually represents full-shell behaviour, although this can be controlled on a layer-by-layer basis.
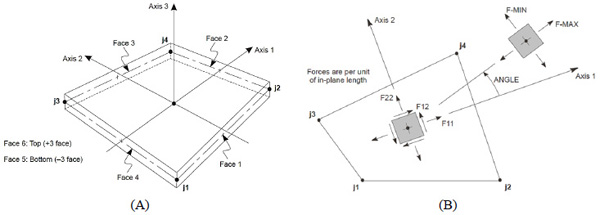
Area Element, Joint Connectivity and Face Definitions: (A) Four node Quadrilateral shell Element; (B) Stresses and membrane forces [1].
The masonry elements are modelled using the nonlinear layered shell element. The element type is a plane isoparametric 8 nodes "membrane" (deformations ε11, ε22 and γ12 are calculated from in-plane displacements only) quadrangular with an "equivalent homogeneous material". The thickness of the elements is equal to 310 mm and they have four integration points. The material behaviour is integrated on a finite number of points for ε11, ε22 and γ12, from 1 to 5 integration points; however a disproportionate number of integration points may increase the time of analysis. A compromise to have a good balance between accuracy and computational efficiency can be represented by four integration points. The non-linear behaviour of the material is in terms of stresses s11, s22 and s12. The total number of finite elements in the model is equal to 276 elements.
The boundary conditions are defined by constraining the base sections of the piers by means of external hinges. Vertical loads on piers were applied by means of even linear pressure to provide an axial force of 200 kN on each pier. Also in this case, to provide a uniform pressure, beams with elastic behaviour were inserted on the top of the piers. The monotonically increasing lateral load was applied to the wall based on a pushover displacement controlled analysis. The load has been applied at a height of about 3.00 m, i.e. just above the centreline of the spandrel, to simulate the transverse load transmitted by a slab.
Parameter Definitions of the Numerical Model
The wall was modelled as a homogeneous material to simulate the composite material. The masonry was considered isotropic because of the small differences in terms of mechanical properties in the two directions seen during characterization tests. The masonry is then modelled with a single stress/strain constitutive behaviour in both directions S11 and S22.
The parameters derived from experimental characterization, referring to load perpendicular to the mortar joints, were used to define the homogeneous material and the nonlinear characteristics of the material were also defined. A usual constitutive behaviour of a masonry macro-element subjected to loads normal to the mortar joints can be simulated by the curve in Fig. (4). The actual behaviour can be described schematically, for analytical purposes, in several ways.
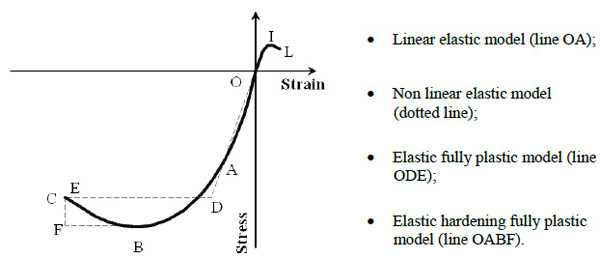
Typical masonry stress-strain curve.
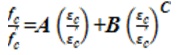
A more general formulation for the complete stress-strain relationship of the walls in compression is offered by the following polynomial relationship:
 |
(1) |
where f’c is the masonry compressive strength, ɛ’c is the strain corresponding to f’c and A, B, C are three coefficients describing the shape of the curve. Calibration of such A, B e C coefficients should be on experimental basis. In scientific literature typical values of such parameters are provided according to different authors:
A=2, B=1, C=2 according to [17]
A=6.4, B=5.4, C=1.17 according to [18]
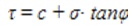
Ultimate strain ɛ’c for masonry is in the range 2.5-4 ‰. In this work the parabolic relationship proposed by [18] for masonry in compression was used. In tension a brittle behaviour of the material has been simulated with a linear elastic behaviour up to peak followed by a linear softening down to 20% of peak load followed by a further constant branch up to the ultimate strain (see Fig. 5).
The numerical model has been calibrated in terms of tensile and compressive behaviour by varying the softening behaviour (hence the ultimate strain or energy). All sensitivity analyses showed a negligible influence of the wooden lintel above the opening and some stress concentrations; hence the lintel was not included in the final numerical model.
To account for the shear strength of the masonry, the well-known Coulomb friction model was adopted, depending on cohesion and friction angle:
 |
(2) |
Masonry stress-strain curve: (A) Parabolic curve for compression; (B) Linear curve for tension.
Where c is the cohesion, σ is the normal stress and tanφ is the friction between the elements. In this work, it was considered a tangent of friction angle of 0.4 and zero cohesion.
ANALYSIS RESULTS
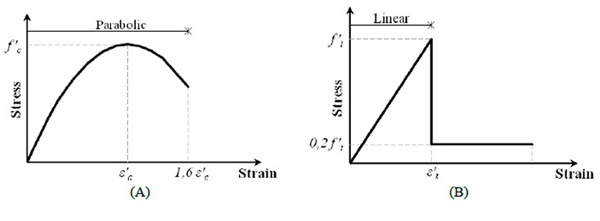
The load was applied in two phases; horizontal displacements were applied after the vertical pressure on piers. The test was performed in displacement control taking as reference a node in the same position of the displacement transducer used during the test. The numerical results were compared to the experimental results in terms of crack pattern and in terms of global force-displacement curve. Colour contour maps show the principal compression stresses (see Fig. 6A). The stress flow clearly shows the formation of a resistant mechanism characterized by diagonal struts. In particular there are three struts starting from the actuator with stress concentrations at the corners of the piers (see Fig. 6B). This stress distribution coincides with the crack pattern observed during the experimental test, characterized by failure of the piers due to normal stresses and due to shear in the spandrel.
Stress distribution [N/mm2]: (A) Principal compression stresses smin; (B) Resistant struts.
The comparison in terms of force-displacement curves shows that the numerical results obtained by SAP2000 captures quite well the initial lateral stiffness but greatly underestimate the ultimate displacement. In Fig. (7) the numerical force-displacement curve stops before the strength reduction corresponding to the formation of cracks in the spandrel. The use of a nonlinear constitutive relationship allowed simulating the stiffness variation (reduction) of the experimental curve subsequent to the formation of the cracks at the base of the piers in the initial part.
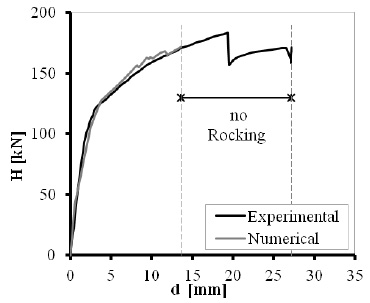
Numerical versus experimental force-displacement curves.
Numerical versus experimental results.
| Type | Peak force Hmax [kN] | Peak displacement d [mm] |
|---|---|---|
| Experimental | 184,31 | 27,18 |
| Numerical | 171,71 | 13,63 |
The large difference in terms of ultimate displacement (Table 2) is due to the marked phenomenon of rocking exhibited from the time when low load is applied, as described in [19]. The lateral load damaged especially the spandrel panel, without involving the adjacent pier panels. For low values of the displacement of the control point, a small horizontal cracking at the base of the right pier was initially found (see Fig. 8) due to rocking and rotation of the piers. Subsequently, the bending of the spandrel panel caused the opening of vertical cracks in the spandrel edges. Increasing the displacement, the rocking became more evident and diagonal cracking took place in the spandrel panel, due to the increase of stresses.

Observed cracks: (A) Damage front view; (B) Large rocking-induced cracks on piers.
The quasi-static tests allowed assessing the global response of the masonry wall. The behaviour has been quite linear, before cracking due to bending occurred in the piers. When the displacement increased, the force increased nonlinearly. The lateral stiffness of the wall changed significantly when cracks formed due to bending at the base of the piers. Forces and relevant interstorey drifts are reported in Table 3. As the lateral displacement increased, the stiffness of the wall remained constant up to the maximum force Hmax = 184 kN, or displacement of 19.74 mm (i.e. drift at peak θH max equal to 0.65%). At this point there is the formation of cracking in the spandrel panel which induces an instant loss of carrying capacity roughly equal to 15%. Further increasing the displacement, the lateral strength begins to rise again up to a force Hθmax = 172 kN or a displacement of 27.18 mm (i.e., maximum drift θmax equal to 0.89%). The degradation factor of force Csd, defined as the ratio between Hθmax and Hmax according to [20], was approximately 0.93.
Main outcomes of the test.
| Cracking force Hcr [kN] | Interstory drift at cracking θcr [%] | Peak force Hmax [kN] | Interstory drift at peak force θcr [%] | Force at maximum interstory drift Hθmax [%] | Maximum interstory drift θmax [%] |
|---|---|---|---|---|---|
| 99 | 0.06 | 184 | 0.65 | 172 | 0.89 |
| (0.5 Hmax) |
In this paper a further relationship that lets to account for rocking is proposed. The study carried out in ref. [19] shows that the main deformability was not due to mechanical intrinsic properties of the material. In this study an equivalent constitutive relationship able to describe the phenomenon of rocking was calibrated. Rocking induces high values of vertical displacements in the horizontal cracks at the base of the piers, coupled to concentrated rotations. Rocking effect was added in the constitutive behaviour.
Hence in tension and compression a higher deformation capacity is required to achieve greater deformability without stress increments. Adopting a coarse mesh to describe the macroscopic behaviour of a portion of masonry, the ultimate deformation in the constitutive relationship has to be properly calibrated. The analysis of the results obtained during the calibration phase revealed the need to increase the ultimate strain ɛ’c to reach the vertical displacements in the cracks at the base of the piers. The increase of deformation, Δεto achieve displacement capacity (see Fig. 9A), was inserted after the parabolic branch in compression as a translation of ɛ’c, to guarantee convergence stability and not altering the global strength. In fact the deformability of the counterpart in tension is guaranteed by a proper ultimate deformation, and global strength is limited by the tensile strength. Increasing compression strain allowed to achieve the ultimate tensile strain and higher compressive fracture energy reduced the rotations of piers.
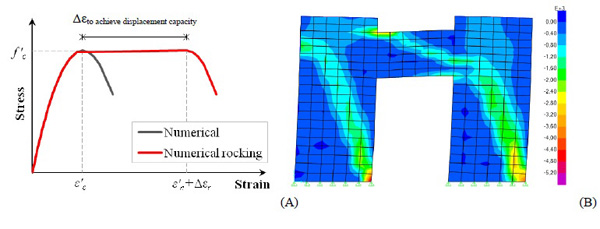
Masonry stress-strain curve:(A) Parabolic curve for compression, (B) Principal compression stresses smin.
This constitutive relationship does not yield to global strength improvements, Fig. (9B) shows a stress distribution similar to that shown in Fig. (6A) referred as “Numerical”. The increase of strain capacity introduced in the parabolic compression branch yields to an increase of lateral displacement capacity of the entire wall. The comparison between experimental and numerical shear force - displacement curves in Fig. (10) shows similar values for the control node, both in terms of force and displacement (Table 4). The lateral stiffness is identical to that obtained with previous constitutive relationship, as expected; in fact the only differences are in terms of lateral displacements.
Numerical versus experimental force-displacement curves.
Numerical versus experimental force-displacement curves.
| Type | Peak force Hmax[kN] | Peak displacement d [mm] |
|---|---|---|
| Experimental | 184,31 | 27,18 |
| Numerical rocking | 184,69 | 26,46 |
The deformed shapes due to the two different relationships are compared and Fig. (11) shows an increase of horizontal displacement of approximately 13 mm. In particular it is noted a greater rotation of the piers and the spandrel. The spandrel rotates more than pier panels.
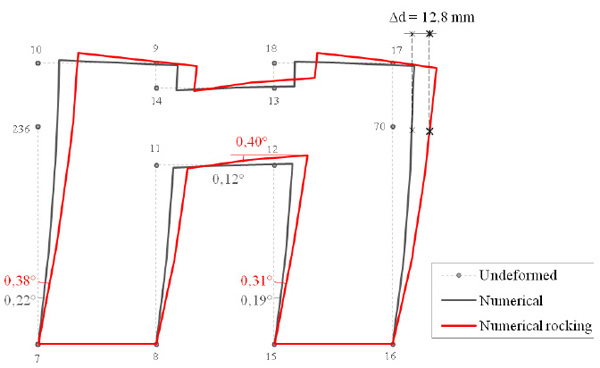
Comparison deformed shape undeformed versus numerical.
The node 70 was adopted as control node to perform the nonlinear static analysis, in the same position of the jack in displacement control during the experimental test. Tables 5 and 6 show in detail all the vertical and horizontal displacements of the external points of the wall. Higher values of vertical displacements were found in the upper corners of the two piers. The increase of deformation assigned to the constitutive relationship allowed the compressed strut to reach higher strains thus simulating the crushing of the edges of the piers.
In order to check the correct simulation of the rocking, the values of vertical displacement for the nodes of the shell, where cracks were found experimentally in pier panels, can be analysed. In particular, Fig. (12) show the nodes of the first row of shells in the two piers. In the two figures the trends of vertical displacements obtained with the two constitutive relationships are compared. Significant differences in terms of vertical displacements of the outer points of the two piers are evident. The constitutive relationship, with the increase of strain Δεto achieve displacement capacity to simulate rocking, allowed the pier to rotate following a ductile branch in tension. Without deformability in compression the analysis stopped without developing rocking.
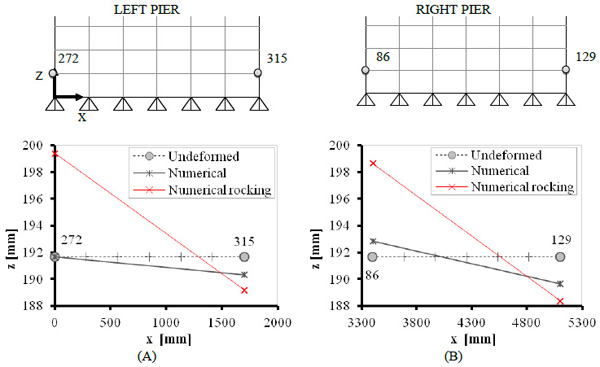
Vertical displacement: (A) External nodes of left pier; (B) External nodes of right pier.
Displacement comparisons.
| Undeformed | Numerical | Numerical rocking | ||||||
|---|---|---|---|---|---|---|---|---|
| Joint | x | z | Δx | Δz | R2 | Δx | Δz | R2 |
| Text | mm | mm | mm | mm | rad | mm | mm | rad |
| 7 | 0 | 0 | 0 | 0 | 0,0038 | 0 | 0 | 0,0066 |
| 236 | 0 | 2800 | 14,04 | 2,12 | 0,0030 | 25,54 | 6,43 | 0,0056 |
| 10 | 0 | 3620 | 15,42 | 1,98 | 0,0033 | 29,09 | 6,32 | 0,0060 |
| 9 | 1700 | 3620 | 15,39 | -1,58 | 0,0009 | 29,05 | -1,93 | 0,0037 |
| 14 | 1700 | 3300 | 14,45 | -1,50 | 0,0014 | 27,15 | -1,83 | 0,0030 |
| 13 | 3400 | 3300 | 14,36 | 0,94 | 0,0014 | 29,05 | 6,63 | 0,0044 |
| 18 | 3400 | 3620 | 14,77 | 0,90 | 0,0028 | 30,61 | 6,60 | 0,0063 |
| 17 | 5100 | 3620 | 15,35 | -2,11 | 0,0007 | 31,53 | -3,11 | 0,0049 |
| 70 | 5100 | 2800 | 13,63 | -2,04 | 0,0022 | 26,46 | -3,05 | 0,0063 |
| 16 | 5100 | 0 | 0 | 0 | 0,0030 | 0 | 0 | 0,0051 |
| 15 | 3400 | 0 | 0 | 0 | 0,0033 | 0 | 0 | 0,0055 |
| 12 | 3400 | 2300 | 12,69 | 0,99 | 0,0009 | 23,56 | 6,65 | 0,0044 |
| 11 | 1700 | 2300 | 12,36 | -1,47 | 0,0023 | 22,33 | -1,76 | 0,0045 |
| 8 | 1700 | 0 | 0 | 0 | 0,0038 | 0 | 0 | 0,0067 |
DISCUSSION
Comparison with Other Analysis Methods
Other numerical approaches to model the wall are discussed and compared (Table 7). In a multiscale approach the wall was modelled using two classical approaches to describe the behaviour of masonry structures: POR approach and equivalent frame method, SAM approach. The numerical results were compared to experimental results by analysing the global force-displacement diagram and crack patterns. Such approaches are valuable to model large scale structures; however the frame schematization is not always easy to perform in complex irregular structures hence jeopardizing the suitability of such approaches.
Displacement comparisons.
| Undeformed | Numerical | Numerical rocking | Undeformed | Numerical | Numerical rocking | ||||||||
|---|---|---|---|---|---|---|---|---|---|---|---|---|---|
| Joint | x | z | Δx | Δz | Δx | Δz | Joint | x | z | Δx | Δz | Δx | Δz |
| Text | mm | mm | mm | mm | mm | mm | Text | mm | mm | mm | mm | mm | mm |
| 272 | 0 | 191,67 | 1,49 | 0,004 | 2,600 | 7,729 | 86 | 3400 | 191,67 | 1,36 | 1,185 | 2,26 | 6,995 |
| 315 | 1700 | 191,67 | 1,46 | -1,355 | 2,595 | -2,487 | 129 | 5100 | 191,67 | 1,27 | -1,993 | 2,16 | -3,310 |
POR Method
In 1978, Tomaževic [20, 21] proposed a method called POR. This method models the structure in a very simplified way, taking into account only the contribution of the resistant vertical pier panels without examining the real stiffness of spandrel panels. The assumption of infinite stiffness of the slab, as connection between different masonry piers, instead of the effective stiffness of the system slab + spandrel, yields to vertical fixed elements without rotations at both ends. This method is a one dimensional model in which the elements are vertical, equivalent, deformable columns and the horizontal elements are infinitely rigid beams. This represents a clear limitation of the method as the piers are considered as the only possible source of deformability and failure, neglecting completely the role of the spandrels panels and their interaction. In this work the nonlinear static analysis was implemented in SAP2000 (Fig. 13) applying the seismic forces with a distribution proportional to the masses of the wall and inserting the elasto-plastic hinges at the midspan of the masonry piers.
POR method : (A) Equivalent frame models; (B) Elastic-plastic behaviour of pier (shear).
Shear strength for wall in-plane actions can be assumed, according to Italian Building Code [22] § 8.7.1.5, as:
 |
(3) |
SAM Method
The SAM method [23], acronym for Simplified Analysis Method, is an approach for nonlinear static analyses of masonry structures subjected to seismic actions. The method was developed for brick masonry but it proved to be applicable also for other types of masonry, including reinforced masonry.
The method uses a three-dimensional approach with macroelements consisting of beam type elements, according to an equivalent frame consisting of (Fig. 14):
- vertical axis elements (Piers) P;
- horizontal axis elements (Spandrel Panels) SP.
- Rigid Nodes RN
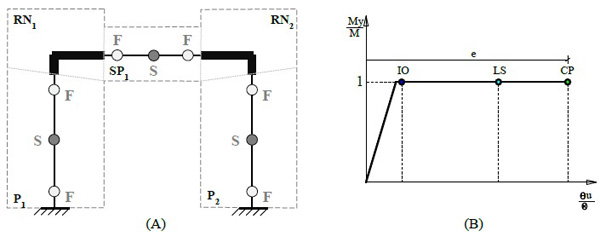
SAM method: (A) Equivalent frame models; (B) Elastic-plastic behaviour of pier (bending moment).
A building is modelled as an equivalent frame [24] between the foundations and the top surface of the roof. In this model, each vertical or horizontal element of the frame is represented by one-dimensional beam type element connecting the centroids of the connected elements, bounded by nodes at the intersections of the connected elements. Each element of the equivalent frame is characterized by an elasto-plastic-brittle behaviour accounting for flexural and shear response. Moreover, the introduction of rigid offsets at the ends of the piers, with appropriate dimensions, allows modelling the reduced deformability of joint panels (i.e. intersection of pier and spandrel panels).
Numerical versus experimental.
| Type | Peak force Hmax [kN] | Peak displacement d [mm] |
|---|---|---|
| Experimental | 184,31 | 27,18 |
| Numerical rocking | 184,69 | 26,46 |
| POR Method | 204,00 | n.a. |
| SAM Method | 159,07 | n.a. |
The values of shear and flexural strength were calculated according to the Italian Codes [22] and [25].
The shear strength of the piers (in shear dominated plastic hinges, S) is calculated as in the POR method, according to Eq. (3), while the flexural capacity (in flexure dominated plastic hinges, F) is evaluated according to [22] §7.8.2.2.1 as:
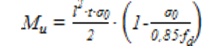 |
(4) |
The maximum flexural capacity, in horizontal elements with tensile strength, is evaluated according to [22] §7.8.2.2.3 as:
 |
(5) |
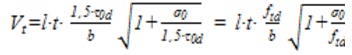
The shear strength Vt of ordinary coupling masonry beams with ring beams or lintels with flexural capacity can be calculated in a simplified way according to [22] §7.8.2.2.4 as:
 |
(6) |
Numerical Comparisons
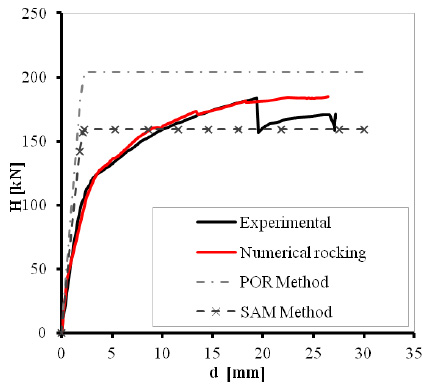
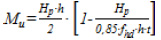
The non-linear static incremental analyses provided capacity curves and they allowed comparing the ultimate strength and the stress distributions within the walls according to various methods. This comparison revealed a close relationship between the considered failure mechanisms and the ultimate capacity of the wall, see Fig. (15). The POR method considers piers as the only resisting masonry elements characterized by a shear failure, and it predicts higher values of ultimate capacity. The SAM method instead considers a wider number of resisting masonry elements characterized by shear and flexural failure.
Numerical versus experimental force-displacement curves.
The shear force - displacement curve obtained by the SAM presents lower value of ultimate capacity due to different failure mechanisms. Both methods predict quite well the initial stiffness, however, not simulating the deterioration due to cracking in the second branch of the curve. Between the two methods, the SAM method seems most appropriate to simulate the behaviour of masonry buildings, and it underestimates the strength of the wall. It should be emphasized, however, that such simplified methodologies in many cases predicts the order of magnitude of the strength capacity and the failure mode but they cannot be used for every masonry structure if the simplified schematization is not feasible, including: the presence of staggered planes; openings not aligned, different number of openings at different levels; presence of irregularities; presence of underground floors and uneven ground. So in order to create a compatible model with the equivalent frame scheme it is necessary to: align the staggered floors, resulting in substantial changes; consequently consider the mezzanines modelled only as additional loads to the floors (not excluding them completely from the analysis); insert fictitious openings and eliminate others so that it is possible to build a coherent frame. This leads to a drastic change in the structural configuration and results may also deviate compared to the original real ones.
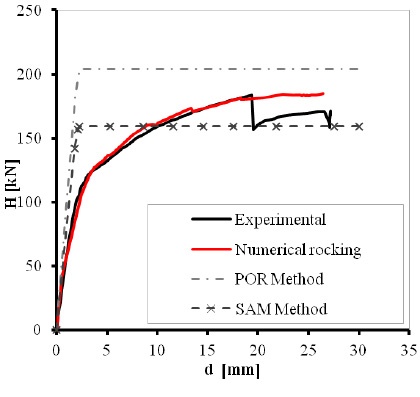
In this sense, in this work the methodology is intermediate between micro- and macro-modelling to reduce the computational cost. In this sense Finite Element simplified approach represents a valuable tool to understand the seismic response of entire buildings. In this case excellent results were found both in terms of strength capacity as in terms of ultimate displacement, simulating the rocking too. Fig. (16) reports different failure mechanisms obtained by the different methodologies compared to what was observed during the experimental test. The test was characterized by a marked rocking starting even at low levels of the applied load. Due to this phenomenon a marked cracking of piers at the base occurred, see Fig. (16A). The test showed a load drop at the failure of the spandrel, then another short horizontal branch. The failure mode obtained with the POR methodology, Fig. (16B), is the failure of the only possible resistant elements (i.e. shear failure of piers). This failure mechanism however is completely different from what was found during the experimental test. The SAM method, Fig. (16C), instead predicts the failure mechanisms observed during the experimental test, flexural failure of piers and shear failure of spandrel, however, this method has the limits described above. The FEM method Fig. (16D) predicts a similar failure mechanism. The properly calibrated model predicts well the failure mechanism, the location of stress concentrations and the experimental cracks. However both methods are not adequate in ductility simulation (e.g. according to POR the ultimate drift should be 0.4% H hence ultimate displacement about 12 mm) and they do not account for rocking.
Damage patterns: (A) Monotonic test; (B) POR method; (C) SAM method; (D) Numerical rocking.
CONCLUSION
Numerical simulation of masonry structures is a crucial task in structural engineering practice. The wide variability of masonry properties and geometries makes this task even more difficult. In the field of small masonry components, tested in laboratories, the micro-modelling seems a successful tool to model masonry, however the computational cost, the required knowledge on material properties and the masonry pattern replication make this approach not feasible for large masonry structures. In such cases simplified macro-modelling is required, and many methods were proposed in scientific literature. In this work two of them are discussed, POR method and SAM method and compared to a simplified FEM nonlinear approach. POR method is mainly limited by the assumption of shear failure of piers only, while SAM method is able to simulate more complex combinations of failure modes, however both of them requires rough simplifications of the geometry of the structure to fit the model assumptions. In this particular case the tested wall is regular and such limits are not evident, however rocking is not included and deformability predictions are not adequate. The proposed FEM approach is able to satisfactorily simulate strength capacity and failure modes of masonry structures and it can be extended to more complex large masonry structures, even assuming coarse meshes. A simplified nonlinear constitutive relationship is proposed for tuff masonry, whose behaviour is very different from traditional brick masonry where mortar is weaker than brick units. Future work will include the analysis of further analysis methods like as Discrete Element Methods, Macroelements analysis, nonlinear FEM analyses with orthotropic shells or even solid brick elements. In any case the scope of the work is the evaluation of professional oriented analysis methods to deal with real structures, with wide dimensions like as the aggregates, for fast but reliable vulnerability evaluations. In this direction further calibrated constitutive relationships will be provided for different masonries like as clay brick masonry, natural stone masonries, as sandstone or limestone.
CONFLICT OF INTEREST
The authors confirm that this article content has no conflict of interest.
AKCNOWLEDGEMENTS
Decleared none.

