All published articles of this journal are available on ScienceDirect.

Integrated Approach of Retrofitting an Existing Residential Building to a Nearly Zero Energy Building with Simultaneous Seismic Upgrading
Authors Info & Affiliations
Abstract
Introduction
The current study's goal is to apply an integrated approach of retrofitting a typical building in Cyprus that was designed and constructed for the refugee settlements in the period 1975-1985. The existing building is retrofitted to a nearly zero-energy building.
Methods
This typical type of building examined represents approximately 15,347 houses and stands for 3.57% of households in Cyprus. This percentage is considered significant with regards to energy consumption, as this type of structure has an estimated energy consumption of 1000 kWh/m2/y and CO2 emissions of 293.74kg CO2/m2/y. This corresponds to 0.293 Mt CO2/y, which stands for 4.18% of total CO2 emissions in Cyprus for 2011, based on the latest IEA (International Energy Agency) data. An integrated approach is followed for the retrofitting of the existing building, which involves both energy and structural upgrades, taking into account the earthquake resistance upgrade. Since Cyprus is in a highly seismic region, an important factor in this approach is the ability of the structure to survive a strong earthquake during its remaining lifetime, according to the design criteria. The study presents and discusses three possible coalitions with multiple scenarios of approaching the upgrade of the existing building. In each coalition, various criteria and implementation actions are considered based on the energy consumption, the CO2 footprint, and the seismic resistance.
Results
The study also investigates whether the extension of life expectancy of the existing structure through earthquake resistance upgrade will have a positive or negative effect on the CO2 life cycle footprint and cost of the building. Results show that for the examined typical building, simultaneous energy and earthquake resistance upgrade is more efficient in terms of cost and environmental impact. The building with the smallest construction age had the smallest Decision-Making Index (DMI) from the A, B and C coalitions.
Conclusion
It is important that for an existing building, the option to remain in its original state (coalition A) without any upgrading intervention is not the most favorable option. Therefore, the need to evaluate the existing building stock and plan the upgrade of the buildings in question is of utmost importance.
1. INTRODUCTION
1.1. Primary Energy and Energy Efficiency Police
During the last decades (1984–2018), international primary energy has grown by 49% and CO2 emissions by 43%, with an average annual increase of 2% and 1.8% respectively [1]. The review by Pérez-Lombard et al. [1] on the energy consumption of buildings and the associated data has shown that the rapidly growing world energy use of the last decades has already raised concerns over supply difficulties, depletion of energy resources and heavy environmental impacts.
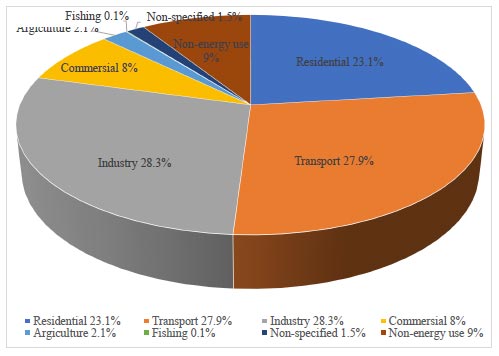
On a global scale, commercial and residential buildings use almost 40% of the total primary energy and are responsible for 24% of greenhouse gas emissions, according to the IEA [2]. The residential sector alone, as shown in Fig. (1), uses 23.1% of the world's energy.
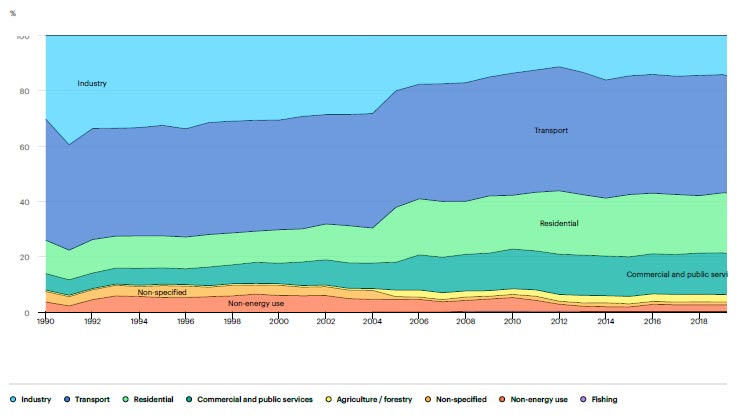
The IEA [3] gathered data on the total energy consumption by sector in Cyprus. As shown in Fig. (2), the residential sector starts with 12% of the total consumption for the period 1990-2004, gradually increases to 19% between 2004-2006, and stabilizes at 21% for the period 2006-2018.
Until now, the energy upgrade policy applied is mainly concerned with new buildings and not with existing buildings. Laustsen [4] describes and analyzes an approach to encourage energy efficiency in new construction regulations. Based on his study, policy proposals for improving how energy efficiency is addressed in building codes and other new construction laws are provided. He also argues that because structures have a lengthy lifespan of 50-100 years or more, considerable maintenance and enhancement will be required over their tenure. Refurbishments or enhancements are required because some sections of the structures, such as roofs, windows, boilers, air conditioning systems, and so on, will need to be replaced. Refurbishment is also required when the building's construction, equipment, or organization become insufficient. Laustsen [4] noted that since climatic factors have such a major influence on building standards and because there are different approaches to developing building rules, comparing these energy restrictions for new structures in different nations or areas is challenging. Simultaneously, it would be interesting to compare the code to the general optimum for the energy efficiency level required. One way to compare building regulations is to look at the lowest overall costs over time using life cycle analysis (LCA). In this comparison, the expenses of the investments must be weighed against the economic advantages to the building's owner or user in terms of savings. For structures in general, a 30-year term is fair to consider since this is a normal interval before a new building requires the first significant refurbishment and corresponds to maximum mortgage or loan lengths in many nations. According to CYS EN 15459: 2007 [5], the external surface life of the building blocks is 30 years.
Sassu et al. [6] proposed that the constructive management of existing constructions should take into account the structural safety, the energy cost, and the comfort conditions of the building. In particular, in the case of masonry buildings, the authors present a brief review of state-of-the-art structural and energy retrofitting techniques for existing masonry buildings and propose a definition of a new synthetic performance parameter P presented through an example and a more generalized approach. They suggest that this new parameter is capable of representing the retrofitting improvement in structural safety and thermal insulation for each masonry wall.
Subsequently, Mistretta et al. [7] concentrated on improving the thermal insulation of masonry buildings. Six example retrofitting interventions were characterized by increased thermal resistance, bending moment, and shear structural strength. The conclusion of the problem of retrofitting a single unitary masonry wall has been analyzed in a cost analysis framework, taking into account both structural and thermal performances. The unitary economic (€/m2) and ecological (kg CO2/m2) costs of retrofitting have been analyzed in order to obtain regression functions that allow direct comparison of various interventions. The main results presented are a synthesis of alternative masonry building retrofitting solutions. The authors mention that several European countries have recently implemented political initiatives to support long-term renovation, but currently, there is no international standard method for this kind of analysis. Finally, with regard to economic and ecological costs for the evaluation of the structural and thermal retrofitting strategies, the authors propose an integrated approach for the thermal insulation improvement of masonry buildings.
Belleri and Marini [8] investigated a framework for quantifying the impact of seismic events on building environmental impact assessments. The framework was a selected building that could have been located in different seismic zones. They assessed the building's environmental impact in terms of carbon footprint in two scenarios: after an energy refurbishment alone and after a combined intervention focusing on energy refurbishment and seismic retrofit. The main result of the study was that, in the case of only energy refurbishment and when the building is located in a high-seismicity region, an expected additional annual embodied equivalent carbon dioxide is presented due to seismic risk, which nearly equals the annual operational carbon dioxide after thermal refurbishment.
Giresini et al. [9] proposed a methodology to quantitatively assess the improvement of seismic and energy performance of masonry buildings through retrofitting interventions. The framework was an analysis of three masonry façades with and without LCA. The results show the necessity of always considering LCA for a reliable assessment: some retrofitting interventions are the most expensive in the construction phase, but they are also the most convenient in economic terms and in the amount of CO2eq emissions.
Also of interest is the research by Fiore and Donnarumma [10], who developed a decision-making process for drawing up a public administration strategy with the aim of optimizing school services in small municipalities. Their approach provides two levels of analysis. In the first level, a preliminary analytical phase of knowledge is developed, which leads to the definition of alternative intervention solutions and the evaluation criteria. The second level consists of the phases of constructing the building and solving the multi-criteria matrix, as well as the discussion of the results and the final choices of the decision-makers. An integrated multi-criteria approach is proposed to support the decision-makers involved, and in particular the local administrations to analyze the possible alternative interventions, taking into account the multiplicity of dimensions of the problem. Finally, they propose the adoption of three evaluation criteria: location, energy-environmental sustainability, and cost. The selection of these criteria aims to promote strategies oriented towards the three main dimensions: social, environmental, and economic.
It would be interesting for the states to make an energy upgrade policy for existing buildings based not only on energy consumption but also on the life expectancy of the building as an amortization time of the investment. At present, the existing buildings account for the largest percentage of the building stock for each country.
1.2. Nearly Zero Energy Building Definition
The definition of zero energy building (ZEB) has acquired considerable international attention during the last decade and is seen as the future goal of building design or renovation. The scientific community started with the main goal of developing a common understanding and an international definition framework of the ZEB.
Torcellini et al. [11] proposed that the definition of the zero-energy goal influences the choices designers make to attain it and whether they can claim success. The ZEB definition might emphasize demand-side or supply-side tactics, as well as whether fuel switching and conversion accounting are acceptable for achieving a ZEB target.. Torcellini et al. [11] studied the design impacts of four well-documented definitions:
- Net-zero site energy
- Net-zero source energy
- Net-zero energy costs
- Net-zero energy emissions
These definitions were applied to a set of low-energy buildings for which extensive energy data were available, and the large difference between definitions highlights the key characteristics of each definition.
Torcellini et al. [11] also suggested that ‘a net zero-energy building (ZEB) is a residential or commercial building with greatly reduced energy needs through efficiency gains such that the balance of energy needs can be supplied with renewable technologies.
Kilkis [12] advises that ‘a new concept was developed that is aimed to better quantify the environmental impact of buildings. They show that a net-zero energy building may or may not be a net-zero impact building; therefore, engineers, architects and decision-makers must recognize that the harmful emissions and global warming issues cannot be fully addressed by a simple net-zero energy building concept. The exergy dimension of the balance must be absolutely taken into account in order to fully reveal the magnitude of the problem and, at the same time, draw solution roadmaps.
According to Laustsen [4], ZEB can be defined in various ways, as follows:
- “Zero Net Energy Buildings are buildings that, over a year, are neutral, meaning that they deliver as much energy to the supply grids as they use from the grids. Seen in these terms, they do not need any fossil fuel for heating, cooling, lighting or other energy uses although they sometimes draw energy from the grid.”
- “Zero Stand Alone Buildings are buildings that do not require connection to the grid or only as a backup. Stand-alone buildings can autonomously supply themselves with energy, as they have the capacity to store energy for night-time or wintertime use.”
- “Plus Energy Buildings are buildings that deliver more energy to the supply systems than they use. Over a year, these buildings produce more energy than they consume.”
- “Zero Carbon Buildings are buildings that, over a year, do not use energy that entails carbon dioxide emission. Over the year, these buildings are carbon neutral or positive in the term that they produce enough CO2 free energy to supply themselves with energy.”
Despite the many years of discussion of the ZEB definition, there are no clear specifications on what calculation methodology and system boundaries to use, what the level of energy efficiency is, or what renewables can be implemented; hence, Panagiotidou [13] concludes that although the term ZEB has been used for some time, there is still no globally agreed definition or pathway to implement it.
EU decided that Member States should apply a methodology for calculating the energy performance of buildings in accordance with the common general framework as defined by the Directive 2010/30/EU [14], but this methodology should be adopted at the national or regional level.
Furthermore, to the various versions of the ZEB designation, the nearly zero energy building (NZEB) today is fully applicable to national building codes and international standards. The definition of the NZEB adopted by the Republic of Cyprus, based on its national needs, concluded that the definition of the NZEB imposes the following limits, Directive 2010/31/EU [15]:
- For residential buildings, the limit of 100 kWh/m2/y primary energy consumption with at least 25% being covered by renewable energy sources.
- For non-residential buildings, the limit of 125 kWh/m2/y primary energy consumption with at least 25% being covered by renewable energy sources.
The above definition of the Nearly Zero Energy Building has been adopted in the current study.
1.3. Embodied Energy
It should be noted that the NZEB definition does not take into account the structure's Life Cycle Analysis (LCA), i.e., the embodied energy of a building from the construction to the demolition is not calculated. Even for the newly designed buildings, the whole footprint of the structure is not considered.
Marszal et al. [16] suggest that an additional 25 kWh/m2/y should be included in energy demand calculations so that embodied energy is considered. According to the Department for Communities and Local Government (UK) resource, the embodied energy required for the material manufacture, construction, refurbishment and demolition may account for as much as 50% of the operational emissions of an ultra-low energy dwelling over an 80-year timeframe [17]. As a result, there is increased interest in comparing the energy and carbon embodied in buildings constructed using various methods and materials.
Thormark [18] states that the overall use of energy during a building's lifecycle is a growing research field. The initial construction energy of a building is a major component of the overall energy consumption of the building, particularly for buildings with zero energy consumption.
Recycling reduces the initial manufacturing energy, i.e., by using and re-using recyclable materials. In a 50-year lifespan, the initial construction energy represents 40% of the total energy needed. About 37-42% of the original construction energy can be recovered through recycling [18]. Recyclability was initially around 15% of the total energy use over a 50-year life span, so the emphasis will be on the energy intensity of the materials as well as whether the recycling principles were included in its phase.
Most of the energy recovery, about 90%, can be achieved through recycling and burning recyclables. In addition, a very important measure to facilitate future recycling is to use recyclable materials as well as to avoid constructions that are difficult to disassemble or where materials contaminate the environment [18].
Furthermore, Thormark reported that maintenance accounts for about 12% of total initial construction energy.
Asif et al. [19], in their study of a 3-bedroom maisonette house in Scotland, reported the following:
- 61% of the total construction energy of a dwelling is about concrete
- 13% of the total construction energy of a dwelling relates to timber
- 14% of the total construction energy of a dwelling relates to ceramic tiles
- Concrete and mortar are responsible for 99% of the total carbon dioxide generated for the construction of a dwelling.
According to Sartori and Hestnes [20], compared to an equivalent conventional building, passive heat-insulated homes show an increase in construction energy while reducing the total energy needed to 66% over the 80-year lifespan of the building. A new version of the design and construction of the passive house is expected to achieve a total reduction of the total energy needed to 25%. In conclusion, it is observed that decreasing demand for building operation is the most important parameter for designing buildings that are energy efficient throughout their life cycle.
According to Kohler and Hassler [21], the life cycle analysis of buildings has focused mainly on environmental impacts, with the result that the consumption of mineral resources has not been taken into account. They have also noted that in the case of buildings, resource value assessment is an important criterion for their long-term management strategies. Therefore, there is an urgent need to evaluate an integrated method of measuring the value of mineral resources for buildings.
Romano et al. [22] presented in their study that the key to sustainability in the construction sector is the integrated approach to the issue. They referred to the need to create a new way of constructing structures in order to reduce environmental impact and energy consumption. More specifically, they proposed the equation of all parameters in terms of equivalent CO2 emissions with the aim of guiding them to the sustainability of the construction sector, as required by the European targets.
Finally, Romano et al. [22] have pointed out that the reference price of CO2 emissions compared to environmental impacts remains low. In addition, the large difference between energy prices and CO2 emissions depends on taxes imposed on energy. Therefore, in order to understand the importance of external factors in the construction sector, the reference price of CO2 emissions needs to change in order to better reflect environmental and social costs.
The European Commission's policy Directive 2012/27/EU [23], to reduce greenhouse gas emissions by 85-90% in 2050 compared to 1990 emissions sets the framework in which an ambitious refurbishment scenario can be implemented.
According to the International Energy Agency’s Energy in Buildings and Communities Program, it is predicted that in most industrialized countries by 2050, new buildings will have contributed to energy consumption at a rate of 10% - 20%, with the remaining 80-90% relating to the existing building stock [24].
According to Ma et al. [25], the worldwide replacement rate of existing buildings by new buildings is only about 1-3% per year. Since this is a very small rate and since the factor “new buildings” will not change the energy problem in the short term due to energy demand, the existing buildings are an important factor in the energy balance.
If renovations to existing buildings are targeting only energy upgrading through the upgrading of individual building elements (such as roofs, facades, windows or heating systems) without a comprehensive inclusion of all parameters, there is a high likelihood of an inefficient and extremely non-cost-effective solution, with no long-term reduction in energy consumption.
Wang et al. [26] observed that the “investment cost” criterion is ranked first in the evaluation criteria set to be used in decision-making for sustainable energy, with the second criterion being “CO2 emissions” (as it focuses on environmental protection).
Ruparathna et al. [27], in their research on modern approaches to improve the energy efficiency of commercial and public buildings, found that there is a large number of such approaches. Therefore, they have suggested that a centralized integrated knowledge base is required to inform all relevant stakeholders in order to optimally decide on energy upgrading of buildings. It was suggested that further study is needed on the factors associated with approaches to energy upgrading of buildings, such as life cycle, implementation and costs.
1.4. Research Objective
Based on the literature review, a limited of the previous relevant studies investigated an integrated approach for retrofitting an existing structure taking into account both the aspects of the energy upgrade and the improvement of the structural performance. Considering the impact on national energy consumption, it would be extremely important to detect the optimal long-term coalition and scenario for the specific type of building, which could be achieved through both energy and seismic resistance upgrades. The current study presents and discusses three possible coalitions and scenarios for approaching the rehabilitation and energy upgrade of a particular type of existing reinforced concrete frame infilled with concrete masonry units (concrete blocks) buildings that represent approximately 3.57% of all residential buildings in Cyprus. In each scenario, all criteria and implementation actions are taken into account based on energy consumption, CO2 footprint, and earthquake resistance, which are the characteristics of the building. It is investigated whether the extension of the life expectancy of the existing structure through earthquake resistance upgrade will have a positive or negative effect on the Life-cycle CO2 footprint of the Structure. The purpose is to examine if life expectancy is an important factor in deciding to implement an optimal long-term integrated approach of upgrading an existing residential building to a Nearly Zero Energy Building. In order to achieve this goal, the CO2 footprint of the building must be benchmarked between the following three coalitions:
(A) Existing building that is in operation and in which the user chooses not to make any energy or static/seismic upgrades. The final Building Lifetime is the initial expected lifetime of the building.
(B) The existing building that is in operation and in which the user chooses to have only an energy upgrade. The final Building Lifetime is the initial expected lifetime of the building.
(C) The existing building that is in operation and in which the user chooses to have an energy and static/seismic upgrade. The final Lifetime of the building operation is the existing age of the building before the intervention was made, adding the updated initial expected lifetime of the existing building.
The most effective approach coalition and scenario for retrofitting an existing residential building to become a Nearly Zero Energy Building is discussed, and the conclusions are listed. The parameter of the extension of the life expectancy of the structure refers to the most effective coalition of retrofitting an existing residential building to a Nearly Zero Energy Building.
2. METHODOLOGY AND TOOLS
For the purpose of this study, a sensitivity analysis for each proposed retrofit measure was calculated using the software applications as described below for the following coalitions and scenarios. The subscript denotes the initial life expectancy of the structure, and the superscript denotes the final life expectancy for each scenario.
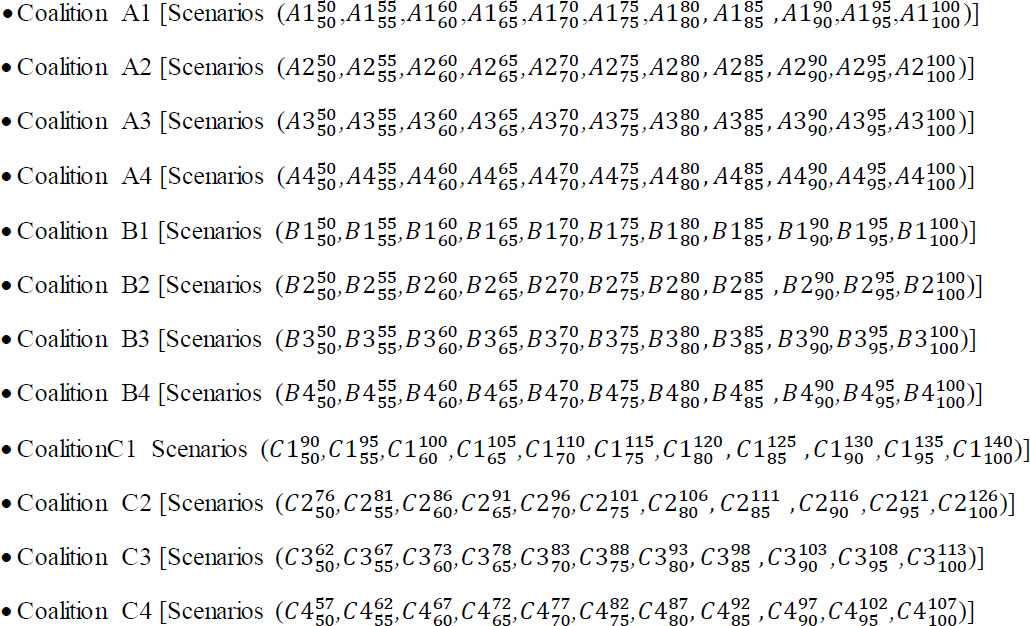 |
The letter A concerns the coalition where no energy or static/seismic upgrade is selected, the letter B concerns the cases where only an energy upgrade is chosen, and letter C concerns the cases where both energy and static/seismic upgrades are performed. The number that follows refers to the construction year of a building, with number 1 indicating 1980, number 2 to 1994, number 3 to 2008 and number 4 to 2013. The subscript indexes 50, 55, 60, 65, 70, 75, 80, 85, 90, 95, and 100 are the initial life expectancy values for each scenario. For example, the case A27575 refers to a building that was constructed in 1994, with an initial and final life expectancy of 75 years and remains without any energy or structural upgrade and the final life expectancy will be 75 years. Another example is the case C19050 that refers to a building constructed in 1980, with an initial life expectancy of 50 years and which was undergone a structural upgrade in 2020, resulting in a final life expectancy of 90 years ([2020 – 1980] +50 = 90). When referring to a coalition, a range of values is used in the subscript and superscript, indicating the range of initial and final years, respectively, that apply to this coalition.
2.1. Software Applications
The software used for the current study's objectives are the iSBEM-cy and STAAD.PRO V8i. For the energy consumption calculation, the iSBEM-cy is a free proprietary software interface to the Simplified Building Energy Model (SBEM), which is designed for the purpose of indicating compliance with the Republic of Cyprus building regulations with regards to carbon emissions from domestic or non-domestic buildings. The purpose of i-SBEM-cy is to produce consistent and reliable evaluations of energy use in non-domestic or domestic buildings for Building Regulations Compliance and for Building Energy Performance Certification purposes. Although it may assist the design process, it is not primarily a design tool, i.e., it does not calculate internal temperatures. As i-SBEM-cy is a compliance procedure and not a design tool, if the performance of a particular feature is critical to the design, even if it can be represented in i-SBEM-cy, it is prudent to use the most appropriate modelling tool for design purposes. The latest version at the time of writing is iSBEMcy_V3_4a, which is available as a download from the Ministry of Energy, Trade and Industry- Energy Service website [28].
For the structure bearing capacity calculations, the STAAD.PRO v8i is a structural analysis software with linear and nonlinear static and dynamic analysis capabilities [29].
2.2. Existing Building
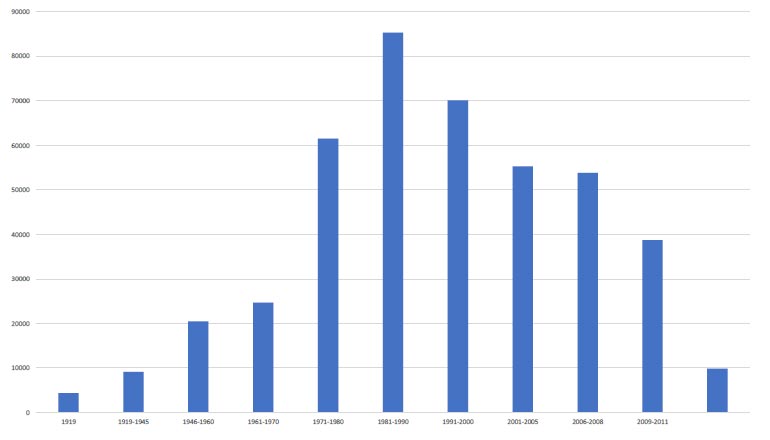
In this study, the structure that was studied belongs to the category of buildings, which concerns houses that have been constructed without energy efficiency or seismic standards in the Republic of Cyprus. According to the Statistical Services of the Republic of Cyprus (CYSTAT) [30], most of the houses that constitute the current Cyprus building stock were built in the 70s and 80s (Fig. 3). Specifically, 88.27% of the residential buildings were built without any thermal insulation, while 47.21% of those structures were constructed without any seismic code consideration since the first preliminary measures for seismic design were introduced in 1986, and the Cyprus Earthquake Code was implemented after January 1st 1994. Consequently, most of the structures before 1986 were designed for gravity loads only [31].
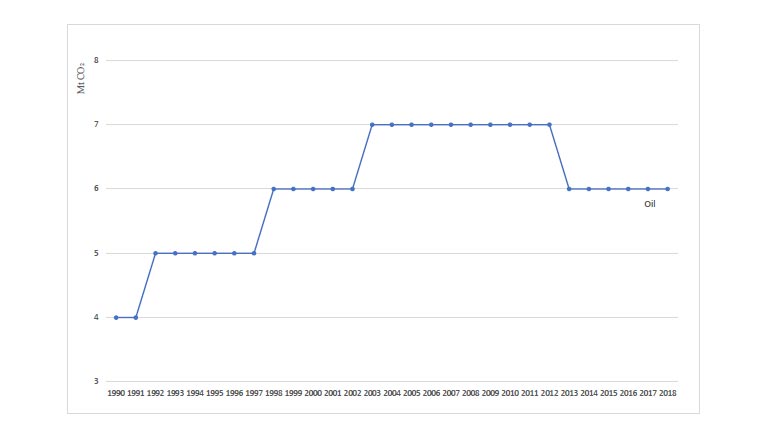
The building that is investigated in the present study is one of the 15,347 identical houses that were designed and constructed in Cyprus between the years 1975 - 1985 for the refugee settlements. This specific type of structure was the solution provided by the Cyprus Government to resolve the problem of the urgent need for houses for the large number of homeless refugees after the military events of the summer of 1974 on the island. Specifically, the building is a single-story masonry structure with an inclined timber roof. In the 2011 population census [30], the total number of households in Cyprus was 433,212 and therefore, the specific type of building accounts for approximately 3.57% of households in Cyprus. This percentage is considered significant with regards to energy consumption, as this type of house has an estimated energy consumption of 1000 kWh/m2/y and CO2 emissions of 293.74kg CO2/m2/y. This corresponds to 0.293 Mt CO2/y, which is 4.18% of the total CO2 emissions of the country in 2011, based on the IEA (International Energy Agency) data [3], as shown in Fig. (4).
2.2.1. Structural Properties
The building under consideration is a detached single-story house located in Limassol, Cyprus. The structural system of the superstructure is hybrid, consisting of a reinforced concrete frame filled with concrete masonry units (concrete blocks). The foundation consists of isolated concrete footings connected with grade beams. The inclined roof is made of timber beams and purlins, covered by clay tiles. The house has an internal floor area of 65m2 and was constructed in 1980 without any thermal insulation or seismic code provisions. At the time of this study, the building is 40 years old, with a remaining life expectancy of 10 years. From the macroscopic observation of the masonry and the exploratory sections, which were carried out with absolute respect and without causing damage to the building, the following conclusions emerged:
- The building is constructed with concrete blocks consisting of materials that seem to have lacked proper treatment and the correct content of cement proportions, and the exact compressive strength of the masonry system could not be calculated in this study because the samples were so fragile that it was not possible to do sampling. For this reason, the values for the mechanical properties of concrete block masonry used in the analyses were obtained from the relevant literature [32]. Specifically, the Modulus of Elasticity of the concrete masonry was taken equal to 2 GPa, while the compressive strength for new concrete blocks is taken within the range of 2 to 3 MPa and for the existing 0.1 MPa due to the pure condition of the existing concrete blocks.
- From site inspections and in-situ tests at the column members, it has been observed that the concrete is highly carbonized (7-8 cm), and its compressive strength ranges from 5-7 MPa.
- The steel reinforcement, apart from being heavily corroded, differs from the initially designed reinforcement, not in the cross-section size, but in layout. Specifically, the stirrups in columns and beams were placed with a spacing of 40 cm instead of 20 cm, which was indicated in the design drawings.
It is a fact that in Cyprus, the construction during the period 1975-1985 was done without much care for the various practical, social, and political reasons described above. At the same time, we must accept that the infill masonry improves the frame system, and the bearing capacity of the system is estimated to be greater.
2.2.2. Energy Properties
The current condition of the building in terms of thermal insulation is described in Table 1. The Uvalue is the thermal transmittance of the construction element, given in W/m2K. It can be calculated using the combined method given in BS EN ISO 6946 for simple constructions. Constructions, such as cladding and steel frame constructions require more complicated calculation procedures, and an appropriate methodology should be followed. The Cm is the effective thermal capacity of an element (wall, floor, ceiling, etc) given in kJ/m2K. The TSolar is the total solar energy transmittance defined as the time-average ratio of energy travelling through the un-shaded element to that incident upon it. The amount of visible solar energy that passes through a glazing system represented as a proportion of the visible solar energy incident on it, is known as the LSolar (light transmittance). This value will be used for the daylighting calculations. The SSEER is the system seasonal energy efficiency ratio for cooling that takes account of the seasonal efficiency of the cold generator, thermal losses and gains to and from pipework and duct leakage. It does not include the energy used by fans and pumps. The combined cooling demand of all the zones served by a particular system divided by its SSEER gives the energy consumption of the cooling system. The SSEFF is the system seasonal efficiency for heading, taking account of the seasonal efficiency of the heat generator, thermal losses, and gains to and from pipework and duct leakage. It does not include the energy used by fans and pumps. The combined cooling demand of all the zones served by a particular system divided by its SSEFF gives the energy consumption of the heating system.
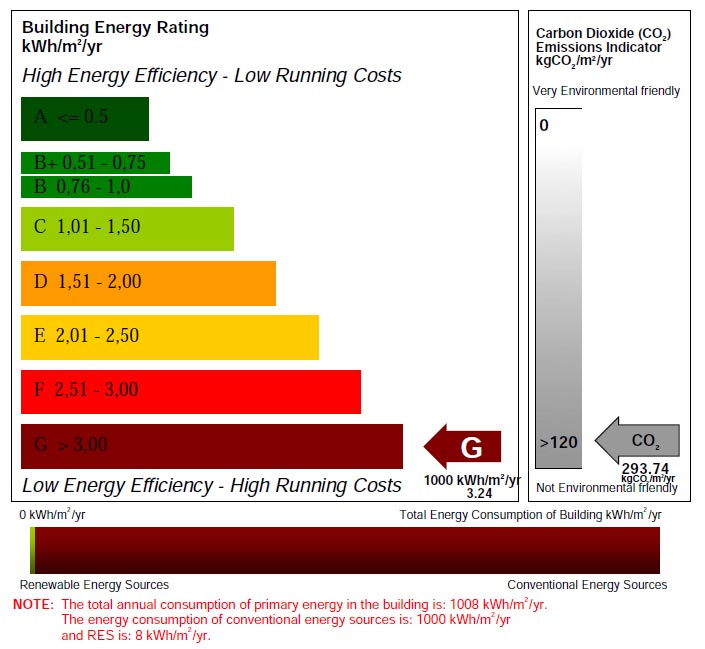
The estimated energy consumption and energy category label of the existing structure is 1000 kWh/m2/y, and the emissions are 293.74kg CO2/m2/y (Fig. 5).
| External Walls | Uvalue =1.763 W/m2k |
|---|---|
| Internal Walls | Cm =132 kJ/ m2k |
| Uvalue =2.090 W/m2k | |
| Cm =61.2 kJ/ m2k | |
| Columns and beams | Uvalue =3.367 W/m2k |
| Cm =228 kJ/ m2k | |
| Roof | Uvalue =4.419 W/m2k |
| Cm =230 kJ/ m2k | |
| Floor | Uvalue =0.706 W/m2k |
| Cm =100 kJ/ m2k | |
| Windows frame | Uvalue =2.970 W/m2k |
| Cm =64 kJ/ m2k | |
| Glazing | Uvalue =5.00 W/m2k |
| TSolar = 0.85 | |
| LSolar = 0.90 | |
| Split Unit | - |
| Heating | SSEFF=2.5 |
| Cooling | SSEER=3.4 |
| Solar Hot Water | - |
| Solar Panel | 3m2 |
| Tank | 150 liters |
3. STRUCTURAL MODELING
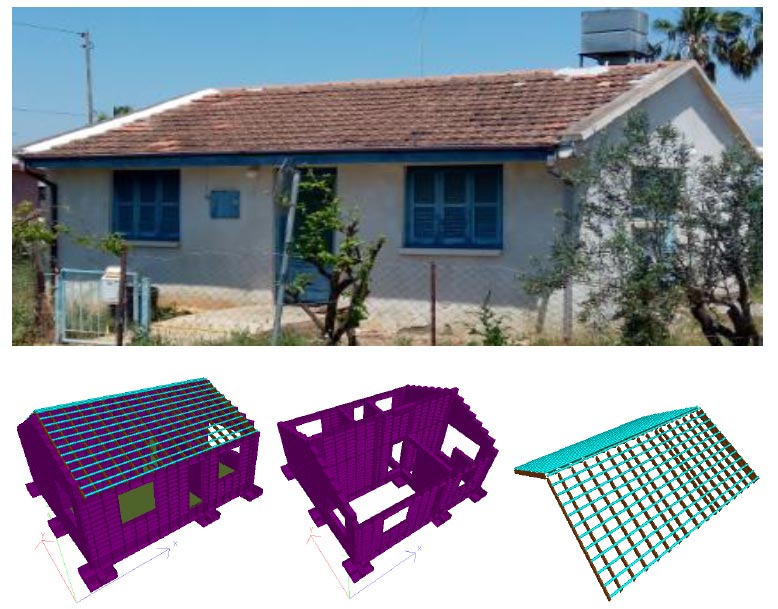
Based on the on-site description of the building, an appropriate finite element model was formed to simulate the structure and calculate its response under the influence of the various actions. The case study was a real building, and material data were validated on-site. Using the analysis software STAAD.PRO V8i, the modelling of the structural system was carried out using elastic isotropic spatial elements (solid) and elastic linear elements (beams), as shown in Fig. (6). Specifically, the three-dimensional (3D) solid finite elements were used to simulate the masonry and the frame elements for the beams and columns (Fig. 6).
The assessment of the strength of the existing building is based on the fact that the structural system consists primarily of the reinforced concrete framework and, secondarily, the un-reinforced masonry of cement blocks, which act as a supplement to the resistance of the R/C frame. The roof of the building is supported on a 20cm x 30cm R/C beam, running along the top level of the masonry edges of the building. A total of 1709 solid finite elements and 867 frame elements were used. The behavior of the concrete masonry units with an intermediate mortar-joint, is considered to be brittle and linear until failure. This was based on relevant compression tests that were performed on samples taken from the site.
3.1. Seismic Analysis Data
The total mass of the building was found to be 81.18 tons. Specifically, the mass of the roof corresponds to 4.8 tons, and the mass of the building corresponds to 76.38 tons. The mass of the masonry was considered distributed in the 3D solid finite elements. Based on Eurocode 8 part 3 (1998-3:2005) [33], the value of the behavior factor q was taken to be equal to one since the structure’s seismic performance was to be assessed for the specified seismic action. According to the Eurocode 8 national annexes CYS EN 1998-1:2004, part 1 [34], national parameters have been determined for fundamental requirements of a structure after a seismic action, and for this structure, the stage “Limit State of Damage Limitation” is selected. The reason is that this stage ensures that the structure has a longer life expectancy of operation/use. Discontinuation of operation/use of the building is undesirable. Note that the cost of any investment, i.e., the energy consumption upgrade cost of the structure, should be paid back according to its operating time. The Limit State of Damage Limitation does not prevent only the overall damage in the whole structural system but also any local damage in the various structural elements. Non-load-bearing components may be damaged and can be easily and economically repaired. This is achieved by limiting the system's deformations (horizontal movements) to levels that are acceptable for the integrity of all its members, including non-load-bearing members.
3.2. Structural Analysis
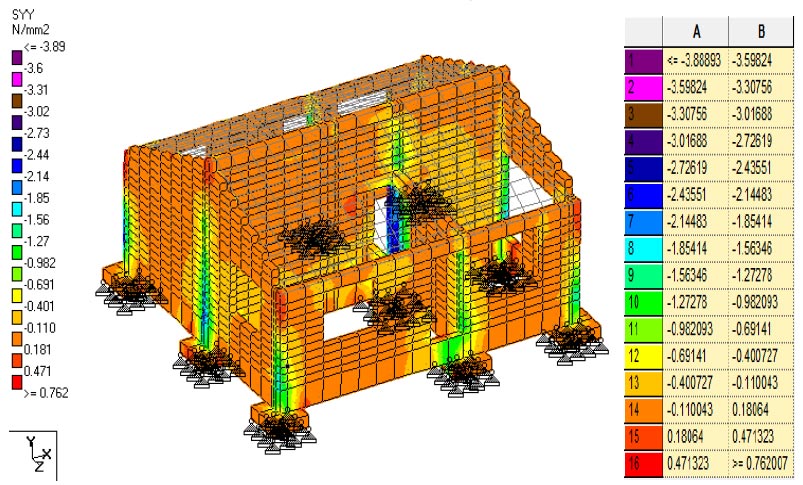
The structure was analyzed two times. The loads of the first analysis was the gravity, live, wind and snow load as they are described in the Eurocodes and the building capacity was assessed for the various load combinations according to the same building code. The ledger in Fig. (7) shows the numbers of the limits of each color in the figure. Column A is the upper limit, and column B is the lower limit. As shown in Fig. (7), for the load combination of 1.35 G+1.5Q+0.9W+0.75S, the analysis indicates that the normal stress SYY of concrete blocks (solid element) in many areas has values between -0.11 N/mm2 and +0.18 N/mm2 (negative values are compressive and positive values are tensile), which is close to its maximum capacity, and in some others it has values between -0.98 N/mm2 and -0.69 N/mm2 which exceed the strength limits of the existing concrete block masonry. This is the most critical combination for gravity loads. After the completion of the assessment of the roof bearing capacity, it was considered necessary to replace it and statically upgrade it, i.e., remove the existing beams and replace them with greater cross-section. In the design of the construction, it was taken into account that for the energy upgrade of the roof, the permanent loads will increase by 10 kg/m2. In addition, due to the inclination of the roof, it is not possible to achieve a rigid diaphragm at the level of the roof.
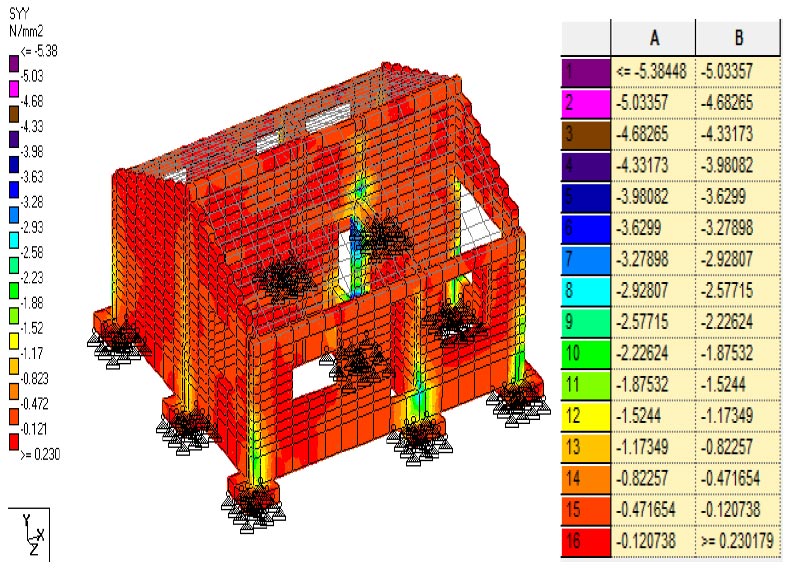
In the second analysis, a seismic action was added, with a peak ground acceleration of 0.25g. As shown in Fig. (8), the analysis indicates that for the load combination of G + 0.3 Q - Ez, the developed stresses at certain structural members of the superstructure reach values between -1.52 N/mm2 and -1.17 N/mm2, which far exceed the strength limits of the existing masonry concrete block.
3.3. Seismic Retrofitting of the Existing Building
The degree of intervention for the existing building mainly intended not only to restore the original life expectancy of the construction to 50 years but also to simultaneously upgrade the existing seismic capacity, thus giving a final life expectancy of 90 years since the building at the time of the upgrading is considered to be 40 years old. The fact that the seismic resistance upgrade was based on the EC-8 provisions ensures a longer life expectancy of operation/use of the structure. The upgrade of the existing building was achieved through interventions in the foundation, the superstructure, and the wooden roof system.
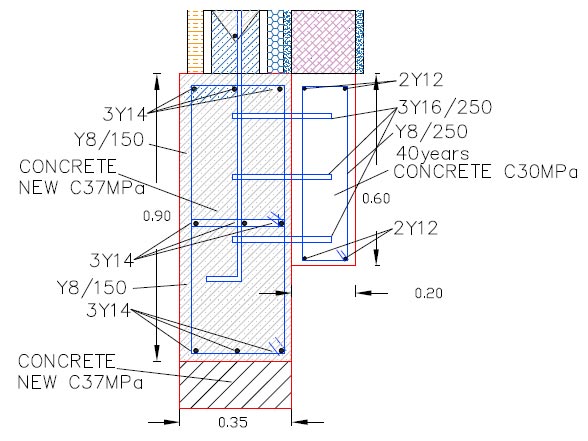
For the foundation, as Fig. (9) shows, a new R/C grade beam was constructed along the perimeter with dimensions 35cm x 110cm and double zone reinforcement. The characteristic compressive strength of the concrete used was 37 MPa. The new foundation beam was anchored to the existing beam and at the top level of the beams, a new ground slab (floor) was constructed with reinforcement mesh #Y12/200, acting also as a floor diaphragm.
The exterior masonry-infill walls of the superstructure (shell), as shown in Fig. (10), were replaced by new types of concrete masonry units of higher compressive strength and durability. Specifically, the superstructure’s structural system consists of load-bearing reinforced masonry, which is supported on the new peripheral foundation beam and was constructed without demolishing the old masonry.
The new concrete blocks are made of concrete with a characteristic compressive strength of 37MPa, while the overall compressive strength of the concrete blocks is 7.5 MPa. Both vertical and horizontal reinforcement are embedded in the masonry. The diameter of the vertical bars is Y14, with a spacing of 250mm, and the diameter of the horizontal steel bars is Y12, placed every 200mm.
Concerning the block filling material, a higher quality concrete could be used for higher compressive strength. Tayeh et al. [35] observed that the compressive strength increased by 50% and 65% for concrete comprising 2.5% hooked-end fiber and corrugated fiber, respectively, when compared to concrete with the same volume of straight fiber. Tayeh et al. [36] suggest that the utilization of available supplementary cementitious materials is a critical step in saving energy and materials, as well as lowering the cost of concrete, and they investigated the impact of sand grain size distribution, supplementary cementitious materials, and curing regimes on the compressive strength of ultrahigh-performance concrete.
The structural system of the roof was maintained the same, but the existing 2” x 6” main timber beams (rafters) were replaced with new, larger cross-section dimensions, i.e., 3” x 8”.
The upgraded structure was analyzed, and its load-bearing capacity was found to be at a sufficient level. Specifically, the analysis indicates that the stresses in almost all parts of the new structure do not exceed their capacities.
3.4. Energy Upgrade of an Existing Building
A sensitivity analysis for each proposed retrofit measure was calculated using the iSBEM-cy software. What is calculated is the whole CO2 footprint of the final amount of the embodied energy of the structure and the CO2 footprint amount of the energy consumption with and without the upgrade actions. The interventions in the shell of the building concerned the following:
- For the masonry, an installation of thermal insulation with stone wool 5 cm thick outside and inside the space was considered.
- For the roof, installation of thermal insulation with extruded polystyrene (XPS) 5cm thick externally and with thermal insulation 5 cm thick stone wool inside the space was considered.
- For the windows, replacement with a Polyvinyl chloride (PVC) frame and double-glazing glass was considered.
- For the floor, installation of thermal insulation with expanded polystyrene (EPS) 5cm thick was considered.
- For the mechanical units, replacement with high efficiency ones was considered.
Table 2 presents the thermal insulation properties of the structure after the energy upgrade, based on the nZEB EU definition and the nZEB-specified limits implemented by the Republic of Cyprus (limits presented in Table 3).
| External Walls | Uvalue =0.316 W/m2k |
|---|---|
| Internal Walls | Cm =54.8 kJ/ m2k |
| Uvalue =2.090 W/m2k | |
| Cm =61.2 kJ/ m2k | |
| Columns and beams | Uvalue =0.324 W/m2k |
| Cm =54.8 kJ/ m2k | |
| Roof | Uvalue =0.3 W/m2k |
| Cm =10.8 kJ/ m2k | |
| Floor | Uvalue =0.323 W/m2k |
| Cm =100 kJ/ m2k | |
| Windows frame | Uvalue =1.3 W/m2k |
| Cm =64 kJ/ m2k | |
| Glazing | Uvalue =1.28 W/m2k |
| TSolar = 0.63 | |
| LSolar = 0.80 | |
| Split Unit | - |
| Cooling | SSEER=9.2 |
| Split Unit 2 | - |
| Cooling | SSEER=6.5 |
| Solar Hot Water | - |
| Solar Panel | 4m2 |
| Tank | 250 liters |
| Heat Pump | - |
| Heating | SSEFF = 4.60 |
| Heat Recovery | 1000m3 /h A class |
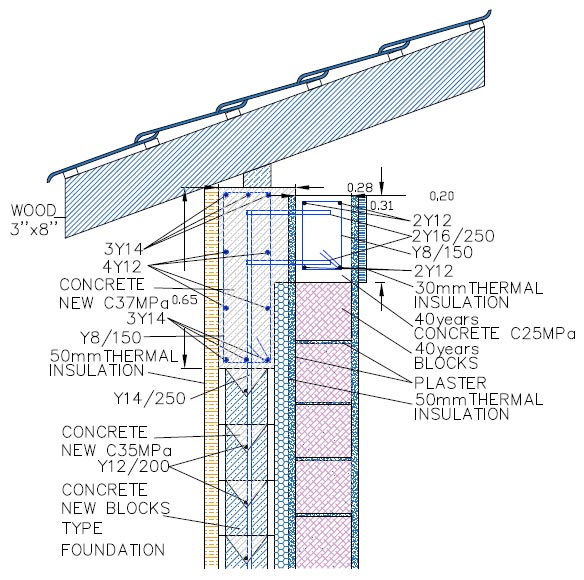
Table 3.
| Energy Label | A |
|---|---|
| Maximum energy consumption | 100 kWh/m2/y |
| Maximum energy consumption for heating | 15 kWh/m2/y |
| Minimum percentage covered by renewable energy sources | 25% |
| Maximum Uwall | Uvalue =0.4 W/m2k |
| Maximum Uwindows | Uvalue =2.25 W/m2k |
| Maximum Uroof | Uvalue =0.4 W/m2k |
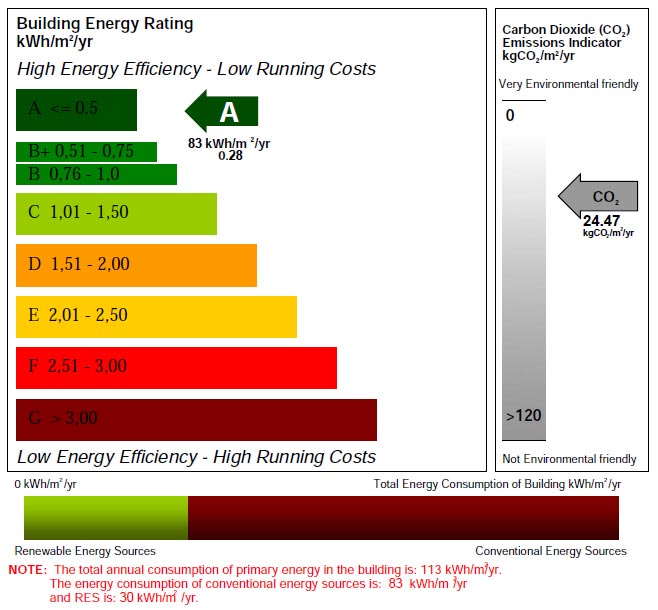
Retrofit insulation levels were designed to transform the existing building into a nearly zero-energy building. The retrofit model evolved to include a combination of passive house and green life cycle principles. The green life cycle standard was adopted to achieve a comprehensive retrofit, covering issues, such as energy consumption and embodied energy of the materials. In order for a building to be qualified as nZEB, it must comply with the administrative regulatory practices of the Republic of Cyprus, ΚΔΠ 432/2013 [37] and ΚΔΠ 366/2014 [37]. After the upgrade actions, the estimated energy consumption of the house and the energy label of the energy upgrade condition is 83 kWh/m2/y, and the CO2 emissions are 24,47kg CO2/m2/y, (Fig. 11).
4. RESULTS AND DISCUSSION
In this section, the calculations for the various energy upgrade scenarios are presented and discussed. In these calculations, a photovoltaic system with an output of 1 kW and an area of 4m2 is also included. The embodied carbon is also estimated for the three coalitions, from cradle to site of the construction. An inventory of the materials and fossil fuel energy utilized in the construction was used to calculate the primary energy consumed and the associated embodied carbon. For the 1980 building, the Life-cycle CO2 Footprint of the Structure is the following:
- For coalition A1, scenario A15050 it is 1150.01 tons with a final life expectancy of 50 years,
- For coalition B1, scenario B15050 it is 968.65 tons for a final life expectancy of 50 years and
- For coalition C1, scenario C19050 it is 1124.05 tons for an initial and final life expectancy of 50 and 90 years, respectively.
The embodied carbon CO2 for the above scenarios was found to be:
- 28.83 tons for the initial existing building, i.e., 443.53 kgCO2 per m2.
- 11.77 tons for the energy consumption upgrade, i.e., 181.07 kgCO2 per m2
- 29.26 tons for the seismic upgrade, i.e., 450.15 kgCO2 per m2.
The CO2 footprint of the demolition of the retrofitted building is equal to 0.45 tons in the scenario C19050, corresponding to 0.04% of the life cycle structure total footprint, and in scenario B15050 it is equal to 0.23 tons, corresponding to 0.02% of the life cycle structure's total footprint. Figs. (12-15) show the variation of the results when the initial life expectancy of the structure changes from 50 to 100 years by a step of 5 years. Fig. (12) shows how the life cycle CO2 footprint of the structure varies with its initial life expectancy. For coalition A150-10050-100 (non-intervention on existing structure) there is a significant increase in the CO2 footprint as life expectancy is extended. In coalitions B150-10050-100 (energy upgrade) and C190-14050-100 (energy and seismic resistance upgrade) there is a considerably smaller increase in the CO2 footprint as life expectancy is increased, in comparison to the respective increase of CO2 footprint in coalition A150-10050-100.
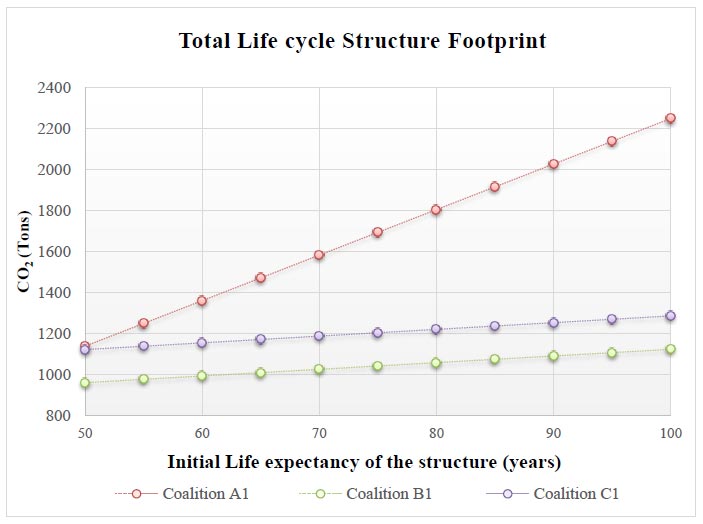
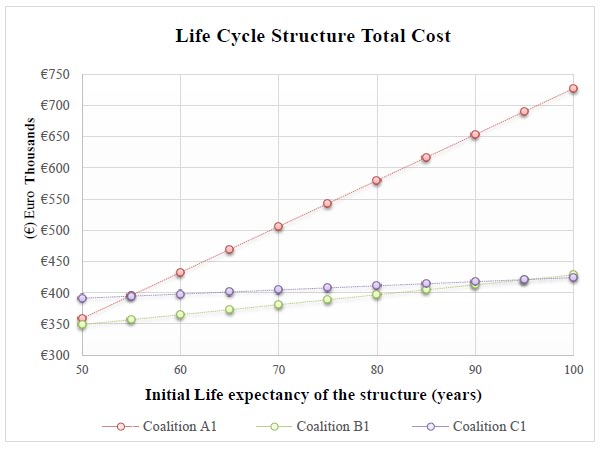
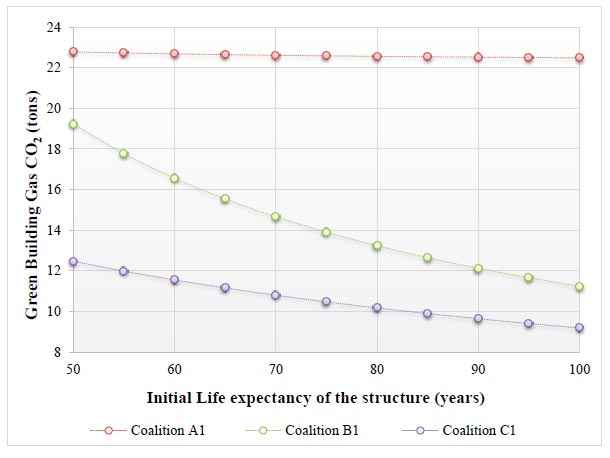
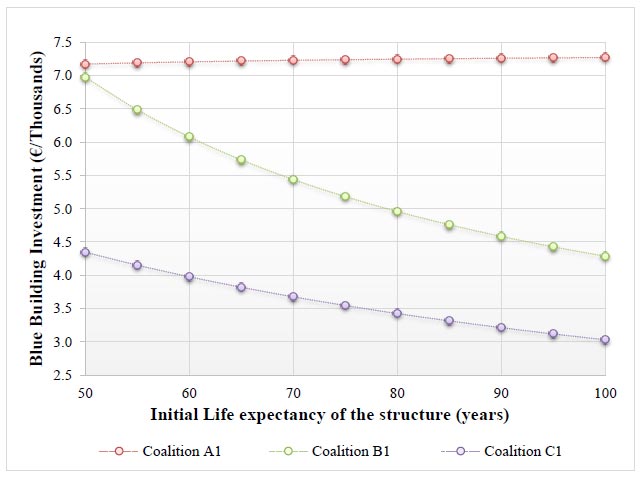
Fig. (13) shows how the life cycle total cost of the structure varies with the initial life expectancy. In coalitions B and C, there is initially a cost increase due to the upgrading actions that took place in the 40th year of the life of the structure, but from the figure, it can be observed that the increase is negligible even for an initial life expectancy of 50 years for coalition B in which the savings from the use of the energy upgrading for 10 years reduces the overall total cost compared to the one for scenario A15050. For coalition C1, the cost increase due to the seismic upgrading is large and has an initial life of 55 years (C19555) is required so as for coalition C1 to start being more cost-effective than coalition A1, and a 95 year one (C113595) so as for coalition C1 to start being more cost-effective than coalition B1.
In the context of the evaluation model, the ranking of the coalition’s intervention is defined by the overall footprint of each scenario in relation to the final expected lifetime of the structure. The quotient of the total environmental footprint and the economic footprint with the final expected lifetime of the existing building determines the final proposed indicators, which determine the optimal intervention solution to upgrade an existing building environmentally and economically.
The proposed decision indicators concern the two sets of criteria and the final ranking index, and their value is defined as follows:
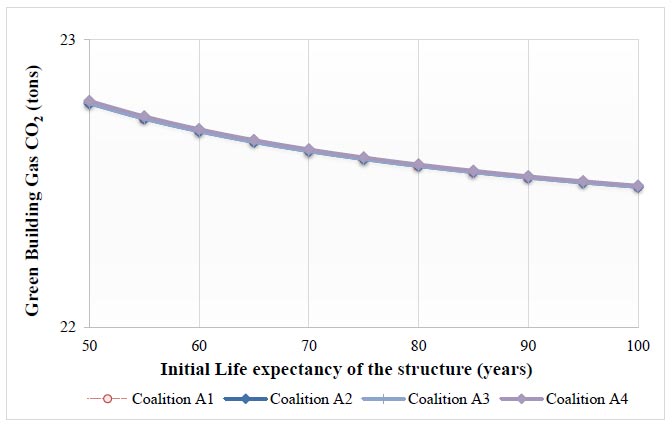
| I. Green Building Gas CO2 (G.B.G.C) Index = Life-cycle CO2 footprint of the structure (in tons)/ Final Life Structure Expectancy (in years), | (1) |
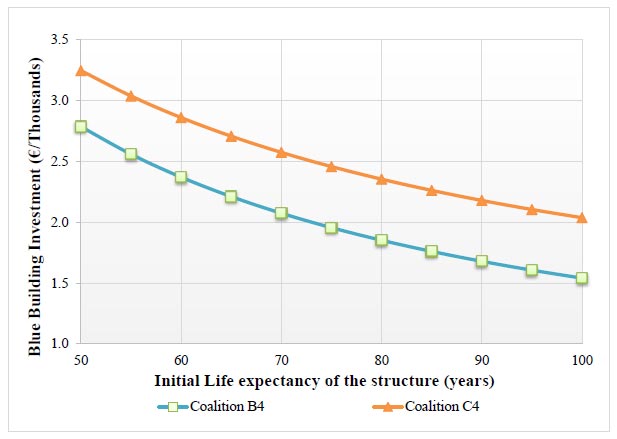
| II. Blue Building Investment (B.B.I) Index = Life-cycle total cost of the structure (€)/ Final Life Structure Expectancy (in years), | (2) |
| III. Decision Making Index (DMI) = Blue Building Investment (B.B.I) Index + Green Building Gas CO2 (G.B.G.C) index, | (3) |
The results for all the proposed scenarios and coalitions are shown in the following figures. Fig. (14) represents the fluctuation of the ‘CO2 footprint per year’ fraction as the years of life expectancy are extended. In coalition A1, the values of the fraction remain almost stable as the life expectancy is increasing, whereas in coalition B1 and C1 there is a gradual decrease of the CO2 footprint per year as the life expectancy is extended over the years. Positive is the fact that in coalition C1, CO2 footprint values fall more than 50% compared to respective values in coalition A1 and remain clearly lower than in coalition B1. Fig. (14) shows that for a life expectancy of 85 years of the existing structure with coalition B1, there is nearly the same CO2 footprint per year as for the life expectancy of 50 years with coalition C1[C19050]. The scenario C19050 has a final life span of 90 years ([2020 – 1980] +50 = 90), after an upgrade for a seismic action for the design spectrum, which is applied to the existing structure, with the probability of exceedance, PNCR, to be 10% and the reference return period, TNCR, to be 475 years and a peak ground acceleration to be 0.25g and the corresponding design life of the structure, TL, is 50 years [33]. Also, coalition B comparatively with coalition C, for the scenario B19090 with an initial life expectancy of a promising final life span of 90 years, with no seismic action applied to the existing structure the risk for the not depreciation of the investment is a lot greater than the scenario C19050. It should be noted that after the seismic upgrade, the probability of the scenario C19050 to exceed the design seismic load is lower than the scenario B19090 without any seismic upgrade.
Fig. (15) represents the fluctuation of the ‘Life Cycle total Cost per year’ fraction as the years of life expectancy are extended. The total cost per year (in €) as the life expectancy is extended over the years is presented. In coalition A150-10050-100, the total cost remains the same as the life expectancy increases, denoting that the cost is independent of the years of life expectancy. In coalitions B150-10050-100 and C190-14050-100 there is a gradual decrease in the above-mentioned cost as the life expectancy of the structure is extended. Note that scenario C19050 clearly is the most cost-effective scenario, i.e., the cost is reduced by 39.4% ([€7173-€4345/€7173])) compared to the scenario A15050 and by 37.7% ([€6975- €4345/€6975]) compared to scenario B15050. For an initial life expectancy of 90 years, the B19090 scenario results in a cost of 4584 €/year, which is higher compared to one of the C19050 scenario with an initial life expectancy of 50 years and a final life expectancy of 90 years ([2020 – 1980] +50 = 90), which gives a cost of 4345 €/year.
It seems that even for the B1100100 scenario with an initial life expectancy of 100 years for the existing building (100 years) for which a cost of €4285/yr is obtained, scenario C19050 is almost as beneficial with a cost of €4345/yr. The building for an initial life expectancy of 95 years, the scenario B19595, has a Life Cycle Total Cost per year of €4426/yr, which is higher than that of the scenario C19050 with an initial life expectancy of 50 and a final total life expectancy of 90 years.
A number of parametric studies were carried out, taking into account the same type of building for different times of construction (age) with technical energy characteristics, as shown in Table 4. From the Fig. (16), it can be seen that by deciding to execute the coalition B450-10050-100 (only an energy upgrade), 8 years after the building is constructed, the BBI index is computed to be lower compared to the case of executing the coalition C457-10750-100, for the whole range of the initial life expectancy of the building. This means that in this particular case, the choice of upgrading the building only in terms of energy is more cost-efficient than performing both structural and energy upgrading.
As shown in Fig. (17), the case study building that was constructed in 1980, with different time of construction but with the same energy consumption label, it appears that the GBGC index for coalitions A150-10050-100, A250-10050-100, A350-10050-100 and A450-10050-100 are identical. The reason is that the environmental footprint is not affected by the year; therefore, the footprint is the same for the building for all construction ages for coalition A.
| Α/Α | Year of Construction |
Heating COP |
Cooling EER |
Lamp type | Windows Uvalue (W/m2K) | Wall Uvalue (W/m2K) | Column Uvalue (W/m2K) | Roof Uvalue (W/m2K) |
|---|---|---|---|---|---|---|---|---|
| 1 | 1980 | 2.20 | 2.00 | Incandescence | 4.957 (Single Glass Panel Wooden Frame) | 1.763 | 3.367 | 4.419 |
| 2 | 1994 | 2.72 | 3.00 | Fluorescent | 6.1 (Single Glass Panel Aluminum Frame) | 1.763 | 3.367 | 4.419 |
| 3 | 2008 | 3.20 | 4.90 | Fluorescent | 4.1 (Double Glass Aluminum Frame) | 1.763 | 3.367 | 4.419 |
| 4 | 2013 | 3.90 | 5.50 | Led | 3.23 (Double Glazed Aluminum Thermal Insulating Frame) | 0.72 | 0.72 | 0.63 |
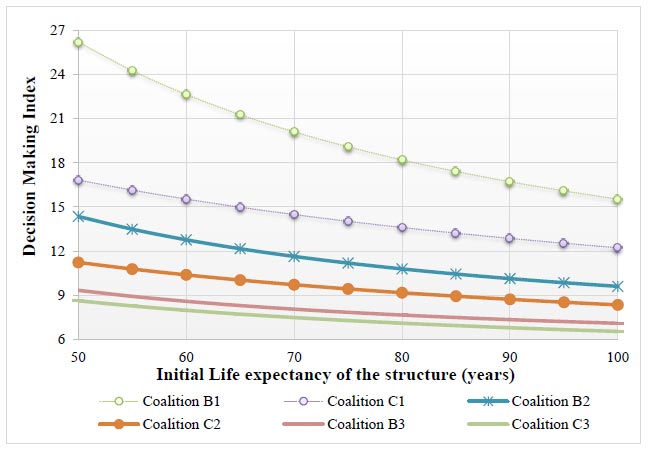
Conclusively, Fig. (18) shows the Decision-Making Index (DMI) for each coalition with technical characteristics, as shown in Table 4. As shown in Fig. (18), coalition C190-14050-100, improves the building compared to coalition B150-10050-100, coalition C276-12650-100 compared to coalition B250-10050-100, and coalition C362-11350-100 compared to coalition B350-10050-100. As shown in Fig. (18), as the time of construction is older, the interval between coalition B and C is getting bigger.
4.1. Parametric Analysis- Life Cycle footprint
Figs. (19-22) show for each coalition the effects on the Life cycle Structure Footprint CO2 of the three basic parameters that are related to the construction footprint. The parameters include all the materials that will be used in the construction of the existing building and for the energy and structural upgrade; thus, for each action, we calculated a bill of quantities for all actions for the CO2 Footprint:
- Existing Structure CO2 Footprint
- Energy Label Upgrade CO2 Footprint
- Structural Upgrade CO2 Footprint
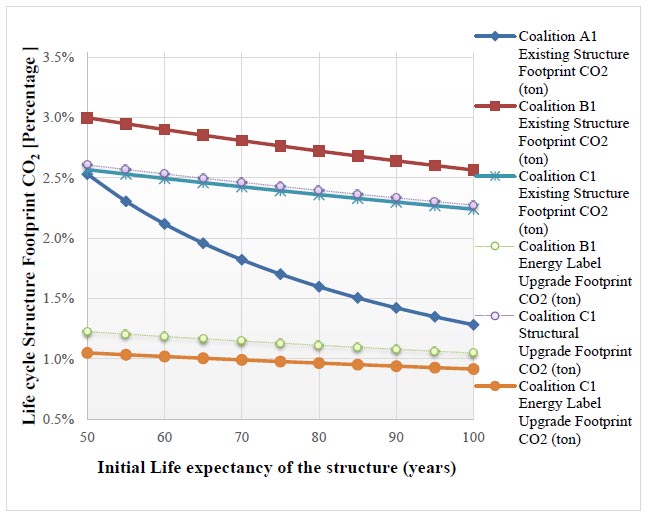
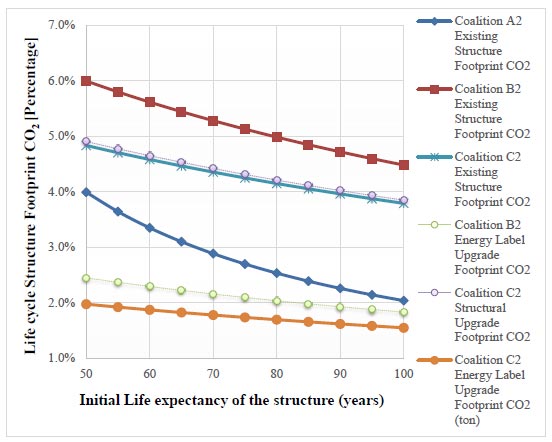
The first parameter, ‘Existing Structure CO2 Footprint’ for the building with construction time 1980, coalition A150-10050-100, presents a substantial decrease in relation to the increase of the initial life expectancy of the building. This is because the total energy consumption CO2 footprint for coalition A150-10050-100 is excessively higher than the initial structure CO2 footprint, as it is shown in Fig. (27); therefore, for each year of the building operation, the accumulated energy consumption reduces the percentage of the parameter ‘Existing structure CO2 footprint’ compared to the total footprint of the building. As a result, the parameter of the ‘Existing Structure CO2 Footprint’ for coalition A150-10050-100, has the largest change with the increasing life expectancy. The reason is the fact that the parameter of the building's energy consumption is significantly higher in coalition A150-10050-100 compared to those in coalitions B150-10050-100 and C190-14050-100. From Fig. (19), it can be observed that for coalitions, B150-10050-100 and C190-14050-100, the percentage reduction is smaller.
From Fig. (19), it can also be noted that the percentage of the reported parameter ‘Energy label upgrade footprint’ for coalition B150-10050-100, is smaller than that of a coalition C190-14050-100. This is because, for coalition C1, the total Life-cycle footprint CO2 includes the parameter ‘Structural Upgrade CO2 Footprint’. Also, Fig. (19) shows that the ‘Structural Upgrade CO2 Footprint’ for coalition C1 is not prohibitive for the total CO2 footprint of the building.
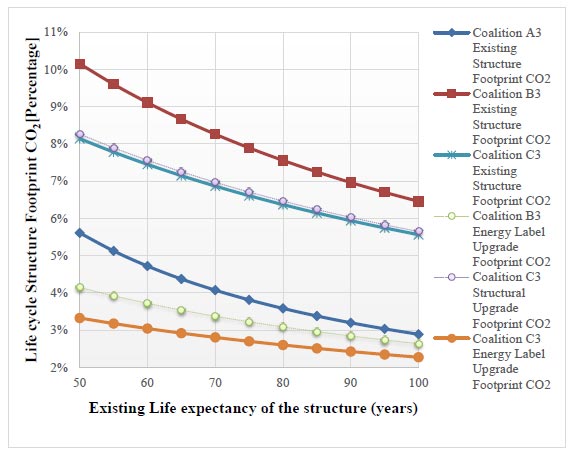
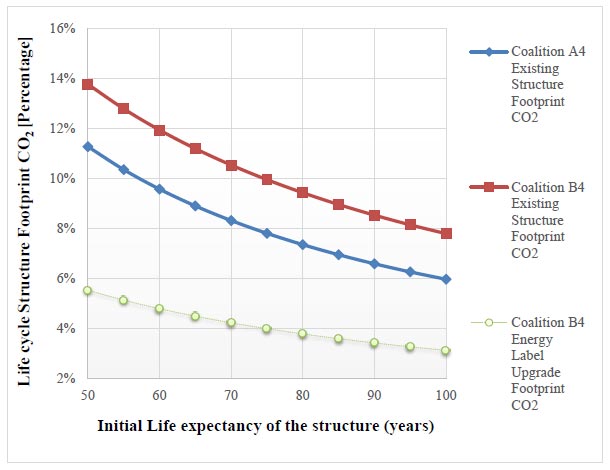
Correspondingly, for the parameter ‘Existing Structure CO2 Footprint,’ the coalitions A250-10050-100, A350-10050-100, and A450-10050-100, present similar results to those for coalition A550-10050-100. Comparing Figs. (19-22), the percentage for the parameters increases as the construction year increases. The cause is the total energy consumption CO2 footprint for the coalition A150-10050-100 is larger than that for coalition A250-10050-100, the one for coalition A250-10050-100 is larger than that of the coalition A350-10050-100 and the one for coalition A350-10050-100 is larger than that of coalition A450-10050-100. For coalitions B and C, the percentage reduction seems to be once more unimportant, and the percentage of the reported parameter ‘Energy label upgrade CO2 footprint’ for coalition B is reduced more than that of coalition C. The cause is again that the total Life Cycle footprint CO2 for coalition C includes the parameter of the ‘Structural Upgrade CO2 Footprint’.
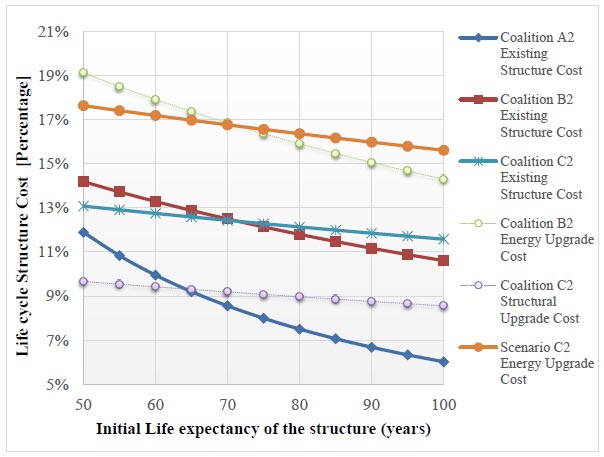
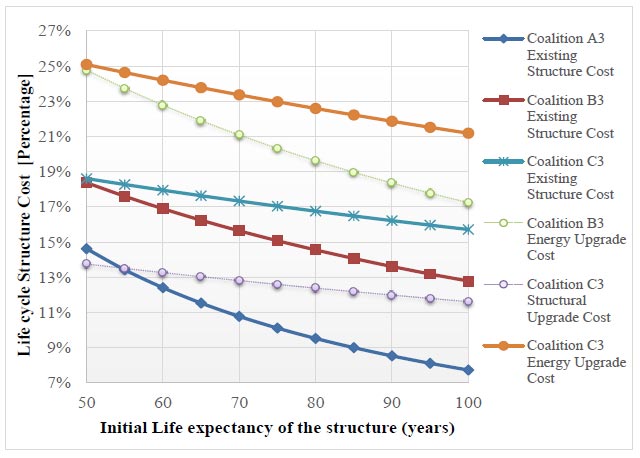
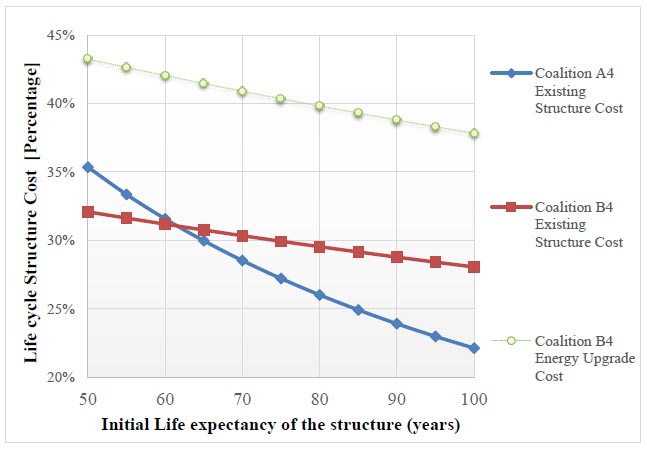
4.2. Parametric Analysis- Life Cycle Cost
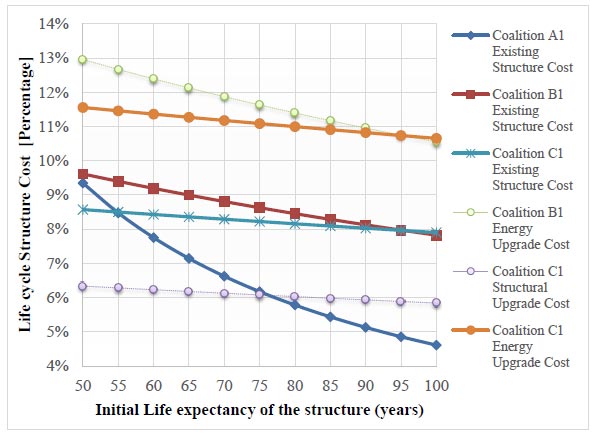
Figs. (23-26), show for each coalition the effects on the Life Cycle Structure Cost of the three basic parameters related to the construction cost. The parameters include all the materials that will be used in the construction of the existing building and for the energy and structural upgrade, thus for each action, we calculated a bill of quantities for all actions for the cost:
- Existing Structure Cost
- Energy Upgrade Cost
- Structural Upgrade Cost
From Fig. (23), the percentage of the parameter ‘Structural Upgrade Cost’ for the scenario C19050, represents 6.34% of the total cost of the building and is lower than the percentage of the parameter ‘Energy Upgrade Cost’, which is 11.56%, while the percentage cost of the parameter ‘Existing Structure Cost’ for the same scenario is 8.57%. Although identical energy upgrades have been made to coalitions B and C, the percentage cost of the parameter ‘Energy Upgrade Cost’ for scenario B15050 is greater than that for the scenario C19050 since the percentage cost of the structural upgrade is absent from the former. Also, it seems that the percentage of the cost of the parameter ‘Energy Label Upgrade’ for the scenario B19595 tends to be identical with the percentage of the scenario C113595. Also, it seems that the percentage of the cost of the parameter ‘Existing Structure Cost’ for the scenario B19595 tends to be identical with the percentage of the scenario C113595. This is because the decreasing percentage of the parameter ‘Existing Structure Cost’ of the life expectancy for coalition B1 is higher than that for coalition C1. Also, for coalition A1, it is observed that the percentage of the parameter ‘Existing Structure Cost’ decreases rapidly as the life expectancy increases. This is also confirmed in Fig. (27), where it is shown that the percentage of energy consumption increases as the life expectancy increases. Figs. (23-26) show intersections between coalitions B and C. As the time of construction for the existing building is newer, the intersections are getting earlier for the parameters ‘Energy Upgrade Cost’ and for the parameter ‘Existing Structure Cost’. In Fig. (23), the identical scenarios are B19595 with C113595. In Fig. (24), the scenarios B27070 with C211070 and in Fig. (25) the scenarios B35050 with C39050. In Fig. (26), there is an intersection between coalitions A4 and B4, only for the parameter ‘Existing Structure Cost’, specifically the identical scenarios are A46363 with B46363. Also, only in Fig. (23) there is a section for the coalition A and C for the parameter ‘Existing Structure Cost’ with scenarios A15555 with C19555. On the other hand, in Fig. (23) there is an intersection between the parameters ‘Structural Upgrade Cost’ and ‘Existing Structure Cost’ for scenarios A17777 with C117777C in Fig. (24) for scenarios A26565 with C210565, and in Fig. (25) for scenarios A35555 with C39555. As the time of construction for the existing building is newer, the intersections are getting earlier for the parameters ‘Structural Upgrade Cost’ and ‘Existing Structure Cost’. It is important to note that the intersection of coalitions reflects the age of the initial life expectancy of the structure. Beyond the specific age, the values will show which coalition offers the optimum results to the figure parameter.
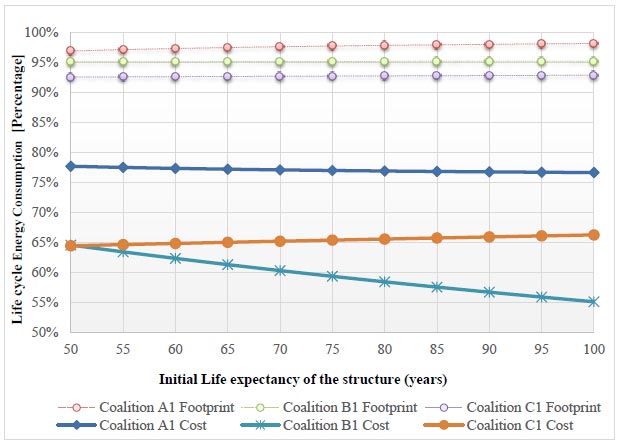
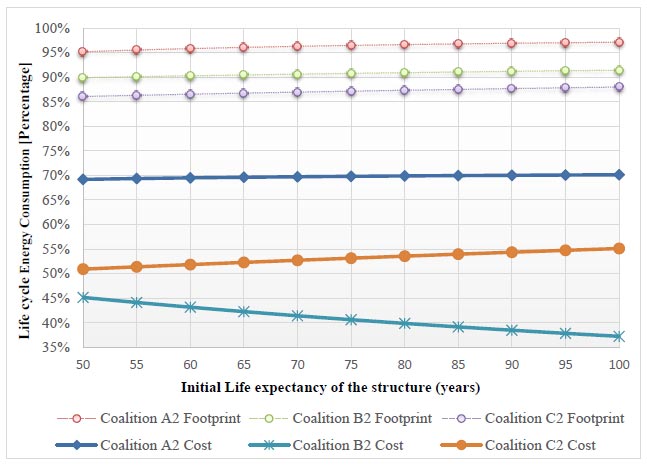
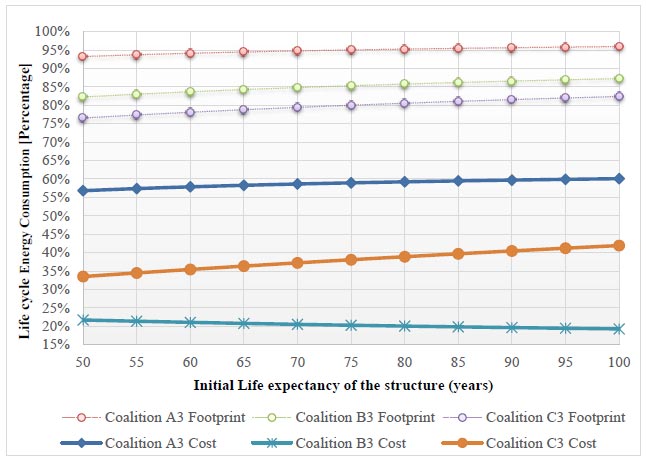
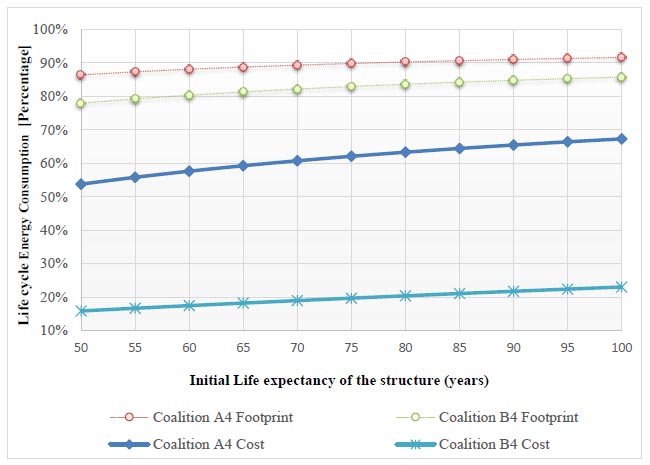
4.3. Parametric Analysis- Energy consumption footprint and cost
From Fig. (27), the scenario C19050, has the lowest percentage of 64.45% for the parameter ‘Energy consumption cost’ and scenario B15050 follows with a percentage of 64.57%. At the other end of the range scenario B1100100 has a percentage of 55.11%, and the scenario C1140100 follows with a percentage of 66.27%. Considering the parameter ‘Energy consumption footprint’, for the scenario A15050 it is 96,94%, and for the scenario A1100100 it is 98.20% of the Life cycle Structure CO2 footprint. This shows that the energy consumption footprint for coalition A1 is ample to reduce; furthermore, the percentage of the parameter of the initial structure footprint to the total footprint of the building, as the life expectancy of the structure is increasing. Also, from Fig. (27), the percentage for the parameter ‘Energy consumption cost’, has a noticeable increase in coalition C190-14050-100, compared to those in coalitions A150-10050-100 and B150-10050-100. For coalitions B150-10050-100 and C190-14050-100, the energy label upgrade has the effect of reducing the total energy consumption cost, but for coalition C190-14050-100 the extension of the final life expectancy is the reason for the energy consumption cost increase for the total life of the building. In Figs. (27-30), it can be observed that for all coalitions the percentage for the parameter ‘Energy consumption cost’ is decreased as the construction age of the existing building is reduced. Also, as the time of construction is newer, the technical energy characteristics based on the time of construction (age) of the building are different, as shown in Table 4. This is the reason that for the parameter ‘Energy consumption footprint’, the interval between coalitions B and A and coalitions C and A is getting bigger. Likewise, for the parameter ‘Energy consumption cost’, the percentage of the consumption cost, as the time of construction is newer, is reduced for all coalitions. Specifically, for the parameter ‘Energy consumption cost’, the interval between coalitions B and A is getting bigger compared to that of coalition C and A. ‘It is important to note that the intersection of coalition B and C reflects the age of the initial life expectancy of the structure. More specifically, in Fig. (27), the intersection of scenarios B15050 and C19050 shows that coalition B offers optimum results with regards to the parameter Life cycle energy Consumption Cost.’
Summarizing the above results, it can be concluded that from the three coalitions that can be applied to the existing building, coalition C appears to be the most efficient coalition. For coalition C, the scenario with the lowest initial life expectancy C19050 has the following results.
- Life Cycle CO2 Footprint 12.47 ton/year, which is 45.25% less than the scenario A15050 and 35.13% less than scenario B15050.
- Life Cycle total cost €4345 per year, which is 39.43% less than the scenario A15050 and 37.70% less than scenario B15050.
- Life Cycle Energy Consumption Cost € 2,801 per year, which is 49.76% less than scenario A15050 and 38.80% less than scenario B15050.
- Seismic Upgrade total cost (€) is €24,778, which is 6.4% of the Life Cycle Structure Total Cost (€).
- Scenarios C19050 and B15050 have Energy Consumption 83,46 kWh/m2/year, which is 91.70% less than scenario A15050.
In scenario C19050 the earthquake resistance upgrade CO2 Footprint is 29.26 (tons), which is 2.6% of the Life Cycle Structure Total CO2 Footprint, and the Energy Upgrade CO2 Footprint is 11.77 (tons), which is 1.22% of the Life Cycle Structure Total CO2 Footprint. Table 5 shows which coalition has the Maximum and the Minimum of the main parameters of the life cycle footprint of the building, which has been examined in the study.
| Main Parameters of the life cycle and life cost of the building | Maximum | Minimum |
|---|---|---|
| Life Cycle Footprint CO2 (ton) | Coalition A | Coalition C |
| Life Cycle Energy Consumption Cost/per year | Coalition A | Coalition C |
| Life Cycle Total Cost/per year | Coalition A | Coalition C |
| Energy Consumption kWh/m2/year | Coalition A | Coalition B, C |
CONCLUSION
The purpose of this study was to look into several scenarios using the approach of an integrated upgrade of an existing typical building, considering not only energy but also earthquake resistance upgrades. The study demonstrated that a longer life expectancy of operation/use substantially influences the structure positively. It is important to note that during the remaining life expectancy of the building, the structure will respond as it would be expected during a strong earthquake.
In order to achieve this goal, the CO2 footprint and total cost of the building were benchmarked between three coalitions and multiple scenarios. In the parametric analysis performed, the dynamic behavior of the structure has been shown to be substantially improved over the existing structure and the ‘Structural Upgrade CO2 Footprint’ and ‘Structural Upgrade Cost’ for coalition C are not prohibitive for the total CO2 footprint and total cost for the building. From the case study examined, it can be concluded that from the three coalitions that can be applied to the existing building, coalition C appears to be the optimum regarding CO2 footprint and cost.
The ultimate objective of the study is to create an evaluation of best practices of existing buildings, with the aim of designing and converting them into buildings with nearly zero energy consumption and, at the same time, ensuring an extended life expectancy through seismic upgrading. Comparing the integrated approach presented to other benchmark buildings or case studies is beyond the scope of the current study. For the specific case studied here, there is no data regarding other methodologies available in the literature to compare with. However, there are no limitations to applications of the methodology because, for every case study, the methodology can give a decision.
As the time of construction is newer, the building has a smaller Decision-Making Index (DMI) for all its coalitions. For an existing building, the option to remain in its original state (coalition A) without any upgrading intervention is not the most favorable option.
Therefore, the evaluation of the existing building stock and planning of the upgrade of the buildings in question is urgently needed. The proposed integrated approach provides a tool for this evaluation by considering the interaction and hierarchy of the upgrade actions that need to be considered in order to arrive at the most favorable solution for simultaneous energy and seismic upgrading.
Moreover, the future work using the proposed methodology will be directed at analyzing different building approaches for energy and seismic retrofitting so that we can make optimization across seismic and energy upgrade systems for different types of buildings, i.e., metallic, wooden, stone buildings, etc.
LIST OF ABBREVIATIONS
| DMI | = Decision-Making Index |
| LCA | = Life Cycle Analysis |
| ZEB | = Zero Energy Building |

