All published articles of this journal are available on ScienceDirect.

Experimental Investigation of Shear Strength for Steel Fibre Reinforced Concrete Beams
Authors Info & Affiliations
Abstract
Aims:
The aim of this paper is to investigate the influence of the volume fraction of fibres, the depth of the beam and the shear span-to-depth ratio on the shear strength of steel fibre reinforced concrete beams.
Background:
Concrete is a material widely used in structures, as it has high compressive strength and stiffness with low cost manufacturing. However, it presents low tensile strength and ductility. Therefore, through years various materials have been embedded inside it to improve its properties, one of which is steel fibres. Steel fibre reinforced concrete presents improved flexural, tensile, shear and torsional strength and post-cracking ductility.
Objective:
A better understanding of the shear performance of SFRC could lead to improved behaviour and higher safety of structures subject to high shear forces. Therefore, the influence of steel fibres on shear strength of reinforced concrete beams without transverse reinforcement is experimentally investigated.
Methods:
Eighteen concrete beams were constructed for this purpose and tested under monotonic four-point bending, six of which were made of plain concrete and twelve of SFRC. Two different aspect ratios of beams, steel fibres volume fractions and shear span-to-depth ratios were selected.
Results:
During the experimental tests, the ultimate loading, deformation at the mid-span, propagation of cracks and failure mode were detected. From the tests, it was shown that SFRC beams with high volume fractions of fibres exhibited an increased shear capacity.
Conclusion:
The addition of steel fibres resulted in a slight increase of the compressive strength and a significant increase in the tensile strength of concrete and shear resistance capacity of the beam. Moreover, these beams exhibit a more ductile behaviour. Empirical relations predicting the shear strength capacity of fibre reinforced concrete beams were revised and applied successfully to verify the experimental results obtained in this study.
1. INTRODUCTION
The use of fibres as reinforcement of construction materials goes back thousands of years ago to ancient civilizations. Concrete is a material widely used in structures, as it has high compressive strength and stiffness with low cost manufacturing. However, it presents low tensile strength and ductility. Therefore, through the years various materials have been embedded inside it to improve its properties. In the last few years, addition of fibres in fresh concrete to improve its characteristics was extensively studied and recognised by several codes and standards [1-4]. Different types of fibres have been used, such as steel, carbon, glass, synthetic and cellulose fibres. Each type has a different cost and influence on concrete mechanical properties [3, 5, 6]. Mixtures of different types and/or sizes of fibres can also be used in various engineering structures [7-10]. The properties of fibre reinforced concrete depend on the characteristics of the constituent materials, the volume fraction and the mechanical properties of fibres, the mechanical properties of concrete matrix and the bond between fibres and concrete matrix. Moreover, anisotropic fibre distribution may eventually affect the properties of FRC.
Steel fibres were commercially applied for concrete during the 70’s, particularly in Europe, USA and Japan [1]. One of the most common utilization of Steel Fibre Reinforced Concrete (SFRC) is in paving applications, used in airports, highways, bridge decks, slabs on grade and industrial floors. Furthermore, SFRC has been successfully used in piles, tunnel linings, precast elements and structures in seismic regions, among others. Fib Model Code 2010 [2] and ACI-318-11 [4] consider the possibility of assigning a proportion of shear resistance capacity to the fibres. Many experimental studies for beams with different dimensions, mix-designs, type, length and volume fraction length of fibres, shear-to-effective depth ratios have shown that SFRC has improved flexural, tensile, shear and torsional strength and post-cracking ductility [5, 11-38]. Moreover, SFRC beams exhibit higher resistance to cracking and against spalling, higher durability and improved behaviour under fatigue and impact.
Based on the available experimental data, it has been shown that the shear capacity of SFRC beams without transverse reinforcement depends mainly upon the shear span-to-depth ratio (a/d), the type and the volume fraction vf of the fibres, the compressive strength of concrete fc, the ratio of the longitudinal reinforcement ρl, and the beams’ geometry [11, 15, 28, 39-41]. Several researchers have proposed empirical equations for the prediction of the shear resistance capacity of Fibre Reinforced Concrete beams (FRC), based on test results [11-13, 17, 24, 42-44], while others used machine learning techniques, like appropriately trained Artificial Neural Networks for the prediction [40, 45-52]. Furthermore, several researchers have developed theoretical models for the prediction of the tensile strength and shear behaviour of steel fibre reinforced concrete members [53, 54] and others have performed numerical analysis using finite element software [55-63].
Fibres usually slip without failing in tension. Activation of fibres starts when micro-cracks are formed in concrete, which presupposes debonding and pulling out of the randomly distributed steel fibres. Steel fibres transfer the tensile stresses across crack surfaces and provide significant resistance to shear across the developing cracks. The main advantage of adding steel fibres in concrete is that they induce a post-cracking residual tensile strength in combination with a large tensile strain, thus SFRC attains substantial ductility, energy dissipation and toughness [14, 27, 64]. Although the addition of fibres modifies the mechanical properties of concrete, elastic properties and compressive strength are not significantly affected by fibres, unless a high percentage of fibres is used [2].
The aim of this paper is to investigate the influence of the volume fraction, vf, of fibres, the depth of the beam and the shear span-to-depth ratio (a/d) on the shear strength of SFRC beams. The results of this experimental study on SFRC beams were obtained by testing eighteen concrete beams, six of which were made of plain concrete and twelve of SFRC. Two different geometries with various heights of 15 cm and 20 cm, two volume fractions, vf, of 0.6% and 1.2% and two shear span-to-depth ratios, a/d, of 0.8 and 2.5 were selected. No stirrups were included in the beams. The experimental results obtained were compared with calculating results of shear prediction equations. Thus, a better understanding of the shear performance of SFRC could lead to improved behaviour and higher safety of structures subject to high shear forces. The experimental results of this study contribute to investigating and understanding the behaviour of SFRC beams. For this purpose, two empirical relations were chosen, as more appropriate, from the literature and revised applying linear regression analysis, in order to establish and verify the experimental data of this paper.
2. EXPERIMENTAL PROGRAM
To investigate the influence of fibres on the mechanical behaviour of concrete beams, two groups of specimens were constructed in Civil Engineering Structures Laboratory and tested under monotonic four-point bending loading. Each group of specimens consisted of nine RC beams, nine cubes and six cylinders. In total, eighteen concrete beams, eighteen cubes and twelve cylinders were tested. The main parameters considered in this study were the volume fraction of fibre contents in the beams and the shear span-to-depth ratio, being equal to 0.6%, 1.2% and 0.8, 2.5, respectively.
2.1. Constituent Materials of SFRC
Nominal concrete mix was selected according to C16/20 concrete type mixture supported by Lafarge Co., which kindly provided it. The constituent materials used in test specimens are shown in Table 1. The cement used was CEM IV / B (P-W) 32.5 R, which was based on Portland clinker mixed with cementitious materials and was supplied by Lafarge Co. According to EN 197-1 [65], CEM IV / B (P-W) 32.5 R is a Pozzolanic cement with strength category 32.5 R (high early strength). CEM IV / B (P-W) 32.5 R conforms to the requirements of EN 197-1 [65]. Crushed limestone aggregates were used with a grading determined from the concrete mixed. The maximum size of aggregates was 16 mm. A concrete plasticizer (Plastiment 20r of Sika Co.) was added to increase the workability of concrete. It has a density of 1.16 kg/l at 20 οC and pH equal to 8.0-11.0 at 20 οC. The water to concrete ratio was selected to be 0.7.
8 mm diameter grade B500c reinforcement bars and 6 mm diameter grade B500c stainless steel rebars were used as longitudinal reinforcement and supplied by SIDENOR Co. Uniaxial tensile tests made on the rebars with a tension Galdabini machine of Laboratory, showed a high yielding stress of 575-615 MPa and ultimate stress of 680-725 MPa for 8 mm diameter rebars, whereas yielding stress of 359-408 MPa and ultimate stress of 435-450 MPa was evaluated for 6 mm diameter rebars, respectively.
| Material | Mass (kg/m3) |
| Coarse aggregate | 760 |
| Fine aggregate | 1080 |
| Cement | 270 |
| Water | 190 |
| Plasticizer | 1.08 |
| Fibres 0.6% | 47.1 |
| Fibres 1.2% | 94.2 |
Hooked steel fibres were used in beams and supplied by SIDENOR Co., according to technical standard ASTM A820-01 and EN 10016. The steel fibres are 60 mm long with a hooked end and have 1 mm diameter, attaining a tensile strength of 1100MPa and density of 7.85g/cm3.
The concrete-fibre mixtures were prepared by gradually adding fibres randomly to the fresh concrete during the mixing process. By mixing the materials, fibres were continuously added to plain concrete admixture, until the desirable volume percentage of fibres was reached. The homogeneity of the mix was visually considered. The specimens were casted and consolidated by rodding. After curing for 28 days the specimens were ready to be tested.
2.2. Test Specimens
Two groups of specimens were constructed in the Laboratory and tested under monotonic four-point bending loading (Fig. 1). In the first group of beams, the cross section of the beams was 100 mm wide and 150 mm high and the length of the beams tested was 1100 mm with an effective span of 1000 mm. In the second group of beams, the cross section of the beams was 100 mm wide and 200 mm high and the length of these beams tested was 1100 mm with an effective span of 1000 mm. The dimensions of beams selected to be b/h/L = 100/150/1100 mm and 100/200/1100 form the proportion 1:1.5:11 and 1:2:11 and the beams, in this way, could approximately be considered as small-scale models of real geometry beams without scaling effect phenomena. The longitudinal tensile reinforcement was two rebars of 8 mm diameter and the compression reinforcement was two stainless steel rebars of 6 mm diameter. No transverse reinforcement was used, except one stirrup at each end to restrain the longitudinal reinforcement. The beams geometry and reinforcement details are shown in Fig. (1).
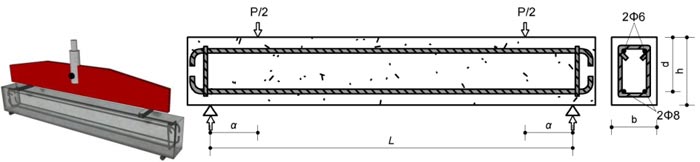
The beams were simply supported over an effective span of L = 1000 mm and subject to a monotonic four-point bending loading. The loading was applied stepwise through a 200 KN capacity servo-hydraulic machine in a force-controlled mode at the centre of a stiffened spreader trapezoidal beam, which in turn distributed the load equally on a couple of identical bearing pads placed on the top of the beams (Fig. 1). Two different shear span-to-depth ratios, a/d, were selected, equal to 0.8 and 2.5.
Cubic specimens of 150 mm edge were tested in compression to calculate the compressive strength of the concrete. Tensile splitting strength was evaluated by cylinder specimens having 150 mm diameter and 300 mm height. All specimens were tested after 28 days of hardening process.
Each of the two groups of specimens with aspect ratio of 0.8 and 2.5 consists of
(a) Three RC beams with volume fraction vf = 0% and three cubes
(b) Three RC beams with volume fraction vf = 0.6%, three cubes and three cylinders
(c) Three RC beams with volume fraction vf = 1.2%, three cubes and three cylinders
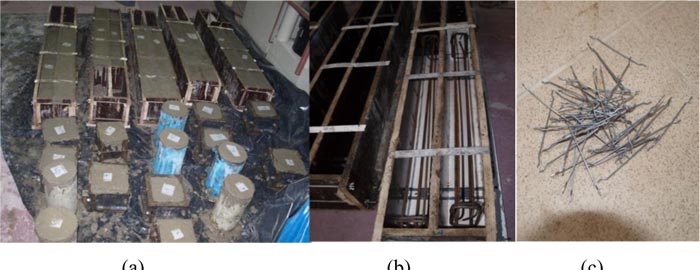
Fig. (2) illustrates beam, cubic and cylinder specimens, formwork with reinforcement and steel fibres used.
3. EXPERIMENTAL RESULTS FOR COMPRESSIVE AND TENSILE SPLITTING STRENGTH OF CONCRETE
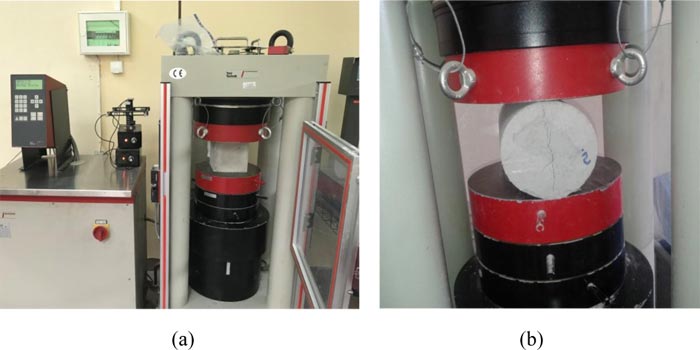
Nine 150 mm side cubic specimens were tested in compression on the 30th day (i.e. 2 days after curing and removing their humidity) to calculate the compressive strength of concrete (Fig. 3a) according to EN 12390-3:2019 [66] and six 150 mm diameter and 300 mm height cylinder specimens were tested in tensile splitting (Fig. 3b), according to EN 12390-6:2019 [67]. A ToniTROL compression testing machine was used for both compression and tensile splitting tests.
The 28-days cubic compressive strength fc,cube,28 of plain and steel fibre reinforced concrete, depending on the mixture and the volume fraction of fibres, are illustrated in Table 2. Moreover, splitting tensile strength for each cylinder is shown in Table 3. The maximum applied loading at failure evaluated experimentally for cylinders subject to splitting provides the tensile strength as follows Eq. (1):
 |
(1) |
Where σ is the splitting tensile strength of concrete, F is the maximum applied loading, d is the diameter of the cylinder and l is its height.
| Specimen | Mixture | Vf (%) | P (kN) | fc,cube,28 (ΜPa) | Mean compressive stress fc,cube,28 (MPa) |
| Cube 1 | 1 | 0.0 | 647 | 28.76 | 29.16 |
| Cube 2 | 1 | 0.0 | 665 | 29.56 | |
| Cube 3 | 4 | 0.0 | 663 | 29.47 | 28.96 |
| Cube 4 | 4 | 0.0 | 640 | 28.44 | |
| Cube 5 | 7 | 0.0 | 814 | 36.18 | 36.20 |
| Cube 6 | 7 | 0.0 | 815 | 36.22 | |
| Cube 7 | 2 | 0.6 | 690 | 30.67 | 31.33 |
| Cube 8 | 2 | 0.6 | 720 | 32.00 | |
| Cube 9 | 5 | 0.6 | 677 | 30.09 | 30.00 |
| Cube 10 | 5 | 0.6 | 673 | 29.91 | |
| Cube 11 | 8 | 0.6 | 683 | 30.36 | 30.31 |
| Cube 12 | 8 | 0.6 | 681 | 30.27 | |
| Cube 13 | 3 | 1.2 | 672 | 29.87 | 30.98 |
| Cube 14 | 3 | 1.2 | 722 | 32.09 | |
| Cube 15 | 6 | 1.2 | 697 | 30.98 | 30.60 |
| Cube 16 | 6 | 1.2 | 680 | 30.22 | |
| Cube 17 | 9 | 1.2 | 722 | 32.09 | 31.87 |
| Cube 18 | 9 | 1.2 | 712 | 31.64 |
No significant increase of the compressive strength, due to the addition of fibres, was observed. Similar conclusions verifying this observation were noted by several researchers [24-26, 28, 29, 31, 32]. On the contrary, a significant increase was detected in the tensile strength of concrete due to the amount of fibres (an increase of 15-30% in relation to the tensile strength of unreinforced cylinders was observed with an increase of 0.6% to the volume fraction of fibres), thus verifying the improvement of brittle behaviour of concrete to a more ductile. Mixture number 7 of plain concrete gave a slightly larger concrete compressive strength due to an increase of cement proportion at this concrete mixture.
| Specimen | Mixture # | Vf (%) | P (kN) | fct ,28 (ΜPa) | Mean tensile stress (MPa) |
| Cylinder 1 | 2 | 0.6 | 224 | 3.17 | 2.89 |
| Cylinder 2 | 2 | 0.6 | 185 | 2.62 | |
| Cylinder 3 | 5 | 0.6 | 199 | 2.82 | 2.70 |
| Cylinder 4 | 5 | 0.6 | 182 | 2.57 | |
| Cylinder 5 | 8 | 0.6 | 200 | 2.83 | 3.11 |
| Cylinder 6 | 8 | 0.6 | 240 | 3.40 | |
| Cylinder 7 | 3 | 1.2 | 275 | 3.89 | 4.00 |
| Cylinder 8 | 3 | 1.2 | 290 | 4.10 | |
| Cylinder 9 | 6 | 1.2 | 261 | 3.69 | 3.99 |
| Cylinder 10 | 6 | 1.2 | 303 | 4.29 | |
| Cylinder 11 | 9 | 1.2 | 312 | 4.41 | 4.18 |
| Cylinder 12 | 9 | 1.2 | 279 | 3.95 |
4. EXPERIMENTAL RESULTS
Two groups of beams (eighteen beams in total) were tested under monotonic four-point bending loading. Structural details of beams are illustrated in Table 4. vf is the fibre volume fraction, a/d is the shear span-to-effective depth, mix is the concrete mixture number, fc,cube is the mean cube compressive strength of concrete, fct is the mean tensile strength of concrete, Pmax is the maximum applied loading by testing machine, Vmax is the shear strength and vmax is the shear stress. Specimens were cured for a time interval of 28 days, their humidity was removed after 2 days and then subject to compression or tensile loadings.
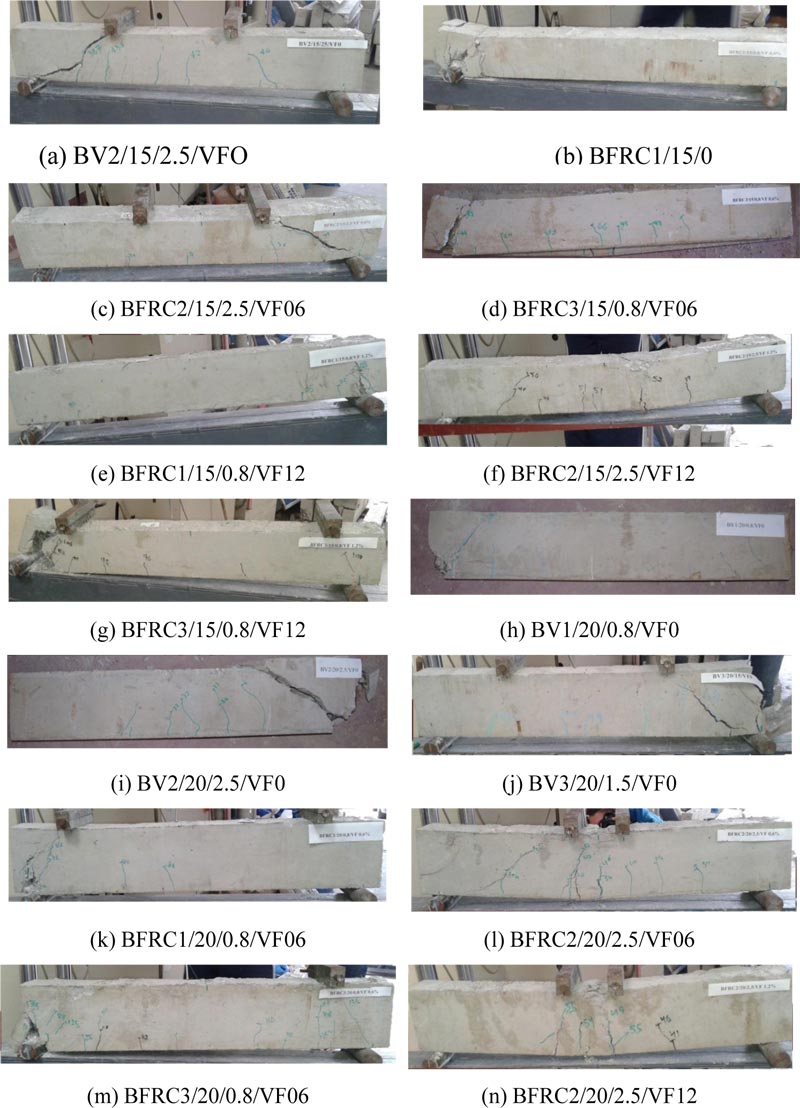
During tests, most beams failed in shear. Diagonal shear cracks nearby supports occurred in most cases, as is shown in Fig. (4). However, fibre reinforced concrete beams with high volume fraction of fibres and shear span-to-effective depth, a/d, equal to 2.5, presented flexural crack pattern (Figs. 4f and n), which finally led to concrete crushing failure.
| Test Beam Designation | b | h | d | L | vf | a | a/d | Mix | fc,cube | fct | Failure | Pmax | Vmax | vmax=V/bd | |
| (mm) | (mm) | (mm) | (mm) | (%) | (mm) | - | # | (MPa) | (MPa) | Type | (kN) | (kN) | (MPa) | ||
| Group 1 Specimens | |||||||||||||||
| BV1/15/0.8/VF0 | 100 | 165 | 135 | 1000 | 0 | 105 | 0.8 | 4 | 28.96 | shear | 65.28 | 32.64 | 2.51 | ||
| BV2/15/2.5/VF0 | 100 | 160 | 140 | 1000 | 0 | 325 | 2.5 | 7 | 36.20 | shear | 46.16 | 23.08 | 1.78 | ||
| BFRC1/15/0.8/VF06 | 100 | 154 | 130 | 1000 | 0.6 | 105 | 0.8 | 5 | 30.00 | 2.70 | shear | 106.55 | 53.28 | 4.10 | |
| BFRC2/15/2.5/VF06 | 100 | 155 | 135 | 1000 | 0.6 | 325 | 2.5 | 8 | 30.31 | 3.11 | shear | 47.29 | 23.65 | 1.82 | |
| BFRC3/15/0.8/VF06 | 100 | 155 | 130 | 1000 | 0.6 | 105 | 0.8 | 8 | 30.31 | 3.11 | shear | 85.43 | 42.72 | 3.29 | |
| BFRC1/15/0.8/VF12 | 100 | 155 | 130 | 1000 | 1.2 | 105 | 0.8 | 9 | 31.87 | 4.18 | shear | 106.98 | 53.49 | 4.11 | |
| BFRC2/15/2.5/VF12 | 100 | 158 | 138 | 1000 | 1.2 | 325 | 2.5 | 9 | 31.87 | 4.18 | shear/fl | 53.28 | 26.64 | 2.05 | |
| BFRC3/15/0.8/VF12 | 100 | 153 | 130 | 1000 | 1.2 | 105 | 0.8 | 6 | 30.60 | 3.99 | shear | 108.98 | 54.49 | 4.19 | |
| Group 2 Specimens | |||||||||||||||
| BV1/20/0.8/VF0 | 100 | 195 | 170 | 1000 | 0 | 136 | 0.8 | 1 | 29.16 | shear | 96.08 | 48.04 | 2.83 | ||
| BV2/20/2.5/VF0 | 100 | 200 | 170 | 1000 | 0 | 425 | 2.5 | 1 | 29.16 | shear | 37.20 | 18.60 | 1.09 | ||
| BV3/20/1.5/VF0 | 100 | 200 | 170 | 1000 | 0 | 255 | 1.5 | 4 | 28.96 | shear | 55.54 | 27.77 | 1.63 | ||
| BFRC1/20/0.8/VF06 | 100 | 200 | 170 | 1000 | 0.6 | 136 | 0.8 | 5 | 30.00 | 2.70 | shear | 85.30 | 42.65 | 2.51 | |
| BFRC2/20/2.5/VF06 | 100 | 205 | 170 | 1000 | 0.6 | 425 | 2.5 | 2 | 31.33 | 2.89 | shear/fl | 58.89 | 29.45 | 1.73 | |
| BFRC3/20/0.8/VF06 | 100 | 200 | 170 | 1000 | 0.6 | 136 | 0.8 | 2 | 31.33 | 2.89 | shear | 137.37 | 68.69 | 4.04 | |
| BFRC1/20/0.8/VF12 | 100 | 200 | 170 | 1000 | 1.2 | 136 | 0.8 | 6 | 30.60 | 3.99 | shear | 105.03 | 52.52 | 3.09 | |
| BFRC2/20/2.5/VF12 | 100 | 200 | 170 | 1000 | 1.2 | 425 | 2.5 | 3 | 30.98 | 4.00 | flexural | 56.93 | 28.47 | 1.67 | |
| BFRC3/20/0.8/VF12 | 100 | 200 | 170 | 1000 | 1.2 | 136 | 0.8 | 3 | 30.98 | 4.00 | shear | 105.68 | 52.84 | 3.11 | |
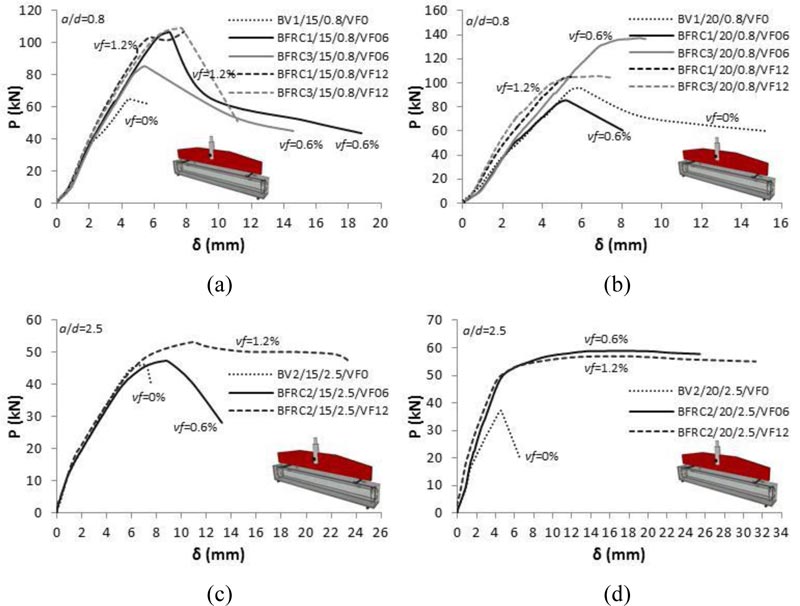
In Fig. (5) comparisons of loading vs deflection curves at mid-span are illustrated. Loading vs deflection curves for 150 mm high beams with a shear span-to-effective depth, a/d, ratio equal to 0.8 are shown in Fig. (5a). The ultimate loading of the plain concrete beam is equal to 65.28 kN for 4.4 mm displacement. SFRC beams with 0.6% volume fraction of steel fibres exhibit a significant increase (31% to 63%) of the ultimate loading due to the addition of 0.6% steel fibres. Further increase at an amount of 1.2% of fibre volume fraction results in about 65% increase of the ultimate loading, compared to the plain concrete beam. Moreover, the failure displacement of FRC beams is higher and these beams exhibit a more ductile behaviour compared to plain concrete beams. Similar results are obtained for beams having 200 mm height, although in one case, an unexpected drop on the ultimate loading was observed (Fig. 5b). Shear failure or concrete splitting occurred, at all cases, with diagonal cracks formed at the support to the applied loading.
(Fig 5c and 5d) illustrate loading vs deflection curves for beams having a height of 150 mm and 200 mm height beams, with a shear span-to-effective depth ratio, a/d, equal to 2.5, are shown, respectively. For 150 mm height beams, an increase of 2.5% on the ultimate loading is observed for 0.6% fibre volume fraction and 15% for 1.2% fibre volume fraction. Fibre concrete beam with 1.2% volume fraction exhibits a ductile flexural failure response. In case of beams having height of 200 mm, the increase in the ultimate loading is 58% and 53%, respectively. Both beams with 0.6% and 1.2% fibre volume fraction exhibit a ductile flexural failure response.
Fig. (6a) illustrates loading vs deflection curves for three plain concrete beams having height of 200 mm with shear span-to-effective depth ratios, a/d, equal to 0.8, 1.5 and 2.5. Beams with smaller values of a/d exhibit higher shear capacity than cases having higher values. Beams with smaller values of a/d (<2.5) act more as a deep beam and is easier for the shear to be transmitted directly to the support by means of a compression strut that would form between the two adjacent inclined shear cracks in the member. Similar results are depicted in Fig. (6b) for the three 200 mm height fibre concrete beams with 0.6% fibre volume fraction.
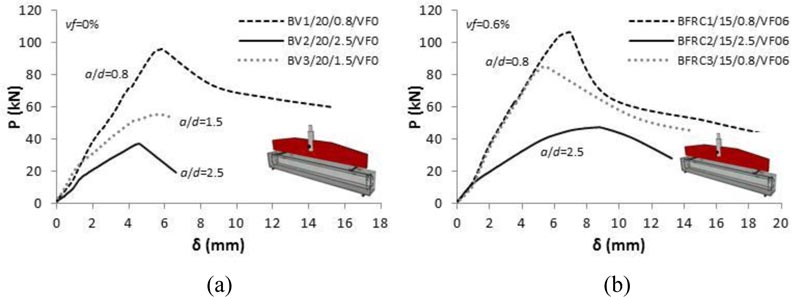
Finally, these figures also illustrate that RC beams 200 mm high have, in most cases, relatively increased shear capacity than beams 150 mm high. The depth of the beam has a significant role in the shear capacity, especially for beams without transverse reinforcement. A higher beam’s depth results in the formation of longer diagonal shear cracks at failure, which reduces the magnitude of the effective stresses to be transferred across the crack width. Consequently, a relatively higher force is needed to cause the failure in deep beams than in beams having a smaller inclined crack length (Singh 2016).
5. EMPIRICAL EQUATIONS FOR SHEAR STRENGTH
Several Codes and researchers have proposed empirical equations for the prediction of the shear capacity of SFRC beams with or without conventional shear reinforcement, based on experimental investigations. Since the 80s researchers have proposed equations for the prediction of shear stress at failure vu, most of which contain the fibre factor F, which depends on the fibre aspect ratio and the fibre volume fraction vf. Moreover, many of them contain the inverse of the shear span-to-depth ratio, a/d.
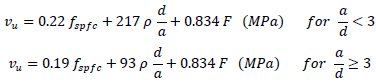
5.1. Sharma (1986) [12]
Sharma [12] proposed the following simple empirical equation, based on own test results for the prediction of the shear strength of steel fibre reinforced concrete beams Eq. (4).
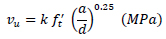 |
(2) |
Where: vu is the shear stress at failure in MPa, a is the shear span, d is the depth of the section, k = 1 if ft´ is obtained by direct tension test; k = 2/3 if ft´ is obtained by indirect tension test; and k = 4/9 if ft´ is obtained using modulus of rupture. ft´ is the tensile strength of steel fibre reinforced concrete.
5.2. Narayanan and Darwish (1987) [13]
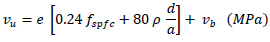
Narayanan and Darwish [13] proposed Eq. (3) for calculating the average shear stress at shear failure vu.
 |
(3) |
Where e is the arch action factor, equal to 1.0 for a/d ≥ 2.8 and 2.8d/a for a/d <2.8, fspfc is the split cylinder strength (MPa),  , fcuf is the cube strength of fibre concrete (MPa), ρ is the longitudinal reinforcement ratio, vb is the increase in shear stress due to the addition of steel fibres, vb = 0.41 τ F, τ is the average fibre matrix interfacial bond stress, assumed to be equal to 4.15 MPa, F is the fibre factor,
  , lf is the fibre length (mm), lf is the fibre diameter (mm), vf is the fibre volume fraction and Df is a bond factor, equal to 1.0 for hooked fibres.
5.3. Ashour, Hasanain and Wafa (1992) [68]
Ashour et al. [68] proposed Eq. (4) for the shear strength of SFRC beam. This empirical equation resulted from the modification of the ACI (ACI-544 1998) equation in order to account for the effect of shear span-to-depth ratio (a/d), the cylinder compressive strength of concrete (fc´), the fibre factor (F) and flexural reinforcement ratio (ρ).
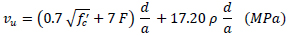 |
(4) |
5.4. Khuntia, Stojadinovic and Goel (1999) [69]
Khuntia et al. [69] proposed Eq. (5) for the shear strength prediction of fibre reinforced concrete beams.
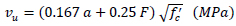 |
(5) |
where a = 1.0 for a/d ≥ 2.5 and 2.5d/a for a/d <2.5
5.5. Swamy, Jones and Chiam (1993) [70]
Swamy et al. [70] proposed Eq. (6) for the shear strength of fibre reinforced concrete beams.
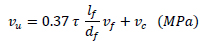 |
(6) |
where vc is the shear contribution of concrete. It is recommended to be calculated according to ACI Building Code (ACI-318-11 2011) given by Eq. (7)
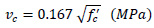 |
(7) |
5.6. Shin, Oh and Ghosh (1994) [71]
Shin et al. [71] proposed Eq. (8) for the shear strength of fibre reinforced concrete beams.
 |
(8) |
5.7. Kwak et al. (2002) [17]
Kwak et al. [17] proposed Eq. (9).
 |
(9) |
where e is the arch action factor, equal to 1.0 for a/d ≥ 3.4 and 3.4d/a for a/d <3.4, and vb = 0.41 τ F,
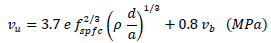
5.8. Slater, Moni and Alam (2012) [42]
Slater et al. [42] proposed different empirical equations for the shear strength of SFRC beams for shear span-to-depth ratio, a/d, smaller and larger than 3, for high and low concrete compressive strength and for hooked, plain or crimped fibres, using linear and nonlinear regression. Eq. (10) is for a/d < 3.0, low concrete compressive strength (20 MPa < fc´ < 50 MPa) and hooked fibres using non-linear regression analysis.
 |
(10) |
where F is the fibre factor,  .
.
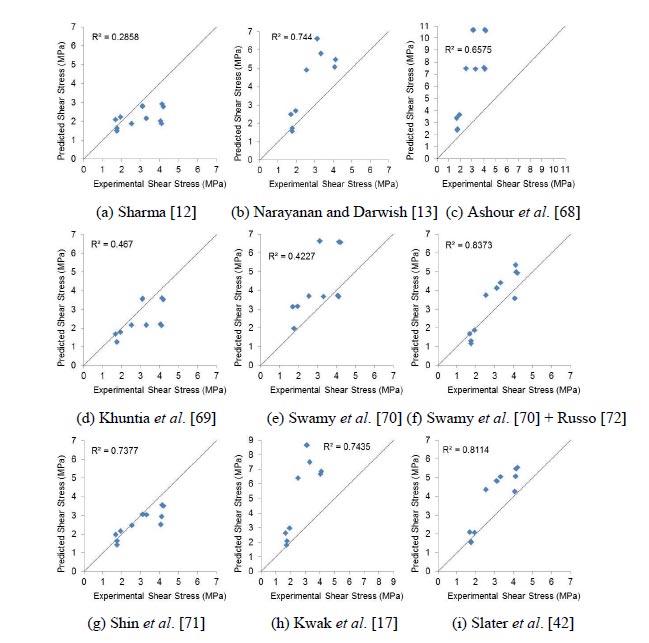
6. STATISTICAL ANALYSIS AND PROPOSED EQUATIONS
In Fig. (7) the experimental shear capacity of fibre reinforced concrete beams tested is plotted against their predicted shear capacity, vu, using the above written empirical equations. Statistical analysis was performed and the experimental to predicted shear strength ratio (Vexp/Vpred) was evaluated for each beam. The mean value of this ratio, the standard deviation and the coefficient of variation (COV) were evaluated and shown in Table 5, where the coefficient of determination (R2) and the mean absolute percentage error (MAPE) are also shown to determine the proximity of the theoretical results from the proposed empirical equations to the experimental results of the tested beams. An average shear strength ratio (Vexp/Vpred) close to 1 indicates an accurate prediction. A small value of standard deviation and coefficient of variation means that there is a smaller scatter in the results. The coefficient of determination (R2) was used to predict how reliable can be the proposed equations for predicting accurate future results. Finally, an important parameter is the mean absolute percentage error (MAPE), which is a measure of prediction accuracy of a forecasting method in statistics and is defined by the following equation:
| Model | Vexp/Vpred | R2 | MAPE (%) | ||
| Mean | Std Deviation | COV (%) | |||
| Sharma (1986) [12] | 1.324 | 0.399 | 30.14 | 0.26 | 25.0 |
| Narayanan and Darwish (1987) [13] | 0.678 | 0.190 | 28.08 | 0.74 | 59.36 |
| Ashour et al. (1992) [68] | 0.469 | 0.136 | 28.95 | 0.66 | 131.98 |
| Khuntia et al. (1999) [69] | 1.263 | 0.322 | 25.51 | 0.47 | 21.61 |
| Swamy et al. (1993) [70] | 0.735 | 0.213 | 29.03 | 0.42 | 50.69 |
| Swamy et al. (1993) [70] + Russo et al. (2005) [72] | 0.934 | 0.240 | 25.65 | 0.84 | 24.49 |
| Shin et al. (1994) [71] | 1.116 | 0.201 | 18.03 | 0.74 | 13.10 |
| Kwak et al. (2002) [17] | 0.555 | 0.179 | 32.25 | 0.74 | 97.82 |
| Slater et al. (2012) [42] | 0.804 | 0.169 | 20.96 | 0.81 | 32.59 |
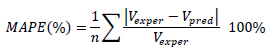 |
(11) |
where n is the number of the test specimens, Vexp is the experimental and Vpred the predicted shear strength.
Table 5 illustrates that Eq. (2) of Sharma [12] has the smaller coefficient of determinations R2 and the higher mean value of Vexp/Vpred, which shows an underestimation of shear strength. On the other hand, Eq. (4) of Ashour et al. [68] gave the smaller mean value of Vexp/Vpred, which shows an overestimation of shear strength and the higher value of MAPE = 131.98%. Swamy et al. [70] proposed an empirical equation for the shear contribution of the fibres and suggested that shear contribution of concrete, vc, should be calculated according to ACI Building Code [4]. This equation gave a low mean value of Vexp/Vpred equal to 0.74, a low R2 value 0.42, while the MAPE value was high (50.69%). On the other hand, if the concrete shear contribution of concrete, vc, is calculated according to Russo et al. [72] instead of ACI, then the results significantly improve. The mean value of Vexp/Vpred increases (0.93), R2 increases (0.84) and the MAPE value significantly decrease to 24.49%. In Fig. (7e) concrete shear contribution of concrete, vc, is calculated according to ACI Building Code [4], while in Fig. (7f) it is calculated according to Russo et al. [72], which gives significantly improved results. Equations of Khuntia et al. [69] and Slater et al. [42] give satisfactory results, with a MAPE value of 21.61% and 32.59%, respectively. On the contrary, equations (3) and (9) of Narayanan and Darwish [13] and Kwak et al. [17] didn’t predict accurate results. Finally, Table 5 shows that the empirical equation of Shin et al. [71] predicts the most accurate results with a mean value of Vexp/Vpred close to 1.0 (1.12), an R2 value of 0.74, the smallest coefficient of variation indicating a small scatter and the smallest MAPE value (13.10%).
7. DISCUSSION
Concrete is a material with low tensile strength and ductility. Fibres can be used to improve the behaviour of concrete at serviceability limit state, since they can reduce crack spacing and crack width, thereby improving its durability and at ultimate limit state, where they can partially or totally substitute conventional reinforcement and improve flexural, tensile, shear and torsional strength, post-cracking ductility and fatigue and impact resistance.
The aim of this study is to investigate the influence of the volume fraction of fibres and the shear span-to-depth ratio, a/d, on the shear strength of steel fibre reinforced concrete beams. The results of an experimental research on fibre reinforced concrete beams are presented. Eighteen concrete beams were made for this purpose and tested under monotonic four-point bending loading. Six of them were made from plain concrete and twelve were made from steel fibre reinforced concrete. Hooked steel fibres with two different volume fractions, vf, equal to 0.6% and 1.2%, were used. Moreover, two different shear span-to-depth ratios, a/d, were selected, equal to 0.8 and 2.5 and two different heights, equal to 150 and 200 mm, respectively. No stirrups were included in the beams. The conclusions derived from this study can be summarized as follows:
- The addition of steel fibres resulted in a slight increase of the compressive strength and a significant increase of the tensile strength of concrete, respectively.
- The addition of steel fibres resulted in an increase of up to 67% of the shear resistance capacity of the beam. Moreover, failure displacement of SFRC beams is higher and these beams exhibit a more ductile behaviour compared to plain concrete beams.
- Most beams failed in shear or concrete splitting with diagonal shear cracks from the loading to the support. SFRC beams with 1.2% fibres in volume fraction exhibited a ductile flexural failure instead of shear failure, verifying previous findings that the addition of steel fibres to RC beams is known that increase shear and flexural strengths and promote ductile behaviour when the fibre volume fraction is at least 1%.
- Beams characterised by smaller values of a/d exhibit higher shear capacity than beams having higher values. Beams having small values of a/d (<2.5) act mainly as a deep beam and is easier for the shear to be transmitted directly to the support by means of a compression strut, which would be formed between the two adjacent inclined shear cracks in the member.
- SFRC beams made with height equal to 200 mm attain, in most cases, relatively higher shear capacity compared to the capacity presented in beams having 150 mm height.
- Empirical equations were developed by several researchers in order to predict the shear strength capacity of fibre reinforced concrete beams. Some of these equations were used to predict the results of the tests performed in the present study and their accuracy was evaluated. One of the equations considered was proved to be satisfactorily accurate. The accuracy of these equations should be further studied against a larger test database.
CONCLUSION
In conclusion, the addition of steel fibres in concrete results in a significant increase of its tensile strength and an improved post-cracking stiffness and loading carrying capacity due to the fibre bridging effect at the crack surfaces, but fibre volume fraction should be at least 1% in order to have noteworthy improvement.
CONSENT FOR PUBLICATION
Not applicable.
AVAILABILITY OF DATA AND MATERIALS
All the data supporting the findings of the article are presented within the manuscript.
FUNDING
None.
CONFLICT OF INTEREST
The authors declare no conflict of interest, financial or otherwise.
ACKNOWLEDGEMENTS
The authors would like to thank:
(a) LAFARGE Co. for supplying the materials used in concrete mixtures (cement, aggregates etc.), SIDENOR Co. for supplying the reinforcement bars and the steel fibres and Sika Co. for plasticizer used.
(b) Students P. Milionis and J. Singh for executing tests, as part of their Graduate Thesis, in Civil Engineering Structures Laboratory at University of West Attica.

