All published articles of this journal are available on ScienceDirect.

Influence of Heterogeneity, Typology, and Contaminants of Recycled Aggregates on the Properties of Concrete
Authors Info & Affiliations
Abstract
Background:
The depletion of raw material resources, the preservation of the environment, and the need to compensate economic imbalances drive research efforts regarding the application of Construction and Demolition Waste (CDW) in concretes.
Objective:
This paper aimed to assess the influence of the heterogeneity, typology, and presence of contaminants of CDW (collected in different seasons and locations) on the mechanical properties and durability of concretes.
Methods:
Characterization procedures were performed for the aggregates (visual quantification and physical properties of the constituents), and for the concretes (compressive strength, splitting tensile strength test, modulus of elasticity, water absorption, porosity, electrical resistivity, carbonation depth, and digital microscopy). The replacement rate of natural aggregate for CDWA was of 20% in three different particle sizes: sand, gravel 0, and gravel 1.
Results:
The characteristics of the samples of CDW were very variable, influenced by the season and location of collection. The presence of materials with elevated porosity (ceramics, mortars) was observed in some samples and required increases in mixing water volume to keep the concretes’ consistency. A wide variation in mechanical properties caused by the CDWA constituents was also observed. Regarding the durability of the concretes, it was proven the greatest sensibility of this property to contaminants, thus requiring the removal of deleterious materials to using CDWA in structural concretes in order to avoid the formation of vesicles and guaranteeing their life span.
Conclusion:
The heterogeneity, typology and contaminant content significantly influence the analyzed properties. Besides, the segregation of waste at source makes the use of CDWA feasible in concretes.
1. INTRODUCTION
The number of researches dealing with alternative materials such as using construction waste in construction is increasing [1-3]. The main reasons that motivate these studies are the depletion of raw material resources, the preservation of the environment, and the need to compensate for economic imbalances with waste recycling [2, 3]. Given this situation, Carmo, Maia, and Cesar [4] demonstrated that a major part of construction and demolition waste materials in Brazilian cities is composed of ceramic materials, mostly generated in retrofits performed at private residences in the city. They emphasize that it is essential to improve the process of separating waste in recycling plants, and the construction waste management procedures with the purpose of minimizing the great variability of recycled aggregates [1-4].
Among the main factors that have hampered the reuse of Construction and Demolition Waste Aggregate (CDWA), are the presence of contaminating agents such as plaster, plastic, and expanded polystyrene; the high water absorption rate due to the porosity of CDWA [5-7]; the reduced compressive strength [8-10]; and the high heterogeneity [11, 12]. Nagataki et al. [13], for example, explained that the crushing process of CDWA influences the fractures in aggregates differently, varying according to the type of waste. The parts with the least strength tend to break faster, especially the adhered mortars [9, 10, 14]. The content of fine materials increases with the type of crushing process and number of stages, increasing the number of fractures and pores, and consequently reducing the quality of materials [9, 10].
The interdependence between mechanical strength of concretes and water absorption of the aggregates [ 15 ] is known. The pores found on the surface of the particles affect the adherence to the paste, exerting influences over many properties [15-18]. The insertion of high porosity aggregates may lead to reductions in concrete’s durability, thus requiring adjustments in mixture proportioning [15-19]. It is important to highlight that the water absorption capacity of the recycled aggregate and its heterogeneity have an influencing role in the aggregates and concretes properties, since these aggregates come from materials of different sources and qualities [11, 12, 20]. The replacement of natural aggregates for CDW, generates a loss of compressive strength in concretes as the replacement rate increases [14-16, 18, 21], mainly when the pre-saturation of the recycled aggregates is applied and use ceramic and mortar waste.
The durability of recycled concretes is conditioned mainly by the recycled aggregate's porosity and the cementitious matrix [22-24]. The strength of the waste that originated the aggregate, curing age, and the presence of mineral admixtures weres also determined by the content of recycled aggregate, w/c ratio [23, 25, 26]. The performance of recycled concretes tends to be inferior to that of conventional ones [23], as the electrical resistivity and carbonation that presents a trend of increasing the corrosion in concretes, influenced by the increase of the porosity, which comes from the mortar attached in the recycled aggregates [23, 25-27].
Therefore, the purpose of this study is to assess the influence of heterogeneity, typology, and the presence of contaminants of aggregates, produced from construction and demolition waste generated in Belo Horizonte city (Brazil), on concretes’ behavior. These wastes were collected in four city regions at two different times. The effects of the different CDWA on the mechanical and durability properties of concretes, considering a replacement rate of 20% of natural aggregates at three different particle sizes: Sand, Gravel 0 and Gravel 1 were analyzed.
2. MATERIALS AND METHODS
The Brazilian cement CP IV-40, equivalent to ASTM type IP, a type of cement extensively utilized in the metropolitan region of Belo Horizonte, was used in this experimental program, since its high content of mineral admixture makes it the most ecologically correct cement for concretes. Fine quartz aggregates (natural sand) together with gneiss coarse aggregates (gravel 0 - #. 4.75/12.5 mm and 1 - #. 9.5/12.5 mm), materials which available in the local market were also used. The utilized construction and demolition waste (material under study) was collected from four different locations in Belo Horizonte, and at two different times of the year (D - dry and R - rainy seasons) (Table 1). Those materials were generated in several places of Belo Horizonte city (Brazil) and collected in construction sites and streets. The 50 collected bags were crushed in a mobile jaw crusher in a single day, and taken to laboratories for characterization procedures. This crusher generated three different fractions of aggregate (sand, gravel 0, and gravel 1). The characteristics of those materials herein described referring to the portions that were used to obtain results and assessments (recycled aggregates), since the major objectives of this work were to evaluate the heterogeneity of the recycled aggregate and the variability of the different fractions sizes that were obtained from construction and demolition waste. The wastes were collected, crushed, and utilized without removing possible contaminants. The crushing process dispersing these contaminants and how they influenced the properties were evaluated.
First, the coarse recycled aggregates (gravel 1) were visually analyzed to identify the types of constituents (aggregates and contaminants) and evaluate their heterogeneity. Gravel 1 was chosen because it was possible to manually separate the material, and in the others (sand and gravel 0) the reduced size of the particles prevented this characterization of the waste. In the second process, a physical analysis was performed to identify the particle size distribution, maximum aggregate size (Dmax) and fineness modulus, according to NBR NM 248 [28] equivalent to ASTM C136; real density (ɣreal), following the NBR NM 53 [29] equivalent to ASTM C127; unit mass (ɣunit), considering the procedures of NBR NM 45 [30], equivalent to ASTM C29; clay content (Tc ), according to NBR 7218 [31], equivalent to ASTM C123; pulverulent material content (P.M.), considering the NBR NM 46 [32], equivalent to ASTM C117; water absorption (W.A.), following the procedures of NBR NM 30 [33], equivalent to ASTM C128 and shapes of grains (digital microscope).
Tests were performed to evaluate the characteristics of the concretes with a replacement rate of 20% (by mass) of conventional aggregates for CDWA in three different gradation ranges: sand, gravel 0, and gravel 1 (Table 1). The proportions were established to have a reference concrete of high workability (180 mm) and with compressive strength of 25 MPa, converging to proportion mixtures as presented in Table 2. The results were expressed as mean ± standard error. Despite the difference identified in the densities, it was decided to maintain proportion by mass to evaluate the influence on the water demand and closer to the common process in concrete dosing plants. It opted for greater fluidity to keep the concretes in a plastic consistency, even when using a recycled aggregate with high absorption capacity, and adopting a mechanical settlement by vibration.
| Terminology | Season of Collection | City Location |
|---|---|---|
| R1 | Rainy | North |
| R2 | East | |
| R3 | West | |
| R4 | South | |
| D1 | Dry | North |
| D2 | East | |
| D3 | West | |
| D4 | South |
| Terminology | Cement | Natural Sand |
CDWA Sand |
Gneiss Gravel 0 | CDWA Gravel 0 | Gneiss Gravel 1 | CDWA Gravel 1 |
Water |
|---|---|---|---|---|---|---|---|---|
| Ref. | 1.000 | 1.664 | - | 0.638 | - | 1.488 | - | 0.549 |
| Sand | 1.000 | 1.331 | 0.333 | 0.638 | - | 1.488 | - | 0.549 |
| Gravel 0 | 1.000 | 1.664 | - | 0.510 | 0.128 | 1.488 | - | 0.549 |
| Gravel 1 | 1.000 | 1.664 | - | 0.638 | - | 1.191 | 0.298 | 0.549 |
(Contaminant: Wood, Metals, Cotton waste, Porous stone, Expanded polystyrene, Plastic, Paper, Plaster, Other).
The evaluated properties of those mixtures were: workability (Slump Test) [34], mechanical properties at 28 days, such as compressive strength [35], splitting tensile strength [36] and elasticity modulus by forced resonance [37], and durability parameters such as mass density of hardened concrete, water absorption by immersion, water sorptivity and porosity [38], electrical resistivity [39], carbonation depth [40] and digital microscope images.
Compressive and splitting tensile strength tests were carried out in an EMIC press with a load application of 0.5 MPa/s and precision of the 0.5 kgf. The dynamic modulus of elasticity (Ed) was determined by forced resonance with the Erudite MKII Resonant Frequency Test System equipment. The carbonation test was made using a Thermo Fisher Scientific, RCO 3000 T-5 VBC model chamber. The dry condition specimens were kept for 55 days in the chamber under 100% humidity, 25ºC temperature, and 5% CO2. After 55 days, the samples were longitudinally sectioned and aspersions were made with a solution composed of 70% absolute alcohol, 29% distilled water and 1% phenolphthalein. Subsequently, a pachymeter of precision 0.01 mm was used to measure the four readings of each specimen surface. Specific gravity, water absorption, porosity. and water sorptivity were measured with a 0.001g precision balance. A 1000x digital microscope was also utilized to analyze surface images of concrete with and without waste to better express the behavior of the cementitious matrix and aggregates in these composites. Each test was performed in four cylindrical specimens of 10 centimeters in diameter and 20 centimeters in height.
3. RESULTS AND DISCUSSION
3.1. CDWA Constituents and Physical Properties
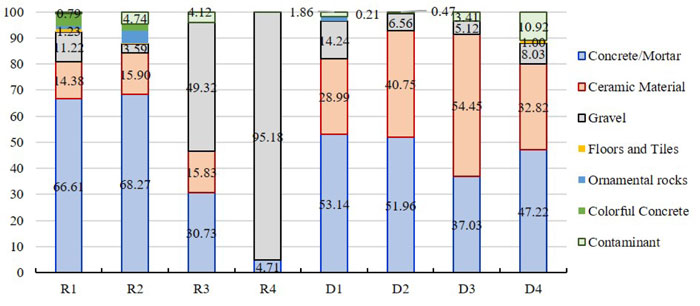
In Fig. (1), great variability was found in the samples with respect to both four different locations and different times of the year, thus corroborating the literature [5, 8]. A high percentage of ceramic materials was noted, ranging from 0% in sample R4 to 54.45% in sample D3, tending to reduce strength and increasing porosity [9], while also increasing water consumption and reducing consistency, mechanical strengths [8] and lifespan [19] of cementitious composites.
It is worth drawing attention (Fig. 2) to the presence of contaminant elements (wood, Styrofoam, plastic, paper, plaster, among others), similar to those found in literature [10, 41, 42]. These were found in small quantities in samples R1, R4, D1, D2 and D3, and in high contents in samples R2 (high content of white wood), R3 and mainly in D4 (8.37% of plaster).
Table 3 shows that the CDWA in each evaluated group (sand, gravel 0 and 1) has the same maximum aggregate dimension ( D max ) and close fineness modulus, besides they are practically within the same usability range, exhibiting a similar morphology. When analyzing the unit mass, a considerable variation was observed in recycled aggregates comparing to reference (natural aggregates), such as increases of 33.3% in R2 and R3 Gravel 0 and reduction of 18.4% in D4 sand (Fig. 3), due to higher levels of contaminants that tend to float in the crusher sieve and not be crushed.

(Other: nails, agglomerates, sawdust, among others)
| - | - | Ref. | R1 | R2 | R3 | R4 | D1 | D2 | D3 | D4 |
|---|---|---|---|---|---|---|---|---|---|---|
| Sand | Dmax (mm) | 4.78 | 4.78 | 4.78 | 4.78 | 4.78 | 4.78 | 4.78 | 4.78 | 4.78 |
| Fm | 2.19 | 2.37 | 1.99 | 2.03 | 1.74 | 2.11 | 2.04 | 2.00 | 1.93 | |
| Range | L.U. | Optim. | L.U. | L.U. | L.U. | L.U. | L.U. | L.U. | L.U. | |
| ɣunit (kg/l) | 1.47 | 1.30 | 1.29 | 1.24 | 1.39 | 1.28 | 1.24 | 1.27 | 1.20 | |
| ɣreal (kg/l) | 2.55 | 2.42 | 2.46 | 2.50 | 2.50 | 2.46 | 2.51 | 2.45 | 2.48 | |
| W.A. (%) | 3.96 | 5.83 | 9,64 | 10.15 | 3.35 | 12.30 | 15.27 | 17.31 | 13.66 | |
| CC (%) | 0.50 | 1.00 | 2.10 | 2.00 | 1.90 | 0.70 | 1.70 | 0.75 | 1.95 | |
| P.m. (%) | 4.00 | 10.92 | 9.36 | 8.96 | 11.99 | 9.10 | 15.61 | 17.32 | 19.66 | |
| Gravel 0 | Dmax (mm) | 12.5 | 9.50 | 9.50 | 9.50 | 9.50 | 9.50 | 9.50 | 9.50 | 9.50 |
| Fm | 6.55 | 5.08 | 5.34 | 5.44 | 5.45 | 5.46 | 5.52 | 5.48 | 5.48 | |
| ɣunit (kg/l) | 1.44 | 1.89 | 1.92 | 1.92 | 1.88 | 1.90 | 1.80 | 1.69 | 1.74 | |
| ɣreal (kg/l) | 2.68 | 2.37 | 2.45 | 2.37 | 2.56 | 2.43 | 2.33 | 2.33 | 2.28 | |
| W.A. (%) | 2.16 | 5.62 | 11.30 | 9.98 | 3.00 | 11.48 | 14.48 | 16.48 | 13.76 | |
| P.M. (%) | 0.41 | 3.42 | 9.14 | 4.32 | 5.18 | 3.62 | 1.94 | 3.74 | 4.10 | |
| Gravel 1 | Dmax (mm) | 19.0 | 12.5 | 19.0 | 19.0 | 12.5 | 12.5 | 12.5 | 12.5 | 12.5 |
| Fm | 6.93 | 6.45 | 6.28 | 6.50 | 6.61 | 6.55 | 6.51 | 6.50 | 6.39 | |
| ɣunit (kg/l) | 1.44 | 1.85 | 1.90 | 1.72 | 1.86 | 1.84 | 1.81 | 1.70 | 1.75 | |
| ɣreal (kg/l) | 2.68 | 2.32 | 2.30 | 2.46 | 2.48 | 2.81 | 2.28 | 2.35 | 2.17 | |
| W.A. (%) | 2.30 | 4.87 | 5.98 | 7.96 | 2.78 | 10.90 | 11.14 | 16.36 | 11.08 | |
| P.M. (%) | 0.19 | 6.44 | 9.60 | 8.58 | 7.18 | 1.50 | 12.00 | 0.90 | 1.10 |
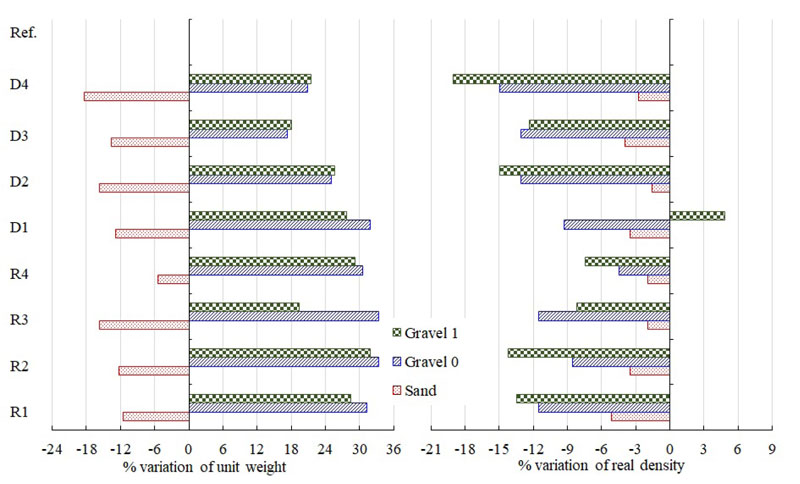
The real density (Fig. 3) of the recycled aggregates presented lower values than the reference ones (except D1 Gravel 1, 4.6% higher about Ref. Gravel 1), up to 19% lower for the D4 Gravel 1. As the densities are different, it is indicated to perform adjustments to the mix proportions regarding the volume of mixture [42, 43]. However, it was decided to maintain the ratio of the mixtures' mass to allow evaluating the influence on the water demand. It was also opted for a greater fluidity of the mixtures to keep the concretes in a plastic consistency, adopting a mechanical settlement by vibration.
The clay content in CDWA sands in the sample R2 was up to 4.2 times higher than in conventional materials due to the presence of more friable ceramic materials that were comminuted in the crushing process, thus maximizing the values of this content. A similar result was obtained with respect to pulverulent materials (3.0 times higher in sample R4), with values up to 19.66% found in the sample D4 (the maximum value that is allowed by NBR 7211 [44] is 3%). These fine materials can aid plasticity in concretes, although it increases the specific area and tends to demand more mixing water [45].
The recycled aggregates that were used in this study did not comply with the specifications of the Brazilian standard NBR 7211 [44] for water absorption of natural aggregate (<10%), reaching 15.27% in the D2 sand, just as was found in literature [41, 46] which led to increases in water content in the composite as the waste content was increased. Attention must be paid to the effect of water absorption on concrete properties, especially in increasing water consumption, reduction of consistency, and loss of mechanical properties.
3.2. Analysis of Properties of Proportion Mixtures with CDWA
This topic presents the found values with respect to the reference mixtures and all the replacement of aggregates (sand, grave l 0 and gravel 1) proposed. These were used to evaluate the effects produced by partial replacement of natural aggregate by the CDWA in structural concretes' properties. The charts were designed based on mean values ± standard error.
3.2.1. Workability
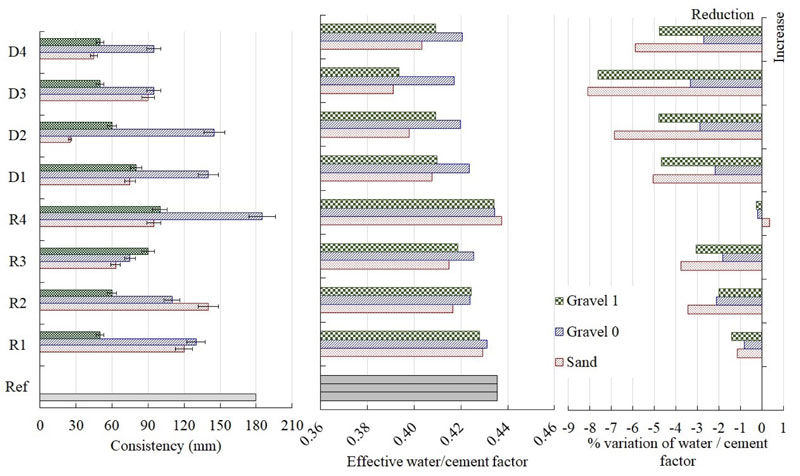
CDWA are, in general, more porous due to the content of ceramic materials and adhered mortars, thus altering the demand for water in the mixtures of concrete [47, 48]. The workability results (Fig. 4) of the mixtures of concretes with CDWA exhibit values lower than those of the reference mix, confirming that the CDWA tends to reduce concretes' workability. In this study, the CDWA were not pre-saturated, which directly influences the measurements of the concrete consistency [10]. González-Taboada et al. [7] point out that for using aggregates with high water absorption, a larger amount of water must be placed to compensate for this absorption, instead of pre-saturating them, which is a complicated activity to be carried out in production plants of concrete.
Most mixes with recycled aggregates showed a slump higher or equal to 90 mm, a plastic workability, attending the requirement shown in section 2. Some studies have presented techniques that could be applied to compensate for the lower plasticity of the other mixes (slump lower than 90 mm), such as insertion of a chemical admixture as a superplasticizer to solve the great reduction of the workability [15, 27, 49, 50]; removal of asphalt and clay-based wastes, and the fines of the recycled aggregate [51]; or use of supplementary cementitious materials such as fly ash or silica fume, that can also improve the mechanical behavior of the concretes with recycled aggregates [50].
The effective water/cement ratio of each mixture was calculated, and it was found that only in concrete with sands R4 present increase occurred (0.37% higher). On the other hand, concretes (D1, D2, D3, D4, R1, R2, R3) decreases occurred. Thus, it is believed that the crushing process proved to be influential in increasing the amount of porous and cracks in waste aggregates. In addition, it could be observed that the mixtures with the lowest reduction of the effective water/cement ratio were those with aggregates that were collected during rainy seasons (R type), which means that they may still present part of the absorbed rainwater.
The dried recycled aggregate was inserted at the end of the blend to absorb the cement paste, improving the attachment of the aggregate to the cementitious matrix, thus, maximizing the mechanical properties and reduce the surface porosity of the aggregates [52]. It is important to point out that the concrete slump test result that was found in the CDWA sample R4 for gravel 0 was 185 mm, i.e. 2.78% higher (statistically equal). It can be justified by the content of different materials in CDWA: 95.18% gravel, 4.71% cement, and 1% other materials, i.e. a large amount of low-porosity concrete waste, generating a reduction of this parameter.
Regarding the particle size of the replaced aggregate, they were observed to have a connection with the slump result. Five of the eight CDWA sample groups exhibited slumps of approximately 130 mm (R1, R2, R4, D1 and D2, in which gravel 0 was replaced). On the other hand, slumps of roughly 30 mm were observed in samples D1 and D3, in which it was found higher contents of ceramic materials and mortars that were adhered to gravel grains and consequently it increased the porosity and water absorption of these aggregates [48].
It is observed that the crushing process promoted a separation of the samples, in which it was noticed that the concrete and rock grains concentrated more in the range comprised by gravel 0, increasing the fluidity of the mixtures with the samples D1, D2, D3 and D4.
3.2.2. Water Sorptivity, Water Absorption by Immersion, and Porosity
Among the water sorptivity results obtained in mixtures with CDWA within sand gradation ranges (Fig. 5), two discrepant results were obtained in mixes with high contents of ceramic materials and mortars (increases of 52.2% comparing the reference mix to the samples D2 and D3). The other combinations exhibited values up to 23.5% lower (in case of D1) and 26.2% higher (in case of D3) of maximum variation. Even though sample D3 was mixed with the highest content of ceramic materials, it had the lowest final capillary water absorption coefficient (lower than in sample D2) (Fig. 6), which demonstrates that its pores are not interconnected, or are larger, which does not provide the rise of water by capillarity [53].
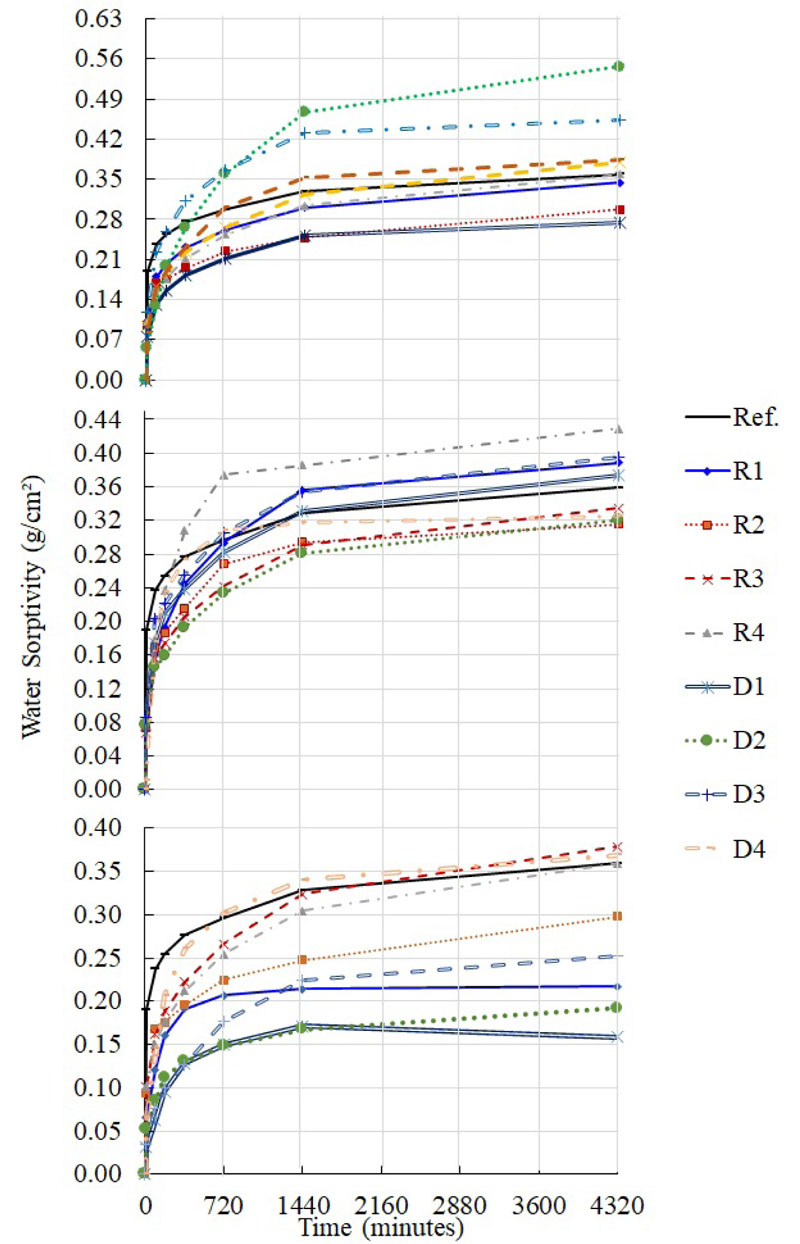
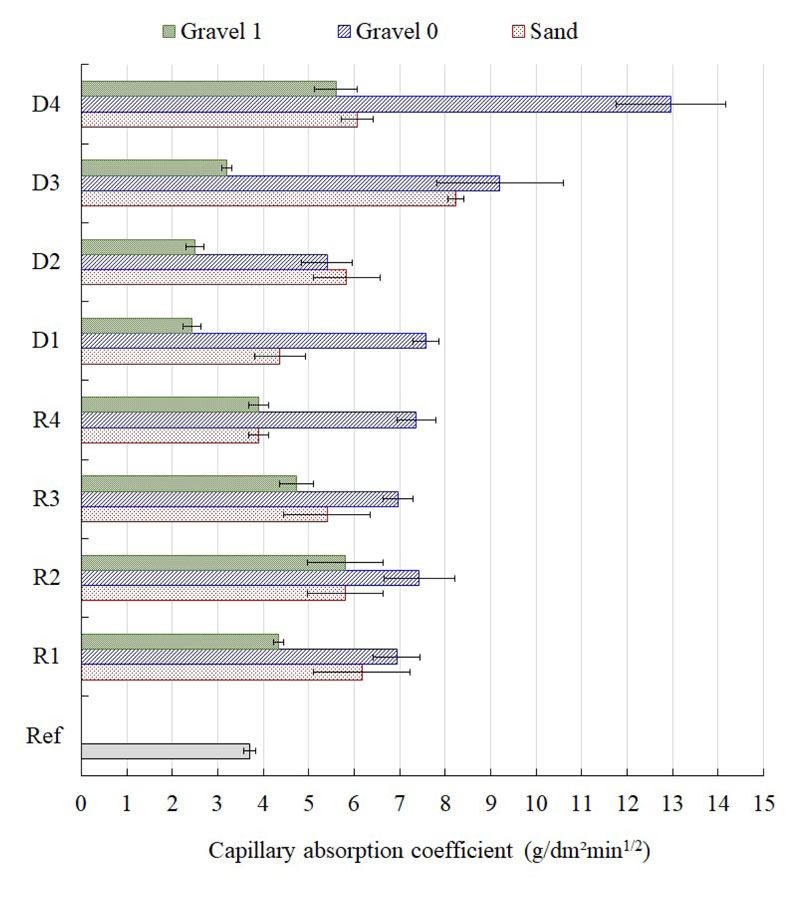
Different from the sand gradation CDWA, sample mixtures within the gravel 0 gradation range, showed more homogeneous results, exhibiting maximum variation of 12.2% lower (in R2), and 19.4% higher (in R4). It is important to point out that although R4 has a higher content of gravel (less porous), it has the highest capillary water absorption coefficient, demonstrating interconnectivity among its pores or that pores are small enough to provide absorption by capillarity [48].
The gravel 1 gradation range exhibited more outstanding results in all sample mixes, ranging from 5.4% lower (in R3), up to 55.8% higher (in D1). This variable reduction of this property is more associated with the arrangement of grains (packing), thus maximizing the pores' size and reducing the capillarity [54]. In Fig. (6), it can be seen that the mixtures with CDWA in gravel 0 gradation range, D3 and D4, were the ones that exhibited the highest capillarity coefficients (9.20 g/cm2 and 12.96 g/cm2, respectively), pointing out that D4 was the only mix statistically different in comparison with the reference sample (T-test).
It can be stated that the values of the capillary absorption coefficient regarding the concretes with sand replaced for CDWA materials exhibited a variation ranging from 5.4% to 122.5% higher than the reference values, thus demonstrating that the use of CDWA increased the conductivity in pores and the coefficient values of this property. The concrete utilizing the CDWA in gravel 0 gradation range was assessed following the same procedures and an even greater variation was observed in the capillary absorption (from 45.9% to 250.4% higher than reference samples), which demonstrated an increase in pore refinement due to a better grain distribution. On the other hand, the results of concretes with gravel 1 CDWA oscillated around the average from 34.2% lower to 56.8% higher when compared to the reference values. Comparing the composition (Table 3) and concrete workability (Fig. 1) with the capillary absorption coefficient (Fig. 6), the constitution of the construction and demolition wastes proved to influence these properties. Besides, it was observed that the wastes with more ceramic materials (Fig. 7) exhibited lower values of these properties when it does not exhibit higher gradation ranges [55].
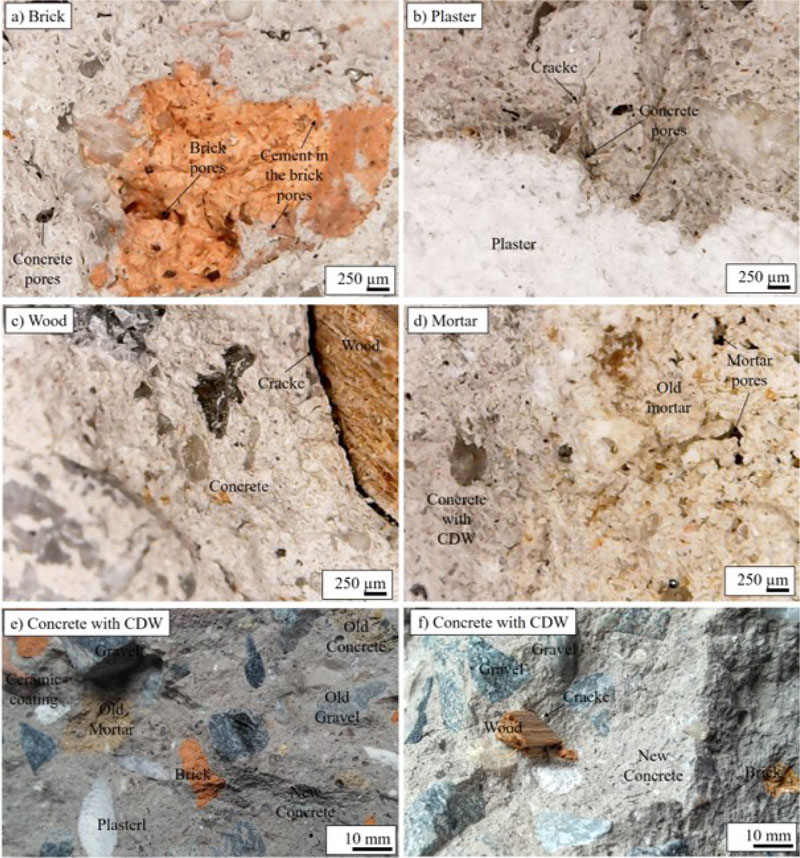
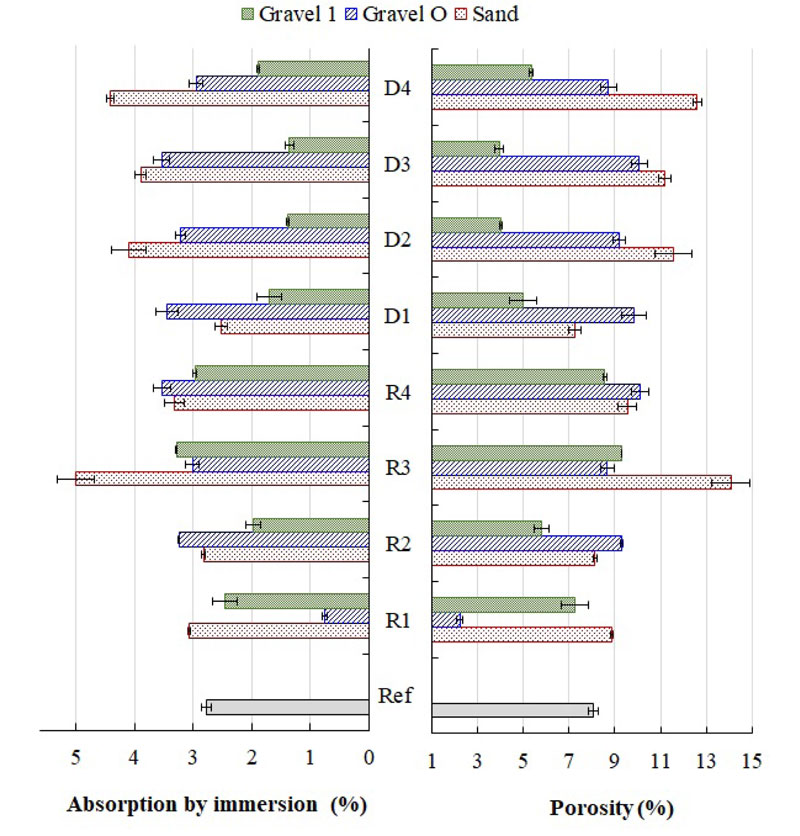
Many authors [12, 41, 53] associate the issue of porosity increase with the effective water/cement ratio. However, it is observed that this water absorbed by the recycled aggregate is subsequently released, aiding in curing the concrete and not resulting in a less porous and less absorbent matrix, as seen in Fig. (8). Another equally common idea in the papers is the suggestion of the aggregates' pre-saturation to reduce the effect of absorption. It is known that this condition is complex for practical construction activities in developing countries in order to guarantee adequate water consumption of concrete [8]. In this paper, it was chosen to insert the recycled aggregate in the mixer after all materials to allow it absorbing the cement paste and improving the fixation of the aggregate to the matrix and, thus, to maximize the mechanical properties and reduce the surface porosity of the aggregate. This result has been achieved, especially for the aggregates with bigger particles.
It was verified that most of the water absorption and porosity values are within the confidence interval for the reference mix (T-test), being thus statistically equal. It is important to pay attention to coefficients obtained with sample mixes R1 (gravel 0 gradation range), D2, D3 and D4 (gravel 1 gradation range), which exhibited lower values, and D4 (sand gradation range), which exhibited a higher value. A high content of ceramic materials (Fig. 7a) and adhered mortar (Fig. 7d) increased the rates of these propertiesincluding the activity of capillarity and continuity [53]. It can be observed that the absorption and porosity coefficient values tend to reduce when comparing gravel 1 and sand gradation ranges, the opposite to what was exposed by Nagataki et al. [13] who stated that porosity would be reduced in the crushing process. Thus, the finer the material, the less porous it is, demonstrated by Martín-Morales et al. [41] who stated that differences in water absorption in concrete were related to the absorption of the aggregate. It can be seen in Table 3 that the aggregates did not exhibit higher absorption (gravel 1 compared with gravel 0), and neither the concrete produced with these materials did.
In this study, it was worth noting that recycled aggregates should be the last material to be added to the mixer. Thus, this converged into the maintenance of porosity (in relation to the reference mix), justified by the presence of cement paste in the pores of the porous aggregates (Fig. 7a), maximizing the mechanical properties and reducing porosity and water absorption, as observed in the literature [56, 57].
The highest water absorption and porosity values were found in the proportion mix with a higher content of contaminant materials (Fig. 7b, c and f), such as in samples gravel 1 R3, D3 and D4. Fig. 7 (b and c) shows that plaster and wood materials absorb and release mixing water, consequently increasing the porosity around its particles. It is worth noting that wood decay might occur and, due to crushing and concrete casting processes, the plaster becomes powder when touched. Both materials converge toward vesicles and reduce the concrete lifespan. The other materials exhibited oscillations in water absorption in relation to the reference mix. These variations were from 10.1% lower to 74.1% higher (sand); from 72.4% lower to 25.2% higher (gravel 0); from 51.2% lower and 15.1% higher (gravel 1), due to the presence (increasing) or absence (reducing) of ceramic materials and greater (increasing) or little (reducing) quantities of fine materials [8].
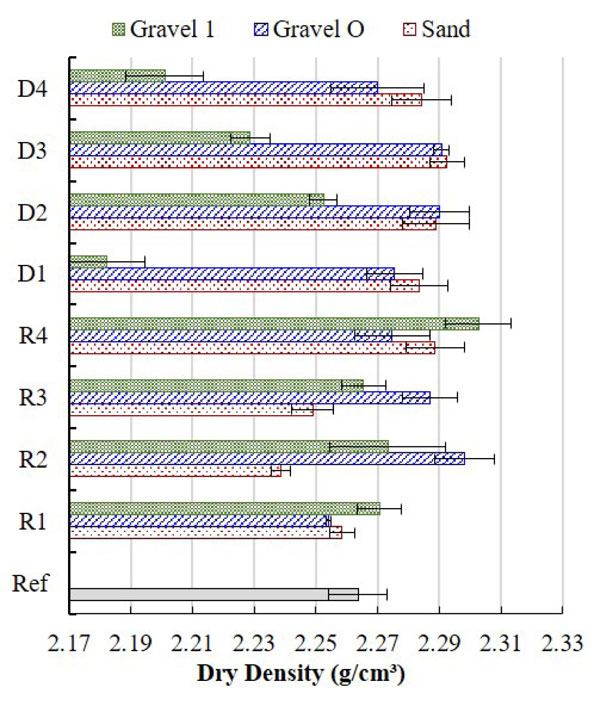
3.2.3. Dry Density
Dry densities, shown in Fig. (9), exhibited little variation with respect to the mixes (T-test) and those to the reference mix (less than 4%). Thus, it was verified that the percentage (20%) of natural aggregate replacements and the proximity of specific gravity of the construction and demolition wastes did not significantly impact this property. R2, R3, D2 and D3 gravel 0 gradation range mixes exhibited higher densities due to a better-quality packing [45] and to waste aggregate composed with high contents of gravel and concrete [8]. Thus, as can be seen in Bravo et al. [43], even the concretes with higher contents of clay and ceramic waste aggregate with lower density proved to be more influenced by the distribution of the particles than by their density.
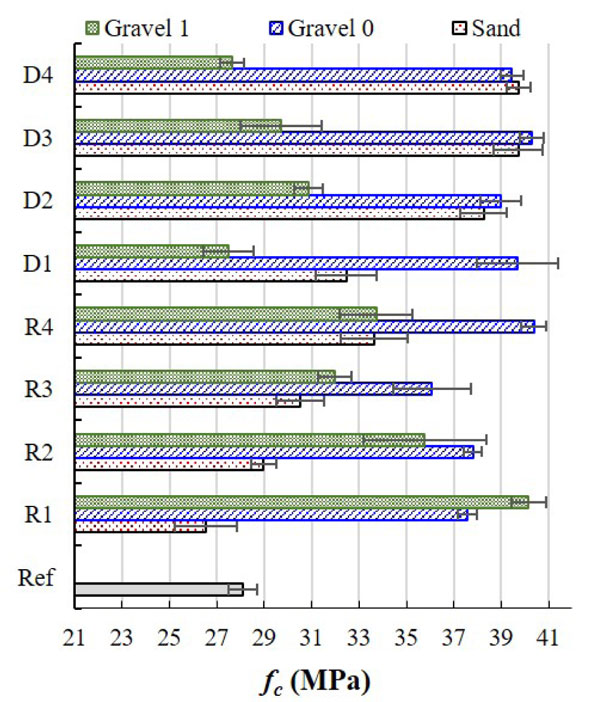
3.2.4. Compressive Strength
Fig. (10) shows the compressive strength (fc) test results performed on concretes with CDWA in different particle size range at 28 days. Regarding the sand gradation range, the concrete with R1 sand exhibits a compressive strength 5.5% lower than the reference mix. In contrast, all the other samples exhibited higher values, reaching values up to 41.4% higher than the reference mixes with D3 and D4. It can be observed that the high content of contaminants on D4 (8.59% higher than all others) did not hamper this property. In addition, the good packing of these particles (promoted by the high percentage of fine materials verified in recycled aggregates), the lower effective water/cement ratio (tending to increase the mechanical properties [54]) and the paste absorbed by the aggregate (closing some surface pores of the aggregate [52]), increased the structuration of the cement matrix, promoting greater compactness of concretes. The improvement of the concrete compactness increases the compressive strength of this material [13, 45].
Mixes proportion with CDWA in gravel 0 gradation range exhibited greater homogeneity in values regarding compressive strength. All values found are higher than that of the reference mix, with the lowest one being 33.8% higher than the reference sample (R1) and the highest 43.7% higher (R4). It is important to highlight that R4 has a higher content of gravel (less porous) and converged, as expected, towards higher fc values [58]. It can be stated that, according to the results obtained, gradation range gravel 0 demonstrated to be the most efficient replacement as it exhibited results higher than the reference concrete (without CDWA). Such results were not observed in the CDWA concretes within gravel 1 gradation range, which showed more preponderant variation in all mixes ranging from 2.1% lower (D1) up to 43.0% higher (R1). This variation in relation to the reference value was mainly caused by the heterogeneity of CDWA and the bigger size of this aggregate’s particles, which provided a similar result when the CDWA was mostly constituted of gravel (R4). However, higher values were obtained when using ceramic materials, and lower values were reduced due to the excess of contaminants [8].
Overall, an increase in compressive strength can be observed in most of the mixes under analysis, reaching maximum increases of 41.4% for sand, 40.4% for gravel 0, and 43.0% for gravel 1 (all in comparison with the reference mix). On the other hand, low reduction values of fc were found in some mixes: 5.6% for sand in mix with sample R1; none for gravel 0; 2.1% for D1 gravel 1, and 1.6% for D4 gravel 1. However, all concretes complied with fck ≥ 25 MPa requirement. However, it is worth noting the vast variability of results obtained in concretes produced with replacements of one single material and with different materials, considering a confidence interval of up to 10 MPa. This variability is because homogeneity and equalitarian distribution of CDWA constituents are hardly guaranteed in a concrete proportion mix. Some materials exhibit low density (plaster - Fig. (7b), and expanded polystyrene, for instance) improperly floated during the mix.
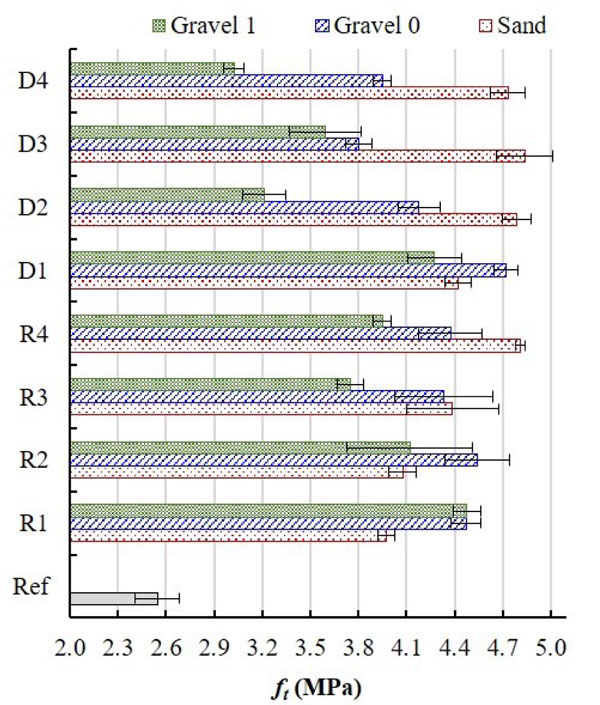
3.2.5. Splitting Tensile Strength
It can be noted in Fig. (11) that mixtures with R1 (gravels 0 or 1) and R4, D2 and D4 (sand) were the only ones with values (T-test) higher than the reference mix; the other mixes exhibited values within the same confidence interval. It is important to point out that, despite this fact, concrete mixes with CDWA exhibited great variability in comparison with concrete mixes with conventional aggregates. Splitting tensile strength values were found higher than those of reference mixes, proportionally: from 56.0% (R1) to 105.8% (R4) for concretes with replacing of sand; from 49.3% (D3) to 85.4% (D1) for gravel 0 CDWA concrete; and from 18.7% (D4) to 75.7% (R1) for gravel 1 CDWA concrete.
It can be assumed that the gravel 0 mix showed less variation of this property, with higher values for the tensile strength due to a better packing of particles [45, 54], lower effective water/cement ratio and closure of the aggregate pores by the absorbed paste that improved the structuring of the cementitious matrix. Gravel 1 mix showed the lowest values due to the presence of contaminants (unfractured - Fig. 7b, c & f) and to the lower strength mortars adhered to the gravel (approximately 15 MPa). The sand mix, which exhibited the widest variation range, was influenced by not only the heterogeneity [8], but also by the mechanical strength [55] of CDWA constituents (low strength materials are more friable).
3.2.6. Dynamic Modulus of Elasticity
The mix with gravel 1 gradation (D4) exhibited a value lower than that of the reference mix, which was caused by an excess of contaminants (Table 3 and Fig. 12). The other mixes are found in the confidence interval, being statistically equal and contrary to what was found by Bravo et al. [43] that altered the water/cement ratio and realized an expressive fall in the elasticity modulus. This paper showed that the lower effective water/cement ratio and the closure of the aggregate pores by the absorbed paste increased the cementitious matrix's structuring and dynamic modulus of elasticity. Unlike the compressive strength and splitting tensile strength, this property exhibited little variability to the heterogeneity of the CDWA. This variation could be resolved with an increased addition of water–reducing admixture, which improves plasticity and the distribution of particles between the paste and the cement, consequently reducing the porosity and water absorption, because, according to Barbudo et al. [16] this type of admixture improves the compactness of the mixture.
It was noticed that waste aggregates with higher content of mortars and ceramic materials converged towards smaller Ed values, while CDWA with higher concrete and gravel contents result in higher elasticity modulus [12, 43, 59], confirming the fact that the quality of the CDWA influences this property. Usually, a mixture of dense and light materials directly interferes with the concrete's elasticity modulus. Consequently, justifying the higher values found because of the presence of mortars and gravels compared with those with higher contents of materials whose densities are lower, mainly contaminant materials.

3.2.7. Electrical Resistivity
Fig. (13) shows an exclusive mixture of R1, R2, R3 and D2 in sand gradation range and D4 in gravel 1 gradation range exhibited values in the same confidence interval as the reference mix (being so, statistically equal). The other ones exhibited lower values (close to 50%) lower than the reference mix. In a different way of compressive strength and splitting tensile strength test, this property showed little variability (statistically equal) to the heterogeneity of CDWA, exceptionally with respect to mixes R1 and R2 in sand gradation range as they were found higher than the other mixes with wastes. These results demonstrate that concretes with sand waste and high contents of concrete and gravel provided the values of the property mentioned earlier to remain the same. The other mixes with higher contents of contaminants and ceramic materials exhibited an expressive reduction of this property.
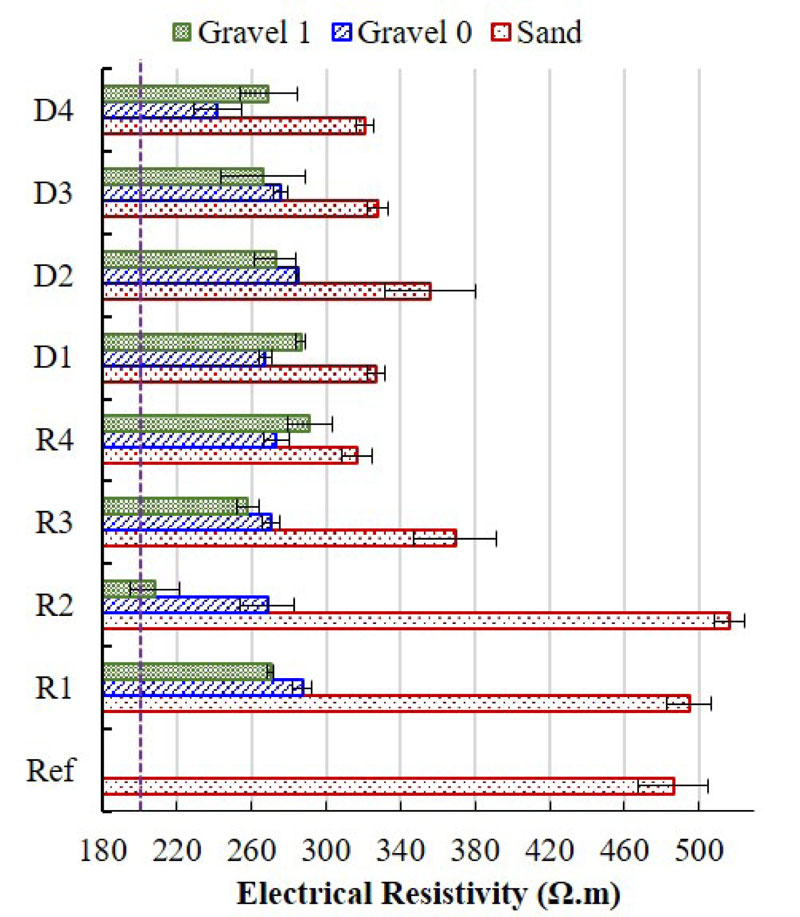
Overall, the following extreme variations of results were identified: Concrete with sand replacement from 6.2% (to sample R2) higher to 34.0% (to D4) lower; concrete with gravel 0 CDWA from 40.9% (to R1) to 50.3% (D4) lower; and composites with gravel 1 CDWA from 40.1% (R4) to 57.2% (R4) lower. Mehta and Monteiro [60] demonstrated that resistivity is an important parameter in assessing corrosions in reinforced concrete structures since this is often caused by alkalinity (carbonation), by the influence of alkalis on porosity percolation or significant quantities of chloride ion penetration. The corrosion probability is correspondent to the electrical resistivity values: 50 Ω·m – very high; from 50 Ω·m to 100 Ω·m – high; from 100 Ω·m to 200 Ω·m – moderate to low; and above 200 Ω·m – low [61]. With the rates found in this study, it was concluded that all values are higher than 200 Ω·m, being excellent concretes concerning reinforcement corrosions according to the precepts as mentioned above, even though these values correspond to 70% of the reference mix values.
Santos [39] states that resistivity is fundamentally related to the permeability of fluids and diffusivity of ions through pores of materials, which corroborates with the results found regarding porosity and water absorption immersion and capillarity (Fig. 2). Lubeck [62] stated that electrical resistivity is highly sensitive to several different concrete composition factors, such as water/binder ratio, consumption and type of cement, type of aggregate and mineral admixtures, and chemical admixtures, since these promote alterations in pore size and distribution, in internal moisture content, pH, among others. Therefore, it can be concluded that the conventional aggregates replaced in 20% for CDWA aggregates influence the properties of the concrete, mainly if it is considered the variability of CDWA components.
3.2.8. Carbonation Depth
As shown in Fig. (14), the concrete accelerated carbonation tests results obtained with reference and CDWA concretes demonstrate that gravel 0 samples R1 and D3 and gravel 1 samples D3 and D4 exhibited the highest carbonation depth values (approximately 10 mm). Despite being significantly higher than the other ones (5x higher), they remain within the limit of 25 mm established by the Brazilian standard NBR 6118 [63].
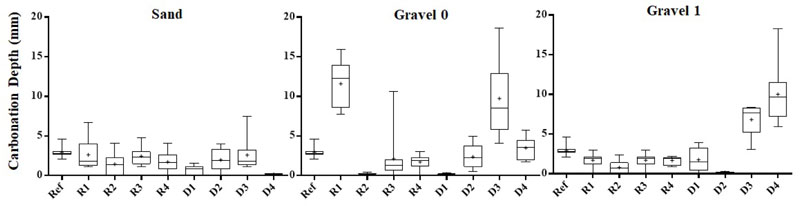
The carbonation depth results showed variabily in each sample and it was necessary to take fourteen readings on each side of the cylindrical specimens. In places where there was some contaminant, adhering mortars, and the same covering mortars, a greater carbonation depth was detected. In order to be more representative and as the results allowed 14 readings for each sample, the Box Plot chart was structured in order to better express the sample values.
The mixtures with the highest content of ceramic materials (54.4%) and contaminants (10.92%) need to carefully eliminate contaminants and reduce the content of ceramic materials in concretes. Such results diverge from the results obtained by Werle, Kazmierczak and Kulakowski [64], who stated that concretes with lower strength are more porous and exhibit higher carbonation. However, it was seen that the mixes are more influenced by a drier consistency, which, though not increasing open porosity, generated pore refinements (increasing capillarity), consequently providing a greater percolation of CO2 into the concretes, especially when they have ceramic materials and/or contaminants.
In general, most of the carbonation coefficients exhibited by the mixes were lower or equal to that of the reference mix, thus showing that the presence of wastes with low content of contaminants had little influence on this property. Additionally, in several mixes, such as those with R2 and D1 samples, most of the gradation ranges of CDWA made the concrete less permeable (due to the lower effective water/cement ratio and closure of the aggregate pores by the absorbed paste), thus reducing carbonation close to zero. Also, the results of the other studies [10, 48] showed that increases in fineness modulus of the aggregate increases carbonation depth. This corroborates this research, that when one single material is crushed in different particle size ranges, the application of sand fraction (low fineness modulus) generates concretes with lower carbonation depth than those with the application of gravel fraction (high fineness modulus).
CONCLUSION
The results obtained through tests, verification and statistics evaluation (T-test) provided the following conclusions:
- The concretes' workability with CDWA reduced due to the reduction of the effective water cement/ratio, mainly when used the D type aggregate. However, it could be compensated by a superplasticizer, since there were increases in the compressive strength;
- The mechanical properties proved to be influenced by heterogeneity, typology and contaminating agents of the CDWA, mainly because of the effects of effective w/c ratio reduction and mixture compactness improvement. Moreover, the addition of the CDWA to the cement paste, instead of directly to the water, also generated improvements to this property;
- The durability property results obtained demonstrated concerning electrical resistivity that the values were reduced up to 70% when compared to the reference concretes; however, they still configure a good concrete exhibiting high reinforcement corrosion resistance. Besides, mixes with high content of mortar and ceramic materials presented higher coefficients of porosity, water absorption by immersion, carbonation depth and water sorptivity due to the pore refinement, which can reduce the lifespan of the building.
- The presence of contaminant elements can increase the fragility of the concrete. For instance, the plaster became a manually brittle material and the wood pieces withered and were likely to detach, thus producing voids. When located close to the concrete surface these materials will detach due to moisture, causing vesicles and reducing the covering and lifespan of the structure;
Therefore, the heterogeneity, typology and contaminant content significantly influence the analyzed properties, however, in some cases (durability, for example) the problems can only be detected by microscopy analysis. It is possible to replace 20% of conventional aggregates for the CDWA, if it is carefully analyzed the material constituents, heterogeneity and the type of these aggregates. The results obtained and the references mentioned in this study prove that a separation at source is an efficient and cheap technique, that reduces the contaminating elements, and makes the use of CDWA feasible to reduce the demand for cement (without alter properties), guaranteeing suitable mechanical strength and durability, and consequently reducing the concrete production costs.
LIST OF NOTATIONS
| CPIV-40 | = is the Brazilian Portland cement with up to 50% pozzolanic material |
| CDWA | = is the construction and demolition waste aggregate |
| SLU | = is the Superintendent of Urban Cleaning |
| ABNT | = is the Brazilian Association of Technical Standards |
| NBR | = is the Brazilian Regulatory Standard |
| Dmax | = is the maximum aggregate size (diameter) (in mm) |
| ɣreal | = is the real density (in g/cm3) |
| ɣunit | = is the unit mass (in g/cm3) |
| Cc | = is the clay content (%) |
| P.M. | = is the pulverulent material content (%) |
| W.A. | = is the water absorption (%) |
| fck | = is the characteristic compressive strength (in MPa) |
| ft | = is the tensile strength (in MPa) |
| Ed | = is the dynamic modulus of elasticity (in GPa) |
CONSENT FOR PUBLICATION
Not applicable.
AVAILABILITY OF DATA AND MATERIALS
Not applicable.
FUNDING
The study was financially supported by the Brazilian Ministry of Science, Technology, Innovation and Communications through the agencies Financier of Studies and Projects (FINEP) and National Council for Scientific and Technological Development (CNPq). Project titled: Methodologies and Technologies for Sustainable Solid Waste Management: Emphasis on Reduction and Valorization in Urban Environments – TECRESOL.
CONFLICT OF INTEREST
The authors declare no conflict of interest, financial or otherwise.
ACKNOWLEDGEMENTS
Declared none.

