All published articles of this journal are available on ScienceDirect.
Corrosion Effect of Rice Husk Ash in Concrete Pore Solution: Response Surface Analysis
Abstract
Background:
Corrosion of reinforcement impedes the structural integrity of concrete infrastructures by reducing the flexural, shear and axial strength of concrete, thereby making it structurally weak.
Aim:
This research assessed the corrosion effect of rice husk as a concrete constituent for the design of long-lasting concrete infrastructures.
Materials and Methods:
To achieve the aim of this research, rice husk was air-dried for two days and then burnt at a temperature of 600oC. It was used as a partial replacement for cement at 0%, 10%, 20% and 30% replacement of cement. The concrete pore solution was extracted by mechanical means. This was used as the medium to assess the weight loss and calculate the corrosion rate at seventy-two (72) hours interval with a focus on the temperature of the environment. The corrosion inhibition of the steel rebar was determined using the weight loss method.
Results:
The result was analysed and modelled using a response surface analysis. The optimisation of the corrosion effect was also assessed using the same method. The result of the study revealed that the inhibition efficiency based on the average corrosion rate was -69.54%, which indicates that 5% of rice husk ash does not inhibit corrosion, likewise the other replacements. The corrosion inhibition of 15% replacement with rice husk ash is slightly higher than the control sample. The research revealed that the most favourable replacement in terms of corrosion rate in comparison to the other percentages is 15%.
Conclusion:
The mathematical model showed that RHA has a positive effect on the corrosion rate of mild steel. This indicates that the higher the RHA, the lower the corrosion rate. The outcome of this research will serve as a guide for concrete users, engineers, corrosion experts and researchers on the use of rice husk ash in concrete production.
1. MOTIVATION
In track with the sustainable development goals, there is a need to protect the environment. This is also applicable in concrete technology as concrete is one of the most used materials in the construction industry [1, 2]. In a bid to make concrete affordable for infrastructural development, recent researches are geared towards the use of sustainable alternative materials in concrete production. This is to reduce the cost of concrete production in line with the trash to treasure drive. These alternative supplementary materials are usually used as a partial replacement for cement, which is the most expensive component of concrete production. Rice husk ash is one of the most used supplementary cementitious materials in concrete technology [3]. Rice husk ash is a highly pozzolanic supplementary cementitious material. Several types of research affirmed its use as an additive in concrete [4]. However, a dearth of literature exists on the corrosion effect of this material in concrete. Corrosion of reinforcement impedes the structural integrity of concrete structures by reducing the flexural, shear and axial strength of concrete, thereby making it structurally weak. It shortens the service life of the structures by crack initiation, propagation and subsequently spalling of the cover concrete due to expansion of corrosion steel [5, 6]. Corrosion of embedded reinforcement in concrete is one of the major causes of the deterioration of reinforced concrete structures [7-16]. This research assessed the corrosion effect of rice husk as a concrete constituent for the design of long-lasting concrete infrastructures. This is in a bid to reduce the failure of concrete structures due to the corrosion of embedded rebars, which is a significant problem causing significant loss of money and time.
2. INTRODUCTION
In track with the trash to treasure initiative, sustainable concrete is one principal focus of concrete researchers globally. To this end, the re-use of solid waste in concrete production has gained popularity. The research [16-26] assessed the suitability of several waste materials in concrete production as a partial replacement for cement. Additionally, the use of natural pozzolans, such as metakaolin, has been evaluated [26-30]. Agricultural waste in concrete technology has been worked on by researchers [31-33]. These authors have recommended the use of agricultural waste, such as rice husk, in a bid to reduce the cost of disposal.
Rice husk ash is a highly pozzolanic agricultural waste that has been adopted in concrete production over time [3]. This material is the by-product from the production and harvest of rice from rice milling industry/farms [23]. The research [3] has proved the effectiveness of rice husk as a viable supplementary material in concrete production, but the dearth of literature exists on the effect of this material on the corrosion of reinforcement in concrete.
Corrosion has been spotted as one of the main causes of concrete deterioration [34-38]. The corrosion of steel reinforcement is an electrochemical process that requires the flow of electric current and several chemical reactions (CITE). The corrosion of embedded reinforcement in concrete is considered to be one of the leading causes of the deterioration of many existing reinforced concrete structures as avowed in previous studies [7-11]. Corrosion of reinforcement on concrete has high-cost implications based on the need for repair and replacement. The research [39] stated that the effect of corrosion led to a massive amount for the US government for the replacement of concrete highway bridges.
Additionally, a study [39-42] avowed that corrosion can lead to increased pressure around the reinforcement. The most obvious physical sign of corrosion involves crack propagation and cover delamination [43-45]. Furthermore, the following are the consequences of corrosion on reinforced concrete structures as avowed by the following authors in Table 1.
3. MATERIALS AND METHODS
3.1. Materials
Portland limestone cement of grade 42.5R was purchased from the open market of Ogun State Nigeria. The coarse and fine aggregate of size 4.5 mm and 19.5 mm was used all through the batching process. The rice husk ash was obtained from a local rice farm in Ado-Odo Ota local government, Ogun State Nigeria. Deformed steel rebar used as reinforcement in concrete infrastructure was purchased. This rebar, according to the manufacturer, has over 0.25% of carbon. 12 mm diameter of this rebar was used in carrying out the corrosion test.
3.2. Sample Preparation
Rice husk, a berlignoselulosa, like other biomass materials, was air-dried for two days and then taken to the laboratory for burning. It was burnt at a temperature of 600oC. At this temperature, the calcination of rice husk ash below the crystallisation temperature of 780oC is adequate.
In assessing the weight loss of the 12 mm nominal diameter reinforcement, the steel rebar was cut into 30 mm length. The average area of the exposed rebar surfaces (cross-section) was 1.04 cm2. The ash was sieved to remove debris before use [59]. The fine aggregate was physically inspected before purchase. Portable water free from germs and deleterious materials was used in batching the concrete.
3.3. Methods
The ash was cooled and passed through the 425 μm sieve to remove larger particles. The sample was then weighed before use. The rice husk ash was used as a partial replacement for cement at 0,10, 20 and 30%. To this end, four concrete types were developed (Table 2). The mix ratio is shown in Table 2.
| S/N | Description | Author |
|---|---|---|
| 1 | The loss of stiffness during the service life | [46] |
| 2 | Negative influence on bond strength | [47] |
| 3 | Concrete creep | [48, 49] |
| 4 | Decreased load-carrying capacity and ductility in the ultimate limit state | [50-54] |
|
5 |
Safety of reinforced concrete structures also subjected to corrosion: Loss of stiffness Loss of shape |
[55] Castaldo, P., Palazzo, B., Mariniello, A. (2017) [56-58] [5, 6] |
| % Replacement |
Cement (kg) |
RHK (kg) |
Fine Aggregate (kg) | Coarse Aggregate (kg) |
Water (kg) |
|---|---|---|---|---|---|
| 0 | 5.00 | 0.000 | 10.00 | 20.00 | 5 |
| 10 | 4.5 | 0.250 | 10.00 | 10.00 | 5 |
| 20 | 4 | 0.500 | 10.00 | 10.00 | 5 |
| 30 | 3.5 | 0.750 | 10.00 | 10.00 | 5 |
3.4. Pore Solution Extraction
Concrete mixtures were batched according to weight. The pore solutions were extracted manually. The mixing was done in a head pan to reduce water loss at the concrete laboratory of Covenant University, Nigeria. The concrete pore electrolyte used in the analysis was extracted after 4 hrs from the onset of the hydration process of the cement in the fresh concrete mix [60]. Additionally, the load was applied to the specimen with the intention to promote confinement tension and expel the pore electrolyte. This was left to drain for 5 to 6 hours. The pore solutions obtained were placed in bottles and labelled appropriately [60].
3.5. Determination of Corrosion Rate (CR)
The experiments were carried out using Mild Steel bars suspended in 100 ml of the concrete pore solutions by glass hooks. This was done using ASTM G1-90, 1996. The experiment does not require any specialized equipment apart from an accurate weighing balance. The steel was immersed in the concrete pore samples at the different replacements. At 3 days’ intervals, specimens were taken out, cleaned using Clarke’s solution and rinsed under running water, dried and weighed. The weight of the specimen before and after immersion was recorded and used to calculate the corrosion rate and inhibition efficiency. This was calculated [61] in mdd.
 |
(1) |
 |
(2) |
Where: CRunihibited is the corrosion rate of uninhibited solution
CRinhibted is the corrosion rate of inhibited solution
T is the immersion period in days
A is the area of the specimen in dm2
R is the density of the specimen
3.6. Response Surface Methodology
Response surface methodology is a unique statistical tool [26]. This was used by having a series of tests, called runs, in which changes are made in the input variables in order to identify the reasons for changes in the output response. The equation follows the order:
 |
(3) |
Where X1 and X2 are the independent variables
E is the noise or error term.
4. RESULTS AND DISCUSSION
4.1. Corrosion Inhibition
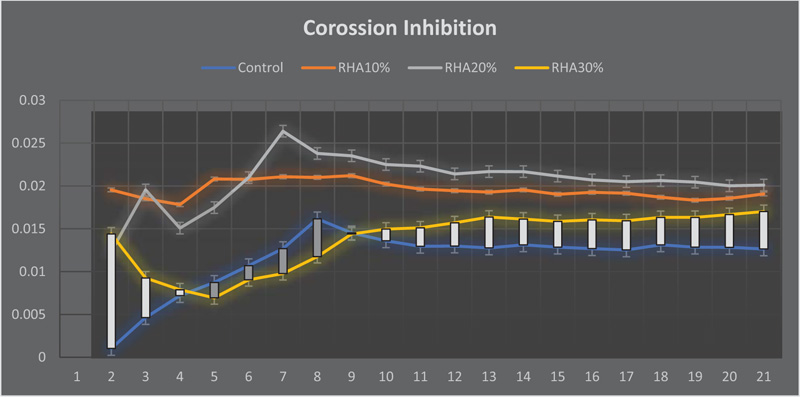
The average corrosion rate of 0.019546 mm/yr was obtained for the corrosion rate of the concrete pore solution at 5%. This is greater than the inhibition efficiency of the control (0.01152917 mm/yr) using equation 4. Fig. (1) shows the comparison between the corrosion rates of 10%, 20% and 30% addition of the supplementary material for 1440 hours. The inhibition efficiency based on the average corrosion rate was calculated to be -69.54%, which indicates that 5% of rice husk ash does not inhibit corrosion, likewise the other replacements.
From the same figure, the corrosion inhibition of 15% replacement with rice husk ash is slightly higher than that of the control sample. It can be said that the lowest and most favorable percentage in terms of corrosion rate in comparison to the other percentages is 15%.
The result of the analysis revealed higher percentage replacements of the pozzolanic material. This may be due to the alkaline environment of the pore solution at higher percentage additions (<9). This may inhibit the formation of a protective coating on the surface of the reinforcement, which may initiate corrosion. This is because the alkalinity of concrete is a critical factor in determining the corrosion of concrete. The pH value of the pore water is generally between 12.5 to 13.5, but due to carbonation during the hydration process, the pH is reduced to less than 9. The carbonation effect of C02 from the atmosphere reacting with the alkaline component in the concrete with rice husk ash in the presence of moisture converts the calcium hydroxide to calcium carbonate CaC03 (Equation 5). The reinforcement is no longer in passivating range thereby initiating corrosion.
 |
(5) |
4.2. Statistical Analysis of the Weight Loss of Metakaolin
A Mild Steel sample was suspended in each extracted pore solution of metakaolin at (5%, 10%, 15% and 20% replacement). The weight loss values after 60 days were measured and recorded at 3 days’ intervals. The model summary of the input and output parameters was analysed using the response surface methodology. The design parameters are:
Design Parameters
Initial Design - Historical Data
Design Model - Quadratic
Type - Numeric
Actual low - 0.00
Actual High - 1440
Experiments 59 Blocks
The RHA was used as a partial replacement and the effect of this additive on corrosion was examined. This was done at 72 hrs interval for sixty (60) days at the corrosion laboratory. The corrosion inhibition and corrosion rate were calculated using equations 1 and 2. The result of the weight loss of the various replacement is shown in Table 3.
4.2.1. Statistical Analysis of the Corrosion Rate
Table 4 shows the temperature of the various days used in the laboratory. This temperature was adopted in one of the hottest months in the temperate region. This was done to assess the effect of the daily temperature change on the corrosion of reinforced concrete structures.
| Time | CR 0% | CR 10% | CR20% | CR 30% |
|---|---|---|---|---|
| 72 | 0.0036 | 0.015422 | 0.0038 | 0.0018 |
| 144 | 0.0052 | 0.016707 | 0.0044 | 0.0023 |
| 216 | 0.0081 | 0.016279 | 0.0068 | 0.0027 |
| 288 | 0.0101 | 0.01735 | 0.00102 | 0.0044 |
| 360 | 0.0123 | 0.024161 | 0.00154 | 0.0057 |
| 432 | 0.0143 | 0.022704 | 0.00162 | 0.008 |
| 504 | 0.0165 | 0.027539 | 0.183 | 0.0112 |
| 576 | 0.0177 | 0.02988 | 0.0137 | 0.0110 |
| 648 | 0.0191 | 0.034556 | 0.0217 | 0.0147 |
| 720 | 0.0208 | 0.034185 | 0.0219 | 0.0168 |
| 792 | 0.0225 | 0.032246 | 0.0253 | 0.0199 |
| 864 | 0.0247 | 0.031272 | 0.0274 | 0.0209 |
| 936 | 0.0259 | 0.02946 | 0.0288 | 0.0216 |
| 1008 | 0.0281 | 0.031945 | 0.0302 | 0.0234 |
| 1080 | 0.0298 | 0.030672 | 0.0327 | 0.0248 |
| 1152 | 0.0309 | 0.030522 | 0.0341 | 0.0271 |
| 1224 | 0.0321 | 0.031146 | 0.0358 | 0.0286 |
| 1296 | 0.0343 | 0.030986 | 0.0337 | 0.0308 |
| 1368 | 0.0371 | 0.030764 | 0.0381 | 0.0331 |
| 1440 | 0.0384 | 0.03021 | 0.0389 | 0.0346 |
| Time | Temperature | CR 10% | CR 20% | CR 30% |
|---|---|---|---|---|
| 72 | 24.2 | 0.0036 | 0.00257 | 0.005141 |
| 144 | 25.1 | 0.0052 | 0.003855 | 0.006426 |
| 216 | 25.6 | 0.0081 | 0.006854 | 0.017992 |
| 288 | 24.7 | 0.0101 | 0.006426 | 0.02249 |
| 360 | 27.7 | 0.0123 | 0.009253 | 0.029301 |
| 432 | 28.4 | 0.0143 | 0.011995 | 0.032129 |
| 504 | 30.4 | 0.0165 | 0.012117 | 0.034516 |
| 576 | 28.2 | 0.0177 | 0.014137 | 0.039518 |
| 648 | 26.9 | 0.0191 | 0.014565 | 0.043981 |
| 720 | 27.2 | 0.0208 | 0.014908 | 0.041896 |
| 792 | 30.2 | 0.0225 | 0.014487 | 0.040424 |
| 864 | 30.9 | 0.0247 | 0.014779 | 0.059974 |
| 936 | 31.2 | 0.0259 | 0.014433 | 0.036775 |
| 1008 | 33.7 | 0.0281 | 0.01634 | 0.035617 |
| 1080 | 31.6 | 0.0298 | 0.018506 | 0.034613 |
| 1152 | 29.8 | 0.0309 | 0.020884 | 0.034057 |
| 1224 | 27.8 | 0.0321 | 0.021621 | 0.03417 |
| 1296 | 28.8 | 0.0343 | 0.022133 | 0.03527 |
| 1368 | 27.2 | 0.0371 | 0.022862 | 0.035578 |
| 1440 | 29.1 | 0.0384 | 0.023647 | 0.03547 |
| Model Terms | Sum of Squares | DF | Mean Square | F-Value | Prob F | Sig |
|---|---|---|---|---|---|---|
| A | 0.00245 | 1 | 0.00245 | 7.23 | 0.0098 | - |
| B | 8.94E-04 | 1 | 0.26 | 26.35 | < 0.0001 | |
| C | 1.49E-07 | 1 | 0.00015 | 0.9474 | - | |
| A2 | 1.80E-03 | 1 | 0.0180 | 53.11 | < 0.0001 | |
| B2 | 1.40E-04 | 1 | 0.0040 | 4.13 | 0.0475 | |
| C2 | 1.51E-06 | 1 | 0.005 | 0.045 | 0.8336 | |
| AB | 2.97E-04 | 1 | 0.00297 | 8.76 | 0.0047 | |
| AC | 1.97E-04 | 1 | 0.00197 | 5.8 | 0.0198 | |
| BC | 1.38E-05 | 1 | 0.0038 | 0.41 | 0.0226 | |
| Residual | 1.66E-03 | 49 | 0.00339 | - | - | |
| Cor Total | 9.05E-03 | 58 | - | - | - |
Mean 0.023
R-Squared 0.8164
Adj R-Squared 0.7827
Pred R-Squared 0.7243
Adeq Precision 18.601
4.3. Analysis of Variance
The Model F-value of 7.23 implies the model is significant (Table 5). There is only a 0.01% chance that a “Model F-value” this large could occur due to the error function. The R-squared value of 0.8164 indicates that 81.64% of the data can be explained and analysed by the model. From the model result, the difference between the adjusted R2 and the predicted R2 is within the specified range (0.2) and hence it is satisfactory.
Final Equation in Terms of Coded Factors:
 |
(4) |
Final Equation in Terms of Actual Factors:
 |
(5) |
Where A is the RHA
B is the time
C is the temperature
The model result showed that the addition of RHA has a positive effect on the corrosion rate of mild steel to appoint (5%), as indicated in the laboratory result. However, at 10% addition and above, the corrosion resistance reduced. The indication of this is that the porosity of the developed concrete might be increased, thereby increasing the penetration rate of harmful ions. Additionally, the higher the RHA, the lower the corrosion rate. However, time and temperature showed a positive relationship. The model revealed that a unit increase in time would cause a 0.023 increase in the corrosion rate.
4.4. The Box-Cox Power Transformation
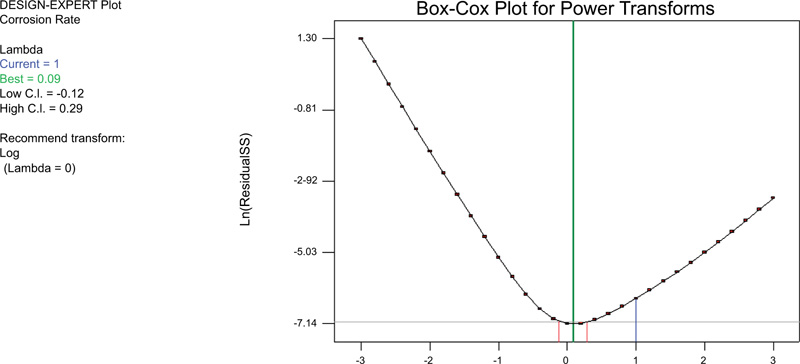
The Box-Cox power transformation indicates the confidence interval of the coded data; this is between -0.12 and 2.9 (Fig. 2). This can be interpreted that the response is close to the predicted outcome. This indicates a lower standard error.
4.5. Response Surface Analysis of the Effect of Rice Husk ash on Concrete
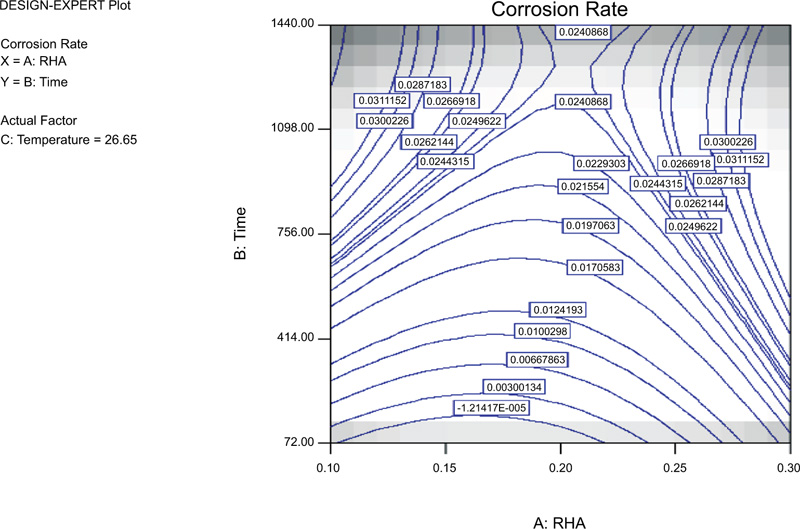
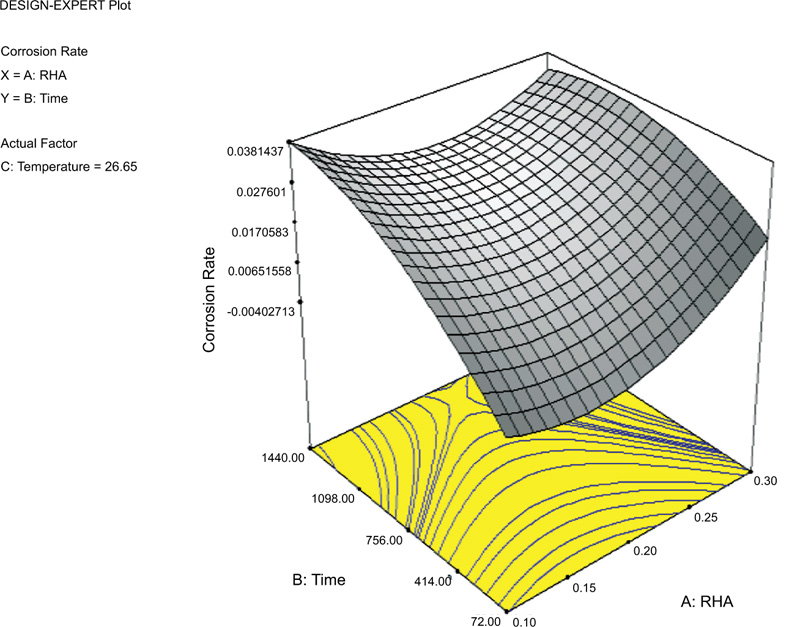
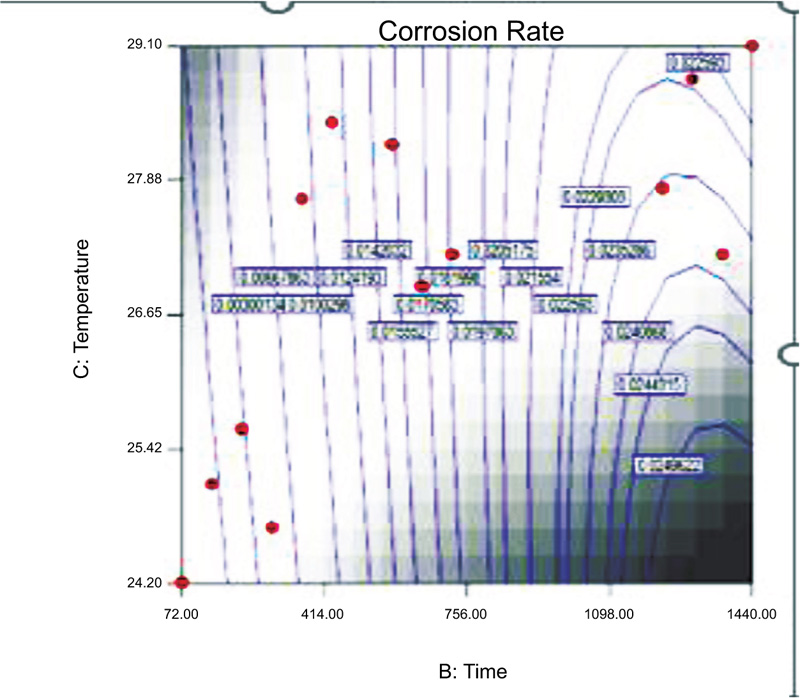
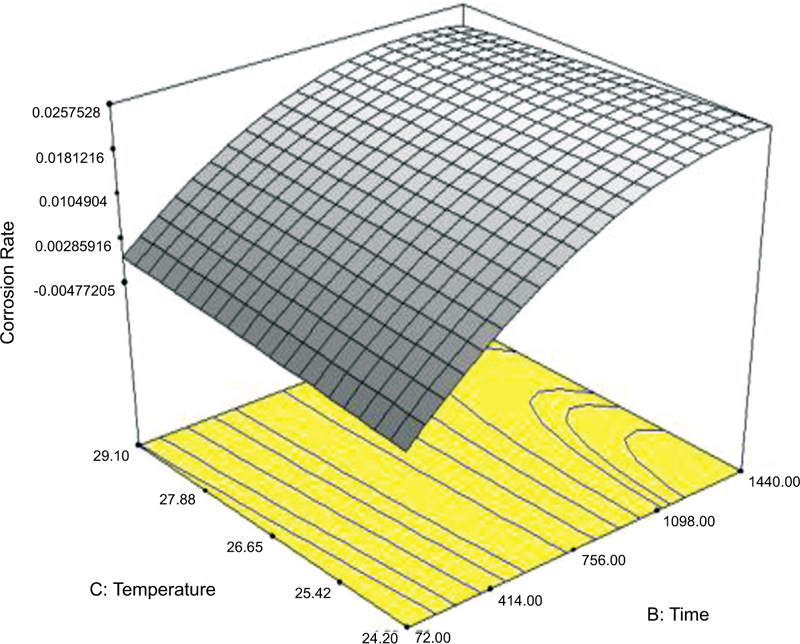
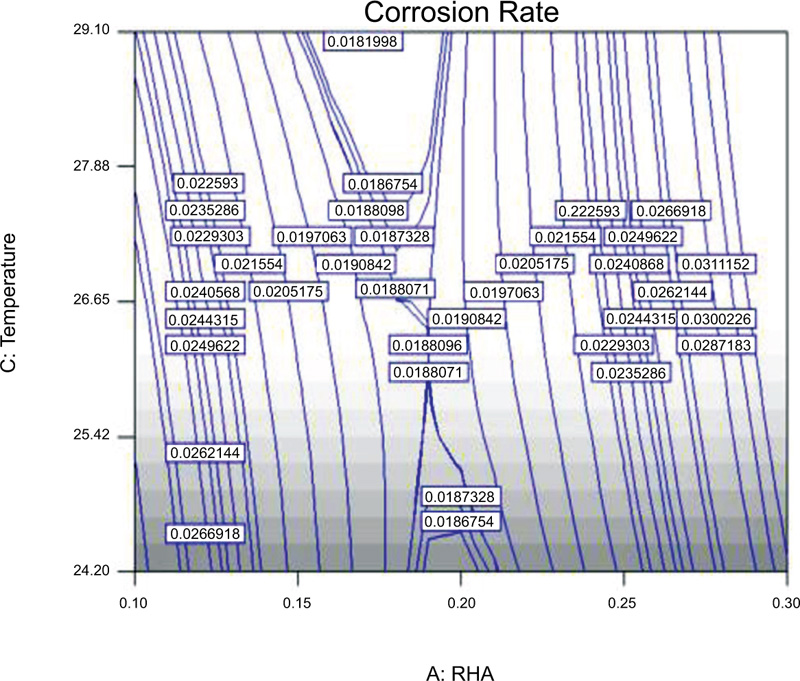
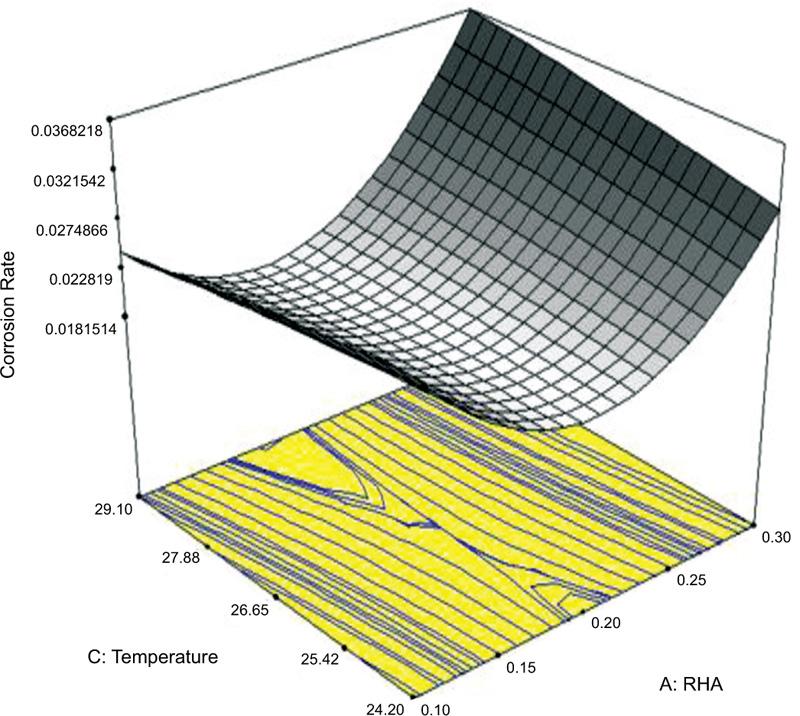
Only two variables are represented in Figs. (3-7). The third variable is held constant. From Figs. (3, 5 and 7), the response surface plot is curved because the model is quadratic. The 2D Figs. (3, 5 and 7) shows the responses of the time, temperature and RHA. This follows the direction of the movement along the path of the corrosion rate, as indicated in Figs. (2, 4 and 6).
The result indicates that there exists an interaction between the observed variables. This is shown in the intersection of the horizontal plane where the third variables (time, temperature or RHA) as the case may be are held constant.
 |
(6) |
 |
(7) |
 |
(8) |
The darker region in the 2D plots indicates the area of a high value of the corrosion rate. From Fig. (4), the high value of the corrosion rate is shown in the upper right corner of the plot.
The high value of the corrosion rate is indicated at the upper right of the plot, as shown in Figs. (6 and 8). The non-indicated factors are held constant at the horizontal of the plot in the simulation of the corrosion rate of mild steel. This was used for sequential experimentation to come up with an optimum response. From the response surface plot Fig. (6), the result indicated that the higher the time, the higher the corrosion rate.
4.6. Optimization
The result of the optimisation process is indicated in Table 2. The table shows the combination with the desirability of 1 using the lowest and highest goal point. The desirability lies between 0 and 1. For the considered variables (RHA, time and temperature), the desirability of 1 is obtained (Table 6). This represents the closeness of the response to the ideal value.
| RHA* | Time* | Temperature* | Desirability | ||
|---|---|---|---|---|---|
| 1 | 0.28 | 674.74 | 28.22 | 1 | Selected |
| 2 | 0.15 | 1083.23 | 26.19 | 1 | - |
| 3 | 0.11 | 1082.68 | 25.69 | 1 | - |
| 4 | 0.25 | 1255.46 | 28.83 | 1 | - |
| 5 | 0.21 | 470.91 | 25.25 | 1 | - |
| 6 | 0.11 | 1239.59 | 29.01 | 1 | - |
| 7 | 0.11 | 225.63 | 26.19 | 1 | - |
| 8 | 0.25 | 123.71 | 27.67 | 1 | - |
| 9 | 0.12 | 200.04 | 27.54 | 1 | - |
| 10 | 0.2 | 598.95 | 24.32 | 1 | - |
CONCLUSION
This experimental research assessed the effect of rice husk ash on the corrosion effect of mild steel in reinforced concrete structures. The was done at 0%, 10%, 20% and 30% partial replacement of rice husk ash. The concrete pore solution obtained was used as the medium for the weight loss experiment. To this end, the corrosion rate of the samples was assessed at a seventy-two (72) hours interval.
The model result showed that the addition of RHA has a negative effect on the corrosion rate of mild steel at a higher percentage at a very low rate.
This indicates that the higher the RHA, the lower the corrosion resistance.
This may inhibit the formation of a protective coating on the surface of the reinforcement, which may initiate corrosion.
The reduction in the corrosion rate is an indication that the porosity of the developed concrete might be increased, thereby increasing the penetration rate of harmful ions.
The carbonation effect of Carbon dioxide from the atmosphere reacting with the alkaline component in the concrete with rice husk ash in the presence of moisture converts the calcium hydroxide to calcium carbonate CaC03.
The reduction in the pH due to the addition of rice husk ash will make the reinforcement no longer in passivating range, thereby initiating corrosion.
However, time and temperature showed a positive relationship. The model revealed that a unit increase in time would cause a 0.023 increase in the corrosion rate.
This makes it a good supplementary additive with feasibility in reinforced concrete structures. However, time and temperature showed a positive relationship.
The model revealed that a unit increase in time would cause a 0.023 increase in the corrosion rate. The material is therefore recommended as a viable supplementary cementitious material in concrete technology due to its unique inhibition to weight loss.
RECOMMENDATION
Future work should assess the effect of rice husk ash on the corrosion of steel in reinforced concrete production, especially at higher replacement and as a full replacement for cement. The temperature effect should also be assessed.
CONSENT FOR PUBLICATION
Not applicable.
AVAILABILITY OF DATA AND MATERIALS
None.
FUNDING
None.
CONFLICT OF INTEREST
The author declares no conflict of interest, financial or otherwise.
ACKNOWLEDGEMENTS
The authors are grateful to the management of the Tshwane University of Technology, Pretoria, for the full sponsorship of the research.

