All published articles of this journal are available on ScienceDirect.
Sensitivity Study of Dynamics Variability for Mild-carbon Steel Structures Affected by Corrosion
Abstract
Background:
Corrosion propagation mainly occurs due to environmental conditions and to the absence of adequate maintenance. The corrosion propagation affects the structural performances of slender and thin structures, in particular in the case of structure very sensitive to the wind action and its dynamical phenomena, because commonly they are designed with a precise optimization of the stiffness/mass ratio. The static and dynamic wind action represent an immediate safety hazard in the case of structural stiffness and mass reduction due to the corrosion depth.
Objective:
This paper discusses the dynamics behavior variability due to the corrosion depth propagation for two significant examples of slender and thin structure (i.e. tower and truss roof).
Methods:
The structures assumed as case of study are made of mild carbon. The corrosion depth variability was estimated based on literature references. The structural natural frequencies and modal shapes are assumed as significant magnitudes to discuss the effect of the corrosion on the structural elements.
Results:
Results have shown that the corrosion depth gives a significant reduction of frequencies and modification of modal shapes.
Conclusion:
Results have shown that the corrosion depth affect the structural behavior long before a structural collapse. It suggests that a monitoring must be done to estimate the structure reliability for the Serviceability limit state under Characteristic design loads.
1. INTRODUCTION
The durability of metal structures is strongly influenced by damage caused by corrosion, whose control is a key aspect for the design of new constructions [1-5] and, above all, for the safeguarding of existing common and historical buildings [6-10]. Moreover, exposure to atmospheric agents and increasingly large-scale pollution negatively affect this type of damage, which significantly reduces structural safety of steel [11-19] and reinforced concrete [20-23] structures.
Among different types of corrosion, the atmospheric one is an electrochemical phenomenon that induces the gradual and uniform destruction of metal by contact with substances present in the air [24, 25].
As a consequence of thickness loss (d) in metal members (Fig. 1), a very quick decrease in the structural performance occurs in terms of strength, stiffness and ductility. In the worst cases, this damage can lead to the collapse of either member or concerned joints, thus compromising the stability of the whole building (Fig. 2). In addition, for structures subjected to cyclic loads, the corrosion phenomenon can produce a significant reduction in fatigue strength, mainly in zones with high stress concentrations, such as holes, notches and connections [26].
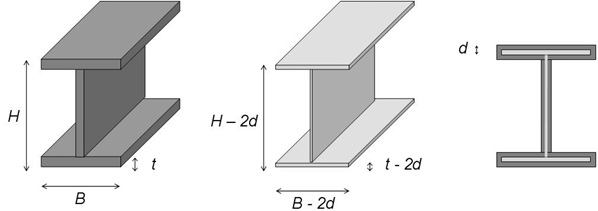
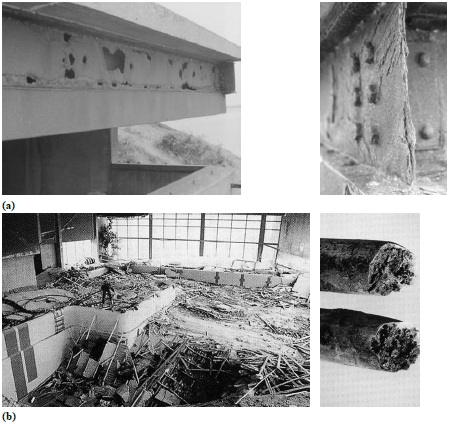
Thickness reduction cannot only be attributed to the reaction between metal and oxygen contained in the air, but it is also influenced by numerous agents, which in general are classified as exogenous and endogenous factors [27].
The exogenous factors depend on the atmospheric category in which the phenomenon is generated. In particular, the corrosivity level of an environment depends on three fundamental parameters: the relative humidity rate, the presence of pollutants and the concentration of chloride in the air.
A metallic element generally begins to lose weight in a significant way when the relative humidity (r.h.) of the external atmosphere exceeds a defined critical level [28, 29]. For iron base alloys, the corrosion phenomenon in medium aggressive atmospheres starts with values of r.h. equal to 60%, reaching a higher speed for values greater than 70% [28, 29] (Fig. 3a).
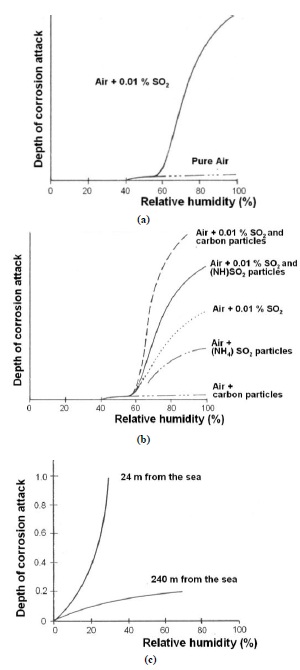
Moreover, the ferrous alloys are sensitive to the pollutants present in the air due to automotive and industrial emissions. Low concentrations of these substances in the region of 0,01% are enough to accelerate the corrosion process [30]. In Fig. (3b), in fact, it is demonstrated that sulphur dioxide SO2, produced by the combustion of coal, diesel and petrol, significantly influences this phenomenon. The deposit of soot and powder worsens the phenomenon, as it determines the condensation formation on the surface encouraging the stagnation of a thin water film which, working as an electrolyte solution, allows for the development of oxide-reduction reactions.
With the same rate of relative humidity, the corrosion rate is influenced by the concentration of chlorides on metal surfaces of buildings located near the sea. As the distance from the coast increases, the content of salt in the atmosphere decreases, thus causing a fast reduction of the corrosion rate, while at a distance of a few metres from the sea the corrosion depth increases exponentially (Fig. 3c). Experimental investigations have shown that chlorides become particularly insidious when in combination with the acidity due to sulphur or nitrogen gases, which are products of the fuel combustion in urban environments. In addition to exogenous factors, atmospheric corrosion also depends on endogenous factors linked to the chemical composition of the metal and to the type of processing. An emblematic example is represented by weathering steel, where the addition of small quantities of binder elements, like Cr, Cu, Ni, in ideal exposure conditions creates a continuous, tenacious and resistant coating protecting the underlying metal from external attack [31].
As more and more structures are optimized to reduce structural weight, the risk of the structural reliability reduction due to corrosion is particularly felt. This is the case, for example, of long and large structures used to cover large spans, bridges or towers. These kinds of structures are designed to be light and their high structural performances are often produced by the optimization of both load bearing elements and structural weights. In addition, these structures are generally very sensitive to wind actions and, for these reasons, the decrease in structural thicknesses and the consequent weight loss can affect the global structure stability.
The corrosion of load bearing structures sensitive to wind actions is particularly dangerous because it can modify their static resistance and dynamic behaviour. In fact, even a slight decrease in mass or stiffness can modify the natural frequen- cies and, thus, change the structure aeroelastic response. As an example, a change in the ratio between vertical and torsional frequencies due to corrosion closely affect the aeroelastic behaviour of suspended bridges or footbridges [32, 33].
Similarly, corrosion can modify the stiffness of beams or slabs into reinforced concrete bridges. In fact, this phenomenon can increase the bridge deformability and, consequently, modify its dynamic behaviour (i.e. frequency and damping). This is particularly dangerous for bridges equipped with seismic isolators [34, 35], because they are designed on the basis of well-defined natural frequencies and damping. The specific codes on wind and structure interaction did not discuss this topic [36-43].
For these reasons, the measurements of the corrosion depth of load bearing structures sensitive to wind actions must be monitored statically and dynamically. In order to study the dynamic variability due to the corrosion of a structure sensitive to wind actions, the wind/structure interaction, with a precise attention on the aerodynamic and aeroelastic properties modified by corrosion, needs to be investigated.
Firstly, experiments should investigate the structure aerodynamics in a wind tunnel (Rizzo et al., 2011; Rizzo, 2012; Rizzo et al., 2012; Rizzo and Ricciardelli, 2017) in order to estimate the wind action distribution on the structure. In this phase, the peak factor due to the wind action should be calculated through experiments in order to estimate the maximum wind action on the structure [44]. Secondly, dynamic analyses of the corroded structure should be performed in order to estimate its dynamic behaviour [45-62]. Subsequently, a scaled model of the structures should be designed based on aeroelastic scale laws [52]. Finally, aeroelastic wind tunnel tests should be carried out in order to estimate both the aerodynamic damping and the critical vortex shedding. These studies are necessary to predict negative phenomena, i.e. flutter instability or resonance under critical vortex shedding or galloping velocity.
The present paper discusses the dynamics modification due to the corrosion depth of load bearing structures sensitive to wind loads. In particular, the results obtained on three prototypes of structures, namely a pitch roof with two different types of stiffness and a truss tower, are provided. These structures, designed by the Eurocode 3 [63], are chosen because they are very commonly detected in European Countries. Corrosion depth is estimated using literature provisions and, subsequently, the natural frequencies and mode shapes of investigated structures are estimated as function of the corrosion depth. Finally, according to the CNR-DT 207 standard (2008) [64], aerodynamic damping, critical vortex shedding and galloping critical velocity (for the tower) are calculated before and after the occurrence of the corrosion phenomenon.
2. CASE STUDIES
2.1. Truss Pitch Roof
A pitch roof with a rectangular plan is chosen as example in order to investigate the aeroelastic behaviour variation due to corrosion. Fig. (4) illustrates the pitch roof geometry and dimensions. The plan size is 20x80 m. The minimum and maximum heights are 1 m and 4 m, respectively. The truss beam wheel base is equal to 5 m, while columns, that are not modelled in this phase, are 10 m high.
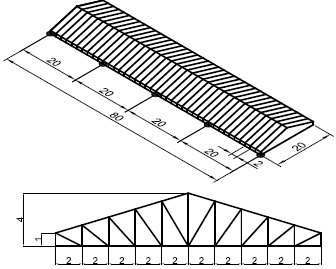
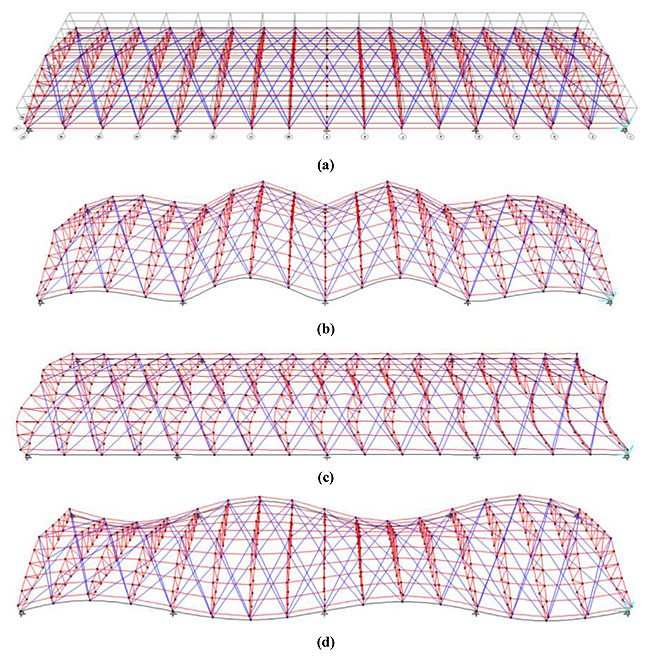
Fig. (5a) shows the Finite Element model of the structure. Model contains 374 nodes, 1033 frame elements and 10 nodes were restrained by pinned. Structure was modelled by truss elements. Two different structures with a different value of the global stiffness are considered in order to make a comparison between roofs that are sensitive or not to wind actions. For case study n. 1, the main truss beam is made of circular pipe elements with a diameter of 150 mm and a thickness of 6 mm. For case study n. 2), the main truss beam is made of circular pipe elements with a diameter of 50 mm and thickness of 3 mm. In this study, the corrosion depth (d) is modelled as a variation of the pipe thickness. The yielding stress of steel members is equal to 275 MPa. The structures are dimensioned using permanent loads of 0.2 kN/m2, snow actions of 1 kN/m2 and wind actions estimated according to the CNR-DT 207 standard (2008) [64]. In this latter case, the pressure coefficients aging on the roof range from +0.8 to 0.2, while the reference wind speed is taken equal to 27 m/s.
| Mode | f (Hz) | UX | UY | UZ | RX | RY | RZ |
| 1 | 1.936 | 0.000 | 0.000 | 0.000 | 0.161 | 0.000 | 0.000 |
| 2 | 2.020 | 0.000 | 0.000 | 0.124 | 0.000 | 0.000 | 0.000 |
| 3 | 2.249 | 0.000 | 0.000 | 0.000 | 0.598 | 0.000 | 0.000 |
| 4 | 2.445 | 0.000 | 0.000 | 0.000 | 0.000 | 0.000 | 0.001 |
| 5 (1st vertical) |
2.518 | 0.000 | 0.000 | 0.695 | 0.000 | 0.000 | 0.000 |
| 6 | 2.519 | 0.001 | 0.000 | 0.000 | 0.000 | 0.140 | 0.000 |
| 7 (1st transversal) |
2.625 | 0.000 | 0.413 | 0.000 | 0.005 | 0.000 | 0.000 |
| 8 | 2.678 | 0.000 | 0.000 | 0.000 | 0.000 | 0.000 | 0.015 |
| 9 | 2.755 | 0.000 | 0.000 | 0.000 | 0.000 | 0.000 | 0.004 |
| 10 (1st torsion) |
3.030 | 0.003 | 0.000 | 0.000 | 0.000 | 0.711 | 0.000 |
| Mode | f (Hz) | UX | UY | UZ | RX | RY | RZ |
| 1 | 0.480 | 0.000 | 0.000 | 0.000 | 0.000 | 0.000 | 0.010 |
| 2 (1st transversal) |
0.486 | 0.000 | 0.302 | 0.000 | 0.001 | 0.000 | 0.000 |
| 3 | 1.075 | 0.000 | 0.000 | 0.000 | 0.000 | 0.000 | 0.002 |
| 4 | 1.151 | 0.000 | 0.001 | 0.000 | 0.000 | 0.000 | 0.000 |
| 5 | 1.423 | 0.000 | 0.083 | 0.000 | 0.000 | 0.000 | 0.000 |
| 6 (1st torsional) |
1.488 | 0.000 | 0.000 | 0.000 | 0.191 | 0.000 | 0.000 |
| 7 (1st vertical) |
1.618 | 0.000 | 0.000 | 0.139 | 0.000 | 0.000 | 0.000 |
| 8 | 1.770 | 0.000 | 0.000 | 0.000 | 0.000 | 0.000 | 0.001 |
| 9 | 1.833 | 0.000 | 0.000 | 0.000 | 0.000 | 0.000 | 0.000 |
| 10 | 1.835 | 0.000 | 0.000 | 0.000 | 0.000 | 0.000 | 0.000 |

2.1.1. Example no. 1
Figs (5b-d) show the first vertical, transverse and torsion mode shapes, respectively, for the roof case study no.1. Table 1 gives the natural frequency and the participating mass values of the first ten vibration modes. In Table 1, the greatest values of the participating mass are bold marked. The first vertical mode (Fig. 5b) has a natural frequency equal to 2.518 Hz with a participating mass equal to 69.5%. The first transverse mode (Fig. 5c) has a natural frequency equal to 2.625 Hz with a participating mass equal to 41.3%. Finally, the first torsion mode (Fig. 5d) has a natural frequency equal to 3.03 Hz with a participating mass equal to 71.1%.
2.1.2. Example no. 2
The structural weight of the second case study is equal to about 1201 kN. So, a weight reduction of 30% is noticed with respect to the case study n. 1. The first vertical, transverse and torsion mode shapes of this roof are illustrated in Figs. (6b-d), respectively. Table 2 gives the natural frequency and the participating mass values of the first ten vibration modes.
The first vertical mode (Fig. 6b) has a natural frequency equal to 1.618 Hz with a participating mass equal to 13.9%. The first transverse mode (Fig. 6c) has a natural frequency equal to 0.486 Hz with a participating mass equal to 30.2%. Finally, the first torsion mode (Fig. 6d) has a natural frequency equal to 1.488 Hz with a participating mass equal to 19.1%. The participating mass of the case study no. 2 is slightly smaller than that of the case study no 1. The participating masses for the first vertical, transverse and torsion vibration modes are reduced of about 79%, 27% and 73%, respectively, in comparison to those of the previous case study no. 1.
2.2. Truss Tower
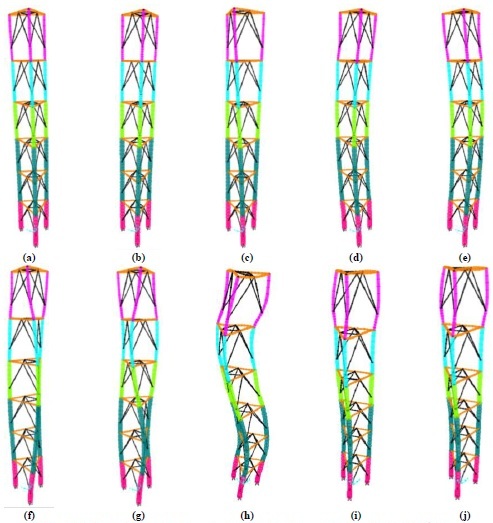
Similarly to truss roofs, light and high truss towers are very sensitive to corrosion because these structures do not have a protective screen. The examined case study is a truss tower with an equilateral triangular plan shape with sides of 4 m. The tower develops on six levels with a total height of 30 m. Fig. (7) shows the tower geometry and the FEM model used for analyses. Model contains 57 nodes, 126 frame elements and 3 nodes were restrained by pinned. Structure was modelled by beam elements.
The tower is made of columns with a variable S275 steel pipe section. From the ground to the top the cross-section varies from 700x8 mm to 300x8 mm. Perimeter beams are S275 steel pipe elements with a diameter equal to 200 mm and a thickness of 5 mm. The tower is loaded with a water tank of 300 kN at the top.
Fig. (8) shows the first ten mode shapes. Table 3 provides the first ten natural frequencies and their participating masses. The first two transverse modes have a frequency equal to 1.06 Hz with a participating mass equal to 59.5%. The first vertical mode has a frequency equal to 10.59 Hz and a participating mass equal to 48.7%. Finally, the first axial torsion mode has a frequency equal to 1.711 Hz and a participating mass equal to 57.5%.

| Mode | f (Hz) | UX | UY | UZ | RX | RY | RZ |
| 1 (1st horizontal y) | 1.066 | 0.019 | 0.595 | 0.000 | 0.594 | 0.018 | 0.000 |
| 2 (1st horizontal x) | 1.066 | 0.595 | 0.019 | 0.000 | 0.018 | 0.594 | 0.000 |
| 3 (1st axial torsion) | 1.711 | 0.000 | 0.000 | 0.000 | 0.000 | 0.000 | 0.575 |
| 4 | 4.833 | 0.017 | 0.117 | 0.000 | 0.069 | 0.010 | 0.000 |
| 5 | 4.833 | 0.117 | 0.017 | 0.000 | 0.010 | 0.069 | 0.000 |
| 6 | 5.333 | 0.000 | 0.000 | 0.000 | 0.000 | 0.000 | 0.120 |
| 7 | 10.007 | 0.000 | 0.000 | 0.000 | 0.000 | 0.000 | 0.050 |
| 8 | 10.167 | 0.017 | 0.031 | 0.000 | 0.031 | 0.016 | 0.000 |
| 9 | 10.167 | 0.031 | 0.017 | 0.000 | 0.016 | 0.031 | 0.000 |
| 10 (1st vertical) | 10.587 | 0.000 | 0.000 | 0.487 | 0.000 | 0.000 | 0.000 |
3. DYNAMIC VARIATION DUE TO CORROSION DEPTH PROPAGATION
3.1. Provisions from Codes and Literature
In general, indication on the durability of metal structures affected by corrosion are contained in both the main European and Italian structural codes. In the European context [65-67], directly refers to [68], where only general principles regarding the protection of steel buildings from possible causes of damage are provided. On the contrary, in the new Italian codes an important innovation, which considers damage due to atmospheric corrosion as an action of entropic nature, has been introduced. Generally speaking, with reference to steel structures, both European and Italian codes only provide durability criteria and no reference is made to models able to estimate the corrosion depth. In particular, only information regarding the minimum thickness required for structural members and a classification of the corrosivity of atmospheres are indicated. With regard to the first issue, the adoption of increased thickness both for hollow sections and parts of the structure not directly accessible are usually required. Increased thickness is equal to 2 mm for structures with a design life up to 100 years. Instead, with reference to corrosive atmospheres, a qualitative classification was introduced by [69, 70], where the following four typologies of atmospheres are identified according to their degree of corrosiveness:
- Rural atmosphere: countryside and small cities, where corrosion proceeds rather slowly;
- Urban atmosphere: densely populated areas, with meaningful industrial activities;
- Industrial atmosphere: areas subject to pollutants released by industrial systems;
- marine atmosphere: areas directly in contact with sea water or areas strongly affected by the marine aerosol presence.
A quantitative measurement of corrosivity due to different atmosphere types is provided by the EN ISO 12944-2/2001 standard [71], which defines six corrosion categories (Table 1). The identification of these categories is based on experimental investigations carried out on specimens exposed in some areas, opportunely chosen and monitored (EN ISO 9226/1992) [67]. Controls on the environment in order to estimate the temperature of the air, the rate of humidity, the direction and the speed of the wind, the frequency of atmospheric precipitation and the incidence of solar and ultraviolet, including the analysis of specimens, radiations are also required in order to measure the influence of such factors on the corrosion phenomenon.
Generally, from a climatic examination it is possible to draw rough conclusions about the behaviour of corrosion. In fact, the corrosivity rate of an atmosphere tends to increase from rural environments to a city, a coastal area or an industrial zone. The only atmospheres that almost completely inhibit the electrochemical aggression of metals are polar climates, that have temperatures below zero, and desert climates, characterised by very low r.h. rates. Therefore, in cold or dry climates the process is slower than in moderate climate area, while it is greater in warm/humid and marine climate zones. The EN ISO 9223/1992 [68] provides a corrosivity classification system to assess the influence of various factors on the damage process. This classification considers both the level of corrosive impurities, characterised by the presence of sulphur dioxide and chloride particles, and the “Time Of Wetness” (TOW), estimated as the number of hours where the relative humidity exceeds 80% and the temperature exceeds 0°C. The atmospheric parameters determining the corrosivity classification do not include the effects of the potentially important corrosive pollutants and impurities, such as NO2, hydrogen sulphide, chlorine gas, acid rain and other fumes that could be present in the general atmosphere or associated with specific environments.
As an alternative to the methodology proposed by the ISO standards, it is possible to classify atmosphere corrosivity using the PACER LIME algorithm. It measures the expected corrosion damage, related to various parameters opportunely evaluated. The most influential factor conditioning the corrosion phenomenon is the distance from the sea, because of hygroscopic salts. If such a distance turns out to be less than 4500 metres, the condition is much more severe, while for greater distances an estimate of the humidity influence is required. For r.h. greater than 60%, which corresponds to concentrations of 7.1∙g⋅m-3, the atmosphere is severe or moderate depending on the percentage of different corrosive agents. Obviously, the situation improves, in spite of the same concentrations of pollutants, if the humidity value is inferior to the 80% critical level.
Damage modelling based on atmospheric corrosion is given by different literature references with dissimilar approaches. The heuristic approach is based on a regression of experimental data. Some examples are given by [72-78]. In particular, the 2nd level models with a heuristic approach is obtai- ned from an observation and interpolation of experimental data, opportunely examined from a statistical point of view [15, 79]. All prediction models given by literature have an outline of the key assumptions (specific experimental dataset or explicit kinds of steel or different atmospheres) to compare the new proposed model.
Some of the first models were examined by [80-85] and they were based on experimental data regarding immersed corroded steel [86, 87]. modelled the degradation of paint coatings as well as the generation and the progress of the pitting points [88,89]. tested a ship hull girder subjected to corrosion and [90-93] worked on seawater ballast tank structures of ships [94, 95]. calibrated its model on environ- mental corrosion (i.e. non-immersed elements). Three models calibrated in atmosphere are given by [96, 97] and International Cooperative Programme (ICP). Differently, some examples of deterministic models are basically founded on corrosion mechanisms and are multi-scale models. Some of these models are listed in the following:
- GILDS (Gas - Interface - Liquid - Deposition - Electrodic - Solid) [98-105].
- MITReM (Multi-Ion Transport and Reaction Model) [106].
- ANN (Artificial Neural Network) algorithm [107-109].
Particularly noteworthy are recent studies as for example [110, 111], that investigate In-situ monitoring of corrosion-induced expansion and mass loss of steel bar in steel and fiber reinforced concrete using a distributed fiber optic sensor. These methods may be extended to steel structures.
3.2. Step by Step Corroded Structure Modal Analyses Results
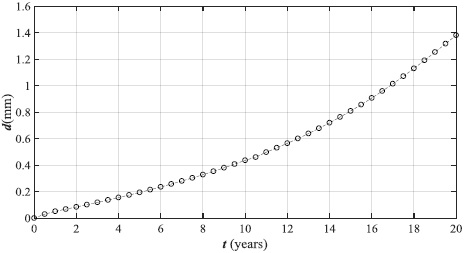
Based on the heuristic approach, the corrosion depth in this study was assumed variable according to the [112] curve given for mild carbon steel in marine atmosphere. The [112] curve is illustrated in Fig. (7) and shows that values were recorded for twenty years with the maximum value of depth (d) equal to about 1.4 mm.
As was previously discussed, the corrosion depth propagation in this study is modelled as a reduction of the pipe element thickness according to (Fig. 9). The modal analyses were repeated step by step by decreasing the pipe thickness in order to evaluate the natural frequencies and participating mass. As a consequence of corrosion depth, the structure mass decreases but the structural stiffness decreases faster. For this reason, the natural frequencies decrease as shown in Table 3.
| Mode | f (Hz) |
UX | UY | UZ | RX | RY | RZ |
| d=0.4 mm | |||||||
| 1 | 1.932 | 0.000 | 0.000 | 0.000 | 0.164 | 0.000 | 0.000 |
| 2 | 2.018 | 0.000 | 0.000 | 0.125 | 0.000 | 0.000 | 0.000 |
| 3 | 2.252 | 0.000 | 0.001 | 0.000 | 0.599 | 0.000 | 0.000 |
| 4 | 2.442 | 0.000 | 0.000 | 0.000 | 0.000 | 0.000 | 0.001 |
| 5 | 2.514 | 0.001 | 0.000 | 0.000 | 0.000 | 0.142 | 0.000 |
| 6 | 2.527 | 0.000 | 0.000 | 0.698 | 0.000 | 0.000 | 0.000 |
| 7 | 2.579 | 0.000 | 0.406 | 0.000 | 0.005 | 0.000 | 0.000 |
| 8 | 2.634 | 0.000 | 0.000 | 0.000 | 0.000 | 0.000 | 0.015 |
| 9 | 2.751 | 0.000 | 0.000 | 0.000 | 0.000 | 0.000 | 0.003 |
| 10 | 3.028 | 0.003 | 0.000 | 0.000 | 0.000 | 0.710 | 0.000 |
| d=0.8 mm | |||||||
| 1 | 1.841 | 0.000 | 0.000 | 0.000 | 0.161 | 0.000 | 0.000 |
| 2 | 1.932 | 0.000 | 0.000 | 0.124 | 0.000 | 0.000 | 0.000 |
| 3 | 2.175 | 0.000 | 0.001 | 0.000 | 0.603 | 0.000 | 0.000 |
| 4 | 2.288 | 0.000 | 0.000 | 0.000 | 0.000 | 0.000 | 0.001 |
| 5 | 2.372 | 0.001 | 0.000 | 0.000 | 0.000 | 0.138 | 0.000 |
| 6 | 2.462 | 0.000 | 0.000 | 0.697 | 0.000 | 0.000 | 0.000 |
| 7 | 2.520 | 0.000 | 0.401 | 0.000 | 0.005 | 0.000 | 0.000 |
| 8 | 2.576 | 0.000 | 0.000 | 0.000 | 0.000 | 0.000 | 0.014 |
| 9 | 2.628 | 0.000 | 0.000 | 0.000 | 0.000 | 0.000 | 0.005 |
| 10 | 2.930 | 0.003 | 0.000 | 0.000 | 0.000 | 0.714 | 0.000 |
| d=1.4 mm | |||||||
| 1 | 1.724 | 0.000 | 0.000 | 0.000 | 0.160 | 0.000 | 0.000 |
| 2 | 1.824 | 0.000 | 0.000 | 0.124 | 0.000 | 0.000 | 0.000 |
| 3 | 2.085 | 0.000 | 0.001 | 0.000 | 0.609 | 0.000 | 0.000 |
| 4 | 2.102 | 0.000 | 0.000 | 0.000 | 0.000 | 0.000 | 0.001 |
| 5 | 2.200 | 0.001 | 0.000 | 0.000 | 0.000 | 0.135 | 0.000 |
| 6 | 2.379 | 0.000 | 0.386 | 0.000 | 0.006 | 0.000 | 0.000 |
| 7 | 2.393 | 0.000 | 0.000 | 0.699 | 0.000 | 0.000 | 0.000 |
| 8 | 2.439 | 0.000 | 0.000 | 0.000 | 0.000 | 0.000 | 0.013 |
| 9 | 2.481 | 0.000 | 0.000 | 0.000 | 0.000 | 0.000 | 0.006 |
| 10 | 2.814 | 0.004 | 0.000 | 0.000 | 0.000 | 0.717 | 0.000 |
| D (mm) |
T (years) |
f (Hz) |
|||
|---|---|---|---|---|---|
| 1st Vertical |
1st Trasversal |
1st Torsional |
G (kN) |
||
| 0.00 | 1 | 2.53 | 2.58 | 3.03 | 1652.70 |
| 0.07 | 2 | 2.52 | 2.59 | 3.04 | 1649.17 |
| 0.15 | 3 | 2.51 | 2.59 | 3.05 | 1644.18 |
| 0.22 | 4 | 2.50 | 2.58 | 3.05 | 1637.71 |
| 0.29 | 5 | 2.49 | 2.56 | 3.05 | 1629.78 |
| 0.37 | 6 | 2.48 | 2.54 | 3.04 | 1620.39 |
| 0.44 | 7 | 2.46 | 2.52 | 3.03 | 1609.52 |
| 0.52 | 8 | 2.45 | 2.49 | 3.01 | 1597.19 |
| 0.59 | 9 | 2.43 | 2.46 | 2.99 | 1583.39 |
| 0.66 | 10 | 2.42 | 2.43 | 2.97 | 1568.12 |
| 0.74 | 11 | 2.41 | 2.41 | 2.95 | 1551.39 |
| 0.81 | 12 | 2.39 | 2.38 | 2.93 | 1533.18 |
| 0.88 | 13 | 2.38 | 2.36 | 2.91 | 1513.51 |
| 0.96 | 14 | 2.37 | 2.34 | 2.89 | 1492.38 |
| 1.03 | 15 | 2.37 | 2.32 | 2.87 | 1469.77 |
| 1.11 | 16 | 2.37 | 2.31 | 2.85 | 1445.70 |
| 1.18 | 17 | 2.37 | 2.32 | 2.83 | 1420.16 |
| 1.25 | 18 | 2.37 | 2.33 | 2.82 | 1393.15 |
| 1.33 | 19 | 2.38 | 2.35 | 2.82 | 1364.68 |
| 1.40 | 20 | 2.39 | 2.38 | 2.81 | 1334.73 |
3.2.1. Pitch Roof Structural Response Variation for Stiffness (1)
Table 3 summarizes some results for stiffness (1). Table 4 gives the natural frequencies and the participating mass of the first ten modes of three significant steps of variation with d equal to 0.4, 0.8 and 1.4 mm, respectively. In this study, the pipe sizes (i.e. diameter and thickness) were dimensioned so as not to exceed the stress limit under static loads. For this reason static collapses were excluded and the analyses were only focused on the structural sensitivity under wind action.
From the minimum to maximum d listed in Table 3, the first vertical frequency varied between 2.518 and 2.393 Hz (i.e. -5%). The participating mass for the first natural mode slightly varied by 0.7%, that corresponds to 1177 kg of mass considering that the structure weight is about 1652 kN. The first transversal natural frequency varied between 2.625 to 2.379 Hz (-10%). The participating mass decreased by 7% that corresponds to about 11773 kg of mass. Finally, the first torsional natural frequency varied between 3.030 Hz to 2.814 Hz (-7%). The participating mass increased by 0.85% that is equal to 1429.66 kg of mass. As was expected frequencies decreased even if the structural weight from zero to 1.4 mm of d varied between 1652 and 1335 kN (-20%).
Table 5 summarizes results for twenty steps (i.e. year by year) of the corrosion propagation. The variation of the first vertical and transversal natural frequencies shows quite an asymptotic trend for d greater than 0.8 mm. On the other hand, the first torsional natural frequency shows an asymptotic trend for d lower than 0.4 mm whereas it decreases linearly for d greater than 0.4 mm. The structural weight decreases as a parabolic trend.
3.2.2. Pitch Roof Structural Response Variation for Stiffness (2)
Table 6 gives the natural frequencies, the participating mass and the structural weight variation for stiffness (2). Results show that the participating mass remains quite constant for all values of d. It is equal to 30.0% for transversal, 13.8% for vertical and 19.1 for torsional mode. The first vertical frequency ranges from 1.593 Hz to 1.477 Hz; the first transversal frequency ranges from 0.468 Hz to 0.385 Hz; finally, the first torsional frequencies ranges from 1.461 Hz to 1.335 Hz.
The structural weight varies from 1201 kN to 1160 kN (-3%).
Table 7 summarizes the results for twenty steps (i.e. year by year) of the corrosion propagation. The variation of the first vertical and transversal natural frequencies shows quite an asymptotic trend for d greater than 0.8 mm. On the other hand, the first torsional natural frequency shows an asymptotic trend for d lower than 0.4 mm whereas it decreases linearly for d greater than 0.4 mm. The structural weight decreases as a parabolic trend.
3.2.3. Truss Tower Structural Response Variation
The corrosion depth propagation affects the dynamics of truss towers similarly to truss roofs. In this case, the frequency variations are small but significant. As the results listed in Table 8 show, for d ranging from 0.4 to 1.4 mm, the 1st horizontal mode shape had a frequency between 1.054 Hz and 1.019 Hz and a participating mass that varied from 61.0% to 60.0%. The first vertical frequency ranged from 10.399 Hz to 10.51 Hz and its participating mass from 49.1% to 50.1%. Finally, the first axial torsional frequency ranged from 1.701 Hz to 1.672 Hz and the participating mass was quite constant around 57.5%.
| Mode |
f (Hz) |
UX | UY | UZ | RX | RY | RZ |
|---|---|---|---|---|---|---|---|
| d=0.4 mm | |||||||
| 1 | 0.463 | 0.000 | 0.000 | 0.000 | 0.000 | 0.000 | 0.010 |
| 2 | 0.468 | 0.000 | 0.300 | 0.000 | 0.001 | 0.000 | 0.000 |
| 3 | 1.037 | 0.000 | 0.000 | 0.000 | 0.000 | 0.000 | 0.002 |
| 4 | 1.110 | 0.000 | 0.001 | 0.000 | 0.000 | 0.000 | 0.000 |
| 5 | 1.372 | 0.000 | 0.085 | 0.000 | 0.000 | 0.000 | 0.000 |
| 6 | 1.461 | 0.000 | 0.000 | 0.000 | 0.191 | 0.000 | 0.000 |
| 7 | 1.593 | 0.000 | 0.000 | 0.138 | 0.000 | 0.000 | 0.000 |
| 8 | 1.706 | 0.000 | 0.000 | 0.000 | 0.000 | 0.000 | 0.001 |
| 9 | 1.844 | 0.000 | 0.000 | 0.000 | 0.000 | 0.000 | 0.000 |
| 10 | 1.845 | 0.000 | 0.000 | 0.000 | 0.000 | 0.000 | 0.000 |
| d=0.8 mm | |||||||
| 1 | 0.429 | 0.000 | 0.000 | 0.000 | 0.000 | 0.000 | 0.009 |
| 2 | 0.435 | 0.000 | 0.295 | 0.000 | 0.001 | 0.000 | 0.000 |
| 3 | 0.962 | 0.000 | 0.000 | 0.000 | 0.000 | 0.000 | 0.002 |
| 4 | 1.029 | 0.000 | 0.001 | 0.000 | 0.000 | 0.000 | 0.000 |
| 5 | 1.273 | 0.000 | 0.087 | 0.000 | 0.000 | 0.000 | 0.000 |
| 6 | 1.410 | 0.000 | 0.000 | 0.000 | 0.190 | 0.000 | 0.000 |
| 7 | 1.547 | 0.000 | 0.000 | 0.138 | 0.000 | 0.000 | 0.000 |
| 8 | 1.582 | 0.000 | 0.000 | 0.000 | 0.000 | 0.000 | 0.001 |
| 9 | 1.863 | 0.000 | 0.000 | 0.000 | 0.000 | 0.000 | 0.000 |
| 10 | 1.864 | 0.000 | 0.000 | 0.000 | 0.000 | 0.000 | 0.000 |
| d=1.4 mm | |||||||
| 1 | 0.378 | 0.000 | 0.000 | 0.000 | 0.000 | 0.000 | 0.009 |
| 2 | 0.385 | 0.000 | 0.290 | 0.000 | 0.001 | 0.000 | 0.000 |
| 3 | 0.848 | 0.000 | 0.000 | 0.000 | 0.000 | 0.000 | 0.002 |
| 4 | 0.908 | 0.000 | 0.001 | 0.000 | 0.000 | 0.000 | 0.000 |
| 5 | 1.123 | 0.000 | 0.090 | 0.000 | 0.000 | 0.000 | 0.000 |
| 6 | 1.335 | 0.000 | 0.000 | 0.000 | 0.188 | 0.000 | 0.000 |
| 7 | 1.393 | 0.000 | 0.000 | 0.000 | 0.000 | 0.000 | 0.001 |
| 8 | 1.477 | 0.000 | 0.000 | 0.138 | 0.000 | 0.000 | 0.000 |
| 9 | 1.678 | 0.000 | 0.011 | 0.000 | 0.000 | 0.000 | 0.000 |
| 10 | 1.841 | 0.000 | 0.000 | 0.000 | 0.642 | 0.000 | 0.000 |
| D (mm) |
T (years) |
f (Hz) |
|||
|---|---|---|---|---|---|
| 1st vertical |
1st trasversal |
1st torsional |
G (kN) |
||
| 0.00 | 1 | 0.68 | 0.63 | 1.83 | 1201.10 |
| 0.07 | 2 | 0.69 | 0.61 | 1.47 | 1200.43 |
| 0.15 | 3 | 0.69 | 0.61 | 1.17 | 1199.61 |
| 0.22 | 4 | 0.70 | 0.61 | 0.94 | 1198.63 |
| 0.29 | 5 | 0.70 | 0.62 | 0.76 | 1197.50 |
| 0.37 | 6 | 0.71 | 0.63 | 0.63 | 1196.21 |
| 0.44 | 7 | 0.71 | 0.65 | 0.54 | 1194.77 |
| 0.52 | 8 | 0.71 | 0.67 | 0.49 | 1193.17 |
| 0.59 | 9 | 0.71 | 0.69 | 0.47 | 1191.42 |
| 0.66 | 10 | 0.72 | 0.71 | 0.48 | 1189.52 |
| 0.74 | 11 | 0.72 | 0.73 | 0.50 | 1187.46 |
| 0.81 | 12 | 0.72 | 0.75 | 0.54 | 1185.24 |
| 0.88 | 13 | 0.72 | 0.77 | 0.58 | 1182.88 |
| 0.96 | 14 | 0.72 | 0.78 | 0.62 | 1180.35 |
| 1.03 | 15 | 0.72 | 0.79 | 0.66 | 1177.68 |
| 1.11 | 16 | 0.72 | 0.80 | 0.68 | 1174.84 |
| 1.18 | 17 | 0.72 | 0.80 | 0.69 | 1171.86 |
| 1.25 | 18 | 0.72 | 0.79 | 0.67 | 1168.72 |
| 1.33 | 19 | 0.72 | 0.77 | 0.63 | 1165.42 |
| 1.40 | 20 | 0.72 | 0.75 | 0.54 | 1161.97 |
| Mode |
f (Hz) |
UX | UY | UZ | RX | RY | RZ |
|---|---|---|---|---|---|---|---|
| d=0.4 mm | |||||||
| 1 | 1.054 | 0.610 | 0.004 | 0.000 | 0.004 | 0.612 | 0.000 |
| 2 | 1.054 | 0.004 | 0.610 | 0.000 | 0.612 | 0.004 | 0.000 |
| 3 | 1.701 | 0.000 | 0.000 | 0.000 | 0.000 | 0.000 | 0.575 |
| 4 | 4.877 | 0.015 | 0.117 | 0.000 | 0.068 | 0.009 | 0.000 |
| 5 | 4.877 | 0.117 | 0.015 | 0.000 | 0.009 | 0.068 | 0.000 |
| 6 | 5.374 | 0.000 | 0.000 | 0.000 | 0.000 | 0.000 | 0.119 |
| 7 | 10.106 | 0.000 | 0.000 | 0.000 | 0.000 | 0.000 | 0.050 |
| 8 | 10.264 | 0.042 | 0.006 | 0.000 | 0.006 | 0.041 | 0.000 |
| 9 | 10.264 | 0.006 | 0.042 | 0.000 | 0.041 | 0.006 | 0.000 |
| 10 | 10.399 | 0.000 | 0.000 | 0.491 | 0.000 | 0.000 | 0.000 |
| d=0.8 mm | |||||||
| 1 | 1.041 | 0.601 | 0.012 | 0.000 | 0.013 | 0.606 | 0.000 |
| 2 | 1.041 | 0.012 | 0.601 | 0.000 | 0.606 | 0.013 | 0.000 |
| 3 | 1.690 | 0.000 | 0.000 | 0.000 | 0.000 | 0.000 | 0.574 |
| 4 | 4.923 | 0.014 | 0.117 | 0.000 | 0.066 | 0.008 | 0.000 |
| 5 | 4.923 | 0.117 | 0.014 | 0.000 | 0.008 | 0.066 | 0.000 |
| 6 | 5.418 | 0.000 | 0.000 | 0.000 | 0.000 | 0.000 | 0.117 |
| 7 | 10.201 | 0.000 | 0.000 | 0.495 | 0.000 | 0.000 | 0.000 |
| 8 | 10.209 | 0.000 | 0.000 | 0.000 | 0.000 | 0.000 | 0.050 |
| 9 | 10.362 | 0.048 | 0.000 | 0.000 | 0.000 | 0.047 | 0.000 |
| 10 | 10.362 | 0.000 | 0.048 | 0.000 | 0.047 | 0.000 | 0.000 |
| d=1.4 mm | |||||||
| 1 | 1.019 | 0.600 | 0.014 | 0.000 | 0.014 | 0.609 | 0.000 |
| 2 | 1.019 | 0.014 | 0.600 | 0.000 | 0.609 | 0.014 | 0.000 |
| 3 | 1.672 | 0.000 | 0.000 | 0.000 | 0.000 | 0.000 | 0.574 |
| 4 | 4.995 | 0.007 | 0.122 | 0.000 | 0.066 | 0.004 | 0.000 |
| 5 | 4.995 | 0.122 | 0.007 | 0.000 | 0.004 | 0.066 | 0.000 |
| 6 | 5.488 | 0.000 | 0.000 | 0.000 | 0.000 | 0.000 | 0.115 |
| 7 | 9.882 | 0.000 | 0.000 | 0.501 | 0.000 | 0.000 | 0.000 |
| 8 | 10.373 | 0.000 | 0.000 | 0.000 | 0.000 | 0.000 | 0.051 |
| 9 | 10.511 | 0.046 | 0.002 | 0.000 | 0.002 | 0.045 | 0.000 |
| 10 | 10.511 | 0.002 | 0.046 | 0.000 | 0.045 | 0.002 | 0.000 |
| D (mm) |
T (years) |
f (Hz) |
|||
|---|---|---|---|---|---|
| 1st horizontal |
1st vertical |
1st torsional |
G (kN) |
||
| 0.00 | 1 | 1.07 | 10.59 | 1.71 | 252.42 |
| 0.07 | 2 | 1.06 | 10.56 | 1.71 | 250.77 |
| 0.15 | 3 | 1.06 | 10.53 | 1.71 | 248.98 |
| 0.22 | 4 | 1.06 | 10.50 | 1.71 | 247.07 |
| 0.29 | 5 | 1.06 | 10.47 | 1.71 | 245.06 |
| 0.37 | 6 | 1.06 | 10.44 | 1.70 | 242.96 |
| 0.44 | 7 | 1.05 | 10.40 | 1.70 | 240.78 |
| 0.52 | 8 | 1.05 | 10.36 | 1.70 | 238.54 |
| 0.59 | 9 | 1.05 | 10.32 | 1.70 | 236.24 |
| 0.66 | 10 | 1.05 | 10.28 | 1.69 | 233.91 |
| 0.74 | 11 | 1.04 | 10.24 | 1.69 | 231.56 |
| 0.81 | 12 | 1.04 | 10.20 | 1.69 | 229.20 |
| 0.88 | 13 | 1.04 | 10.16 | 1.69 | 226.85 |
| 0.96 | 14 | 1.04 | 10.12 | 1.69 | 224.51 |
| 1.03 | 15 | 1.03 | 10.08 | 1.68 | 222.21 |
| 1.11 | 16 | 1.03 | 10.04 | 1.68 | 219.95 |
| 1.18 | 17 | 1.03 | 10.00 | 1.68 | 217.76 |
| 1.25 | 18 | 1.02 | 9.96 | 1.68 | 215.64 |
| 1.33 | 19 | 1.02 | 9.92 | 1.67 | 213.61 |
| 1.40 | 20 | 1.02 | 9.88 | 1.67 | 211.68 |
Table 9 summarizes the frequencies and structural weight values as function of d. The structural weight decreased from 252.42 kN to 211.68 kN (-17%) with d measuring 0 to 1.4 mm. The frequency values decreased parabolically. The first horizontal, vertical and torsional frequencies decreased by 5%, 7% and 3% respectively.
4. WIND - STRUCTURE INTERACTION AS FUNCTION OF THE CORROSION DEPTH PROPAGATION
4.1. Wind-corroded Structure Interaction: Pitch Roof with Stiffness (2)
The first vertical frequency of the structure with stiffness (2) is lower than (1) by 75%. According to the CNR-DT 207 standard (2008) [64], dynamic peak actions are equal to equivalent static actions if the first natural frequency is greater than 1.5 Hz. These values are greater than the first vertical, transversal and torsional natural frequencies for stiffness (2) for all values of d except the first torsional frequency for d which equals zero.
The wind-induced response was studied in terms of the critical vortex shedding speed given as Eq.1 [64]. The critical vortex shedding vcr,i (Eq.1) was estimated using the first vertical, transversal and torsional natural frequency for wind action parallel to the smaller side of the roof plan (b is equal to 20 m).

where St is the Strouhal number which is assumed equal to 0.11 and was estimated according to the [64] for a thin rectangular shape (bigger side/smaller side equal to 5) section. n1,y varies according to Tables 4 and 6. The mean value of the wind velocity is equal to 34.20 m/s (i.e.TR0 = 50 yrs) and 41.26 m/s (i.e.TR0 = 500 yrs).
As was expected, though the critical vortex shedding is greater than the wind speed, results showed that it varied from 131 to 124 m/s for vertical, from 145 to 111 m/s for transversal and from 333 to 85 m/s for torsional frequency. It is important to note that corrosion depth after 20 years reduces the critical vortex shedding value by 75%.
It is reasonable to think that structural thickness reduction also affects aerodynamic damping. According to the [64], aerodynamic damping is a function of the frequency, the pressure coefficient, the mean wind velocity and the roof geometry. When the structural frequency decreases the aerodynamic damping increases. For this reason, in this case reduced stiffness due to corrosion depth gives a positive effect under wind. It varies from 0.29% to 0.31% for vertical frequency; from 2.39% to 3.27% for transversal and from 1.19% to 4.24% for torsional frequency. Considering a structural damping equal to 2%, the estimated aerodynamic damping for the first vertical mode is about 1/6.
4.2. Wind-corroded Structure Interaction: Truss Tower
For the case regarding the truss tower, the instability caused by vortex shedding is more probable than for roofs. The reduced value between the maximum side size and the height increases the sensitivity to aeroelastic phenomena. In this case, the ratio is about 0.13. In order to have a measurement of the critical vortex shedding velocity, the Strouhal number is estimated at 0.13 (CNR-DT 207, 2008). The vortex shedding velocity for the horizontal modes decreases from 33 m/s to 31 m/s and the aerodynamic damping increases from 2.3 to 2.5%, considering d from 0 to 1.4 mm. This percentages are not neglecting because the structural damping is between 0.2 and 2%.
The wind-induced response will be studied also in terms of galloping and in terms of peak accelerations. The galloping critical speed is given as [64]:

where b is the crosswind dimension of the building (equal to 4 m), n1,y is the factor of galloping instability, prudently estimated at 10, Sc is the Scruton number given as:

where ξi is the total damping ratio (that is the sum between structural damping and aerodynamic damping) and me,1 which is the generalized mass per unit length for the first mode me preliminary assumed as the mass for unit length at 2/3 of H [64].
For the truss tower study the Scruton number varied from 23.3 to 20.0 (-17%) whereas the critical velocity of galloping ranged between 19.9 m/s and 16.3 m/s. (-22%). The last results were significant because the galloping velocity was low with d equal to zero, however it decreased significantly for d equal to 1.4 mm.
CONCLUSION
The structure-corrosion depth propagation interaction was investigated by modelling the corrosion depth propagation as a reduction of thickness in mild carbon steel elements. In order to investigate the effects on structural stiffness, decreasing modal and wind-structure interaction analyses were computed on FE models by assuming as case studies: a pitch truss roof and a truss tower. In particular, two configurations of stiffness were considered for the pitch truss roofs. The corrosion depth propagation was estimated by using literature, and analyses were repeated step by step reducing the steel elements’ thickness. Results have confirmed that the structural frequencies vary quite linearly as function of the decrease in weight for all structures considered. In addition, the participating mass of the modes varied significantly in particular for torsional mode in the case of roofs. The wind-structure interaction was discussed estimating aerodynamic damping, critical vortex shedding velocity and, for the tower, critical galloping velocity as function of the corrosion depth. Results have shown that corrosion increases aerodynamic damping but significantly decreases the critical vortex shedding and galloping velocity.
CONSENT FOR PUBLICATION
Not applicable.
AVAILABILITY OF DATA AND MATERIALS
The data that support the findings of this study are available from the corresponding author upon request.
FUNDING
None.
CONFLICT OF INTEREST
The authors declare no conflict of interest, financial or otherwise.
ACKNOWLEDGEMENTS
Declared none.

