All published articles of this journal are available on ScienceDirect.

Ductile Compressive Failure of Concrete Reinforced with High Strength Carbon Hybrid Composite
Abstract
Background:
For centuries, steel rebar has been the primary reinforcement in concrete despite its major drawbacks, such as its heavy weight, high electrical conductivity, and corrosiveness. Thus, in response to the need for better alternatives, innovative Hybrid Composite (HC) reinforcements have been developed.
Objective:
The focus of this paper is to investigate the performance of tubular HC reinforcements in concrete columns under axial compressive loading.
Method:
Concrete columns of different sizes were tested.
Results and Conclusion:
For the small columns, HC reinforced columns showed very high load capacity, which was more than 3 times the capacity of plain concrete. Moreover, significant ductility was achieved with an ultimate strain of up to 59%. For the large columns, HC reinforced columns showed similar load capacities, but much larger ultimate strains in comparison to the corresponding steel reinforced concrete columns.
1. INTRODUCTION
Steel reinforced concrete is a cost-effective material used for constructing the bulk of the world's buildings and infrastructure. However, the ingress of aggressive substances from the environment, such as chloride ions from seawater and de-icing salts, results in steel corrosion. Corrosion causes the formation of expansive oxides, which cause cracks and subsequent spalling off of the concrete cover. Eventually, corrosion will reduce bar diameters to potentially unsafe values that may lead to structural collapse. Therefore, corrosion of steel reinforcements is one of the main causes of damage to concrete structures. In many cases, maintenance and repair costs have constituted the major part of the total costs over the lifespan of structures [1-3]. The National Association of Corrosion Engineers and the Federal Highway Administration estimated the cost of corrosion damage to concrete structures in the US to be approximately $125 billion per year in 2001 [4]. According to the US Department of Commerce Census Bureau, the annual direct cost of corrosion on highway bridges alone was estimated to range from $6.43 billion to $10.15 billion. Life-cycle analyses estimated indirect costs to users due to traffic delays and lost productivity to be more than 10 times the direct cost of corrosion repair [4]. Recent data estimated that the US will have to spend as much as 5% of its Gross National Product (GNP) (the equivalent of over $600 billion/year) for infrastructure repair, replacement, and expansion [5]. Not only the search to improve construction materials and infrastructure is a critical issue in the US, but it is also becoming an urgent global need. The cost of corrosion damage related to reinforced concrete structures is estimated to be in the order of 1% of the GNP’s of other developed countries [6]. As a result of the abovementioned problems, addressing rebar corrosion has become a very high priority.
In light of the steel corrosion problem, in the last two decades, interests in non-corrosive alternatives, such as Fiber Reinforced Polymer (FRP) bars, have grown. FRP bars have been used to replace traditional steel reinforcements in a small number of concrete structures in the US and around the world. As of 2012, FRP bars have been used in 50 bridge decks in 15 states in the US [7]. The volume of FRP bars has been estimated to be in excess of 5000 tonnes per year [8]. However, the transition from steel to FRP reinforcements has not been on a massive scale because of technical issues and cost concerns involving the FRP solid bars.
FRP solid bars are composed of two basic elements, fibers and a resin matrix, and are typically manufactured by pultrusion. Common fiber types include carbon and glass. A variety of commercially produced tendons are currently available.
Test results show that the tensile stress-strain curves of Carbon-FRP bars are linear up to failure. A typical ultimate tensile strength is at least 218 ksi (1500 MPa), which is 3 times than that of steel rebar. The typical modulus of elasticity of Carbon-FRP bars is 19 Msi (128 GPa), about 65% to that of steel. Carbon-FRP bars exhibited almost the same bond strength to concrete as similar diameter steel rebars [9]. As for Glass FRP bars, a typical tensile strength is 110 ksi (760 MPa) and the modulus of elasticity is 5.9 Msi (40.8 GPa), which is much lower than that of steel.
Other than 1-D FRP bars, 2-D FRP grids and 3-D FRP cages have also been developed [10-15]. At present, FRP bars are used as primary reinforcements in concrete structures; FRP grids and cages are much less frequently used and they are often only used as secondary reinforcements to control shrinkage cracking. In very limited applications when the loadings were very small, FRP rigid grids were used as flat, two-dimensional flexural reinforcements in slabs or three-dimensional cages for combined shear and axial reinforcement in beams [16]. For concrete beams reinforced with FRP bars, moment-curvature relationships very close to those of steel-reinforced beams have been confirmed [17-19]. The Beddington Trail Bridge in Calgary, Alberta was constructed with carbon FRP bars in 1993. In November 2004, the bridge was tested again with the same testing vehicle and weight. The test results confirmed that the carbon FRP bars have maintained their durability over the years and have performed as they were designed in 1993 [20].
FRP solid bars show great potential [18], but major technical challenges remain, including a lack of reinforcement ductility and installation difficulties. FRP materials usually exhibit an unyielding elastic behavior up to the point of rupture, hence FRP bars have low ductility. Steel has a very high malleability, allowing dimensional adjustments and hook-bending on the site as needed. On the other hand, the hardened resin of FRP bars becomes permanently cross-linked and cannot be bent or reshaped on site. The manufacturing process requires strict adherence to the specifications of FRP bar dimensions, including length and bent configuration. FRP manufacturers must conduct all necessary bending of FRP bars prior to their shipment to construction sites. On-site adjustments are very limited and it is very difficult to bend FRP bars for proper connections when needed. These issues largely stem from the basic design concept of FRP bars, which attempts to emulate solid steel rebars.
Therefore, recent focus has turned towards research to find alternatives that will solve some of these problems. As reported in this paper, preliminary test results on the performance of an innovative Hybrid Composite (HC) reinforcement used as primary reinforcement in concrete columns were presented. Different types of HC reinforcement were produced and tested. Their performance was compared to the performance of the corresponding steel reinforced concrete columns.
2. EXPERIMENTAL PROGRAM
The experiments in this research consisted of testing a large number of cylindrical columns reinforced with custom made high strength carbon HC Reinforcements in different sizes, configurations, and reinforcement schemes.
These experiments were performed in two phases. Phase I consisted of making 3-inch (7.6 cm) diameter by 6-inch (15.2 cm) height cylindrical samples with 2 layers of HC reinforcements, herein referred to as small columns. Using the experience acquired from Phase I, Phase II consisted of making larger column samples that were 6-inch (15.2 cm) diameter by 18 to 30 inches (45.7 to 76.2 cm) in height. One to three layers of HC reinforcements were used separately, representing different reinforcement ratios.
2.1. Hybrid Composite Reinforcement
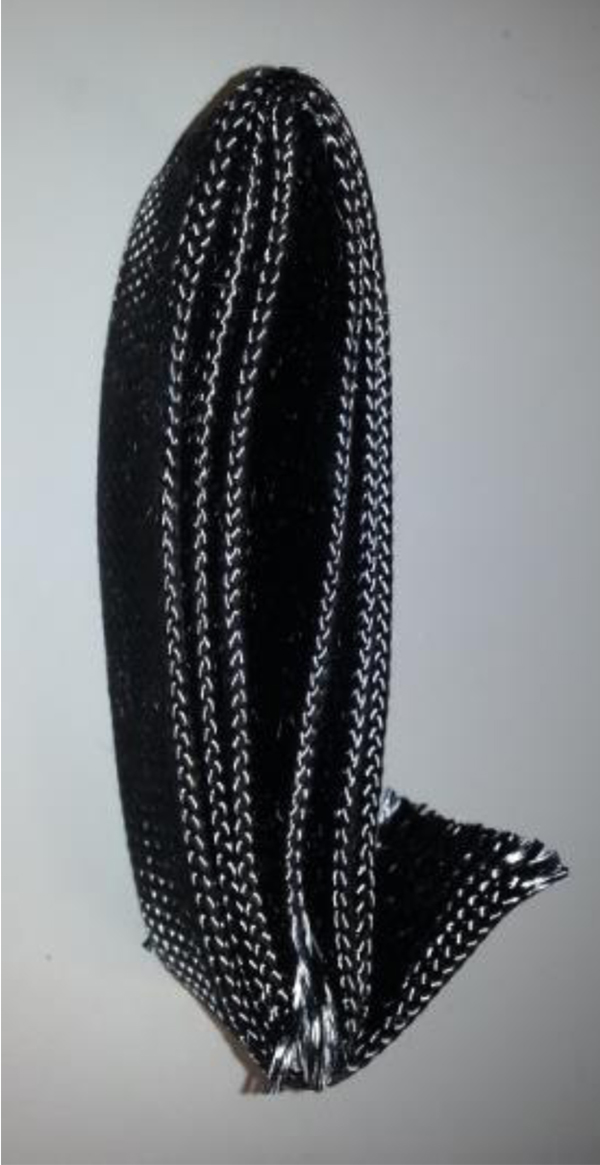
HC reinforcement, made from various pattern fiber bundles, is preformed to various geometric shapes including flat plate, curved plate, and circular tubes. Specific shapes and dimensions are designed for shear, flexure, compression, and ductility capacity for concrete structures in place of steel reinforcement. In this study, HC reinforcement is made of a carbon fiber fabric in the form of a very flexible tube to be used as longitudinal reinforcement and confinement for cylindrical concrete columns. Such tubular structures can be produced by weaving, braiding, or knitting. The angles between the interlocking fiber strands should be properly designed in order to tailor the load-deformation behavior of HC reinforcement, which must depend on specific structural requirements. Interlocking strands of various angles can produce a wide range of increases in fabric ductility since load transfer after a local strand rupture is possible to occur via a lock-up mechanism involving strand waviness and overall failure can be delayed until all adjacent strands rupture. The flexibility of HC reinforcement has many advantages. The material can be produced in almost any length, and it is easy to fold, unfold, and pack, which makes it easy to transport (Fig. 1). It is also easy to handle, and can be conveniently cut to any desired length. Different reinforcement ratios can be readily achieved by repeatedly folding HC reinforcement as needed. Such measurements of reinforcement ratios are represented by the number of layers of HC reinforcement in this paper.
Two different fiber tows were used in this study, namely Heavy HC (19.9 oz/yd2 or 674.8 g/m2) and Light HC (7.5 oz/yd2 or 254.3 g/m2) in reference to their comparative unit weights. The properties of HC reinforcement are presented in Table 1. Other fiber types and their hybrids can be also used with any tow size.
| Material | Nominal Thickness (mm) | Density (g/m2) | Axial Modulus (GPa) |
Transverse Modulus (GPa) | Axial Strength (MPa) | Transverse Strength (MPa) |
|---|---|---|---|---|---|---|
| Light HC | 0.32 | 254.3 | 13.8 | 50.3 | 96.5 | 572.3 |
| Heavy HC | 0.79 | 674.8 |
2.2. Concrete Mix Proportions
The concrete used in Phase I (small columns) was composed of Type I Portland Cement, coarse aggregates consisting of an equal amount of crushed limestone and natural gravel, 2-NS sand, and water. The mix proportions are presented in Table 2.
| Concrete Material | Quantity (kg/m3) |
|---|---|
| Cement | 353 |
| Crushed Lime-Stone (coarse aggregate) | 566.75 |
| Natural gravel (coarse aggregate) | 566.75 |
| 2-NS Sand (fine aggregate) | 687.0 |
| Water | 197.0 |
In Phase II, the same mix proportions but different mix constituents, a different type of cement and coarse aggregate, were used. The cement was acquired from a local cement supplier, which satisfied ASTM C 150 (1990) and AASHTO M 85 (1986) for both Type I and Type II Portland Cement. All-Purpose Gravel was also acquired from the same local supplier and was used as coarse aggregate. The maximum aggregate size was 0.5 inches (12.7 mm). This gravel was in accordance with ASTM C 33 for application in concrete. The 2-NS Sand that was used in Phase I was also used in Phase II.
2.3. Mixing and Sampling Procedure
Mixing was performed in general accordance with ASTM C 192 (2007). The dry components were mixed first for about two to three minutes until the mix was fairly uniform before water was added and mixed further for another three minutes to ensure proper consistency throughout.
2.3.1. Three-inch Small Column
The small columns were produced using standard 3-inch (7.6 cm) by 6-inch (15.2 cm) cylinder molds. Both columns with and without a concrete cover were prepared. A concrete cover was included in the test to serve as a protection of the HC reinforcement and to provide a warning when a column is overloaded. For the columns with a concrete cover, HC reinforcement was cut to 6 inches (15.2 cm) of height. It was then wrapped around a 2-inch (5.1 cm) outer diameter plastic pipe during casting to ensure that the cross section stays uniform throughout the height of the column and to prevent the confined portion of the column from shifting from the center of the mold, when concrete or mortar cover was applied on the outside of the reinforcement. The cover was approximately 0.5 inches (1.3 cm) thick around the reinforcement.
For the mortar cover columns, the mix proportions of the mortar were the same as the concrete mix proportions used in this phase. The only difference was that in the case of the mortar, no coarse aggregate was used in the mix.
The casting pipe was progressively removed during sampling to let the concrete completely fill the HC reinforcement. When concrete or mortar cover was required, the pipe was removed on stages to prevent the confined concrete from shifting from the center. After the concrete was poured into the pipe, it was raised in 2 to 3-inch (5.1 to 7.6 cm) increments and concrete (or mortar) was poured around the concrete to fill the space between the mold and the reinforcement.
For those columns without a cover, the HC reinforcement was extended to the full extent of the 3-inch (7.6 cm) mold. The HC was extended out of the mold at the bottom and the top to secure the HC reinforcement in the mold during casting.
After casting, all columns were kept on a vibrator for about three minutes until all of the visible bubbles created by the air pockets in the concrete disappeared. After sampling, the columns were left in the laboratory for a period of 24 hours after which they were placed in water for curing for a period of 7 days.
2.3.2. Six-inch Large Column
Phase II of this research consisted of a single batch of nine 6-inch (15.2 cm) diameter columns including 2 base columns made of Reinforced Concrete (RC). The RC columns were included in this research to constitute a base of comparison between the HC reinforcement and the steel reinforcement.
Since the concrete cover was found to have very little influence on the capacity of the small columns in Phase I, the large HC columns were all cast without concrete cover.
2.3.2.1. RC Column Design
The RC column was designed in accordance with ACI 318-08 (2008), using the minimum requirements of the code. The minimum cross-sectional requirements for longitudinal reinforcements in section 10.9 of ACI 318-08 (2008) require one percent of the gross cross-sectional area of the column, in this case 0.28 in2 (1.81 cm2). Also, for circular columns, the minimum number of bars is 6. Therefore, six #3 deformed bars of grade 60 (yield strength of 60 ksi or 414 MPa) were chosen for longitudinal rebar with a cross-sectional area of 0.66 in2 (4.26 cm2), which is greater than required. The maximum reinforcement ratio allowed by ACI 318-08 (2008) was 0.08 which yields a value of 2.24 in2 (14.45 cm2) and is larger than provided.
For spiral reinforcement the minimum volumetric spiral reinforcement ratio required from equation 10-5 in section 10.9 is 0.012. A ¼ inch (0.64 cm) smooth rebar was selected for transverse reinforcement. The volumetric ratio was 0.013, higher than the requirement of 0.012. Three-inch (7.6 cm) pitch spacing was provided, the maximum allowable by ACI 318-08 (2008). The outer diameter of the spirals was 5 inches (12.7 cm), leaving a ½ inch (1.3 cm) cover around the reinforcement. The spirals were then tied to the longitudinal reinforcement to form a rebar cage. Two wooden spacers were used to ensure that the reinforcement cage is centered in the formwork.
Cardboard tubes were used as formwork. The tubes were 6 inches (15.2 cm) in diameter and 30 inches (76.2 cm) in height. Mixing was performed in the same manner as explained earlier in Phase I. Six-inch diameter (15.2 cm) heavy tow carbon (same as in small columns) HC reinforcements were used in Phase II. During casting, the HC reinforcement was extended to the full extent of the formwork. After casting, the samples were left under room conditions in the laboratory for 24 hours. The samples were then placed in water for a curing period of 7 days.
2.4. Testing
Compression testing was performed in general accordance with ASTM C39/C39M “Test Method for Compressive Strength of Cylindrical Concrete Specimens” (2009). A high–capacity MTS testing machine was used. The machine was operated under displacement control at a rate of 0.01 mm/sec. The MTS machine was equipped with internal load cell and linear variable differential transformer. Loads and crosshead displacements were continuously recorded and later used in the calculation of axial stresses and axial strains by dividing the loads and the crosshead displacements by the nominal cross sectional areas and the initial heights of the specimens, respectively. In addition to strength, failure mode is an important factor to understand the internal and external behaviors of the column. The different failure modes that were observed will be presented and discussed.
3. TEST RESULTS AND DISCUSSIONS
3.1. Small Columns
The notation scheme that was adopted for this phase was a sequence in the following order with a dash in-between:
L(H)-CC(NC,MC)-sample number
where L-Light HC, H-Heavy HC; CC-Concrete Cover, MC-Mortar Cover, NC-No Cover, PC-plain concrete
3.1.1. Test Results
Table 3 presents a summary of the results in terms of stress and strain. The plain concrete results refer to an average of the concrete strength of eight samples taken from all of the batches that were represented in this table.
| Sample | Cross Section Area cm2 (in2) | Height cm (in) |
Maximum Capacity | Ultimate Strain | ||
|---|---|---|---|---|---|---|
| Stress MPa (psi) |
Corresponding Strain (%) | (%) | ||||
| Light HC | L-NC-1 | 31.68 (4.91) | 12.7 (5) | 79.6 (11,546) | 6.4 | 6.5 |
| L-NC-2 | 36.97 (5.73) | 12.95 (5.1) | 71.97 (10,438) | 4.9 | 5.3 | |
| L-NC-3 | 36.97 (5.68) | 13.97 (5.5) | 73.41 (10,648) | 4.3 | 4.4 | |
| Heavy HC | H-NC-1 | 31.68 (4.91) | 13.97 (5.5) | 58.2 (8,442) | 14.4 | 20.1 |
| H-NC-2 | 32.9 (5.1) | 11.94 (4.7) | 63.2 (9,165) | 17.17 | 57.5 | |
| H-NC-3 | 33.29 (5.16) | 13.21 (5.2) | 58.4 (8,464) | 14.67 | 40.5 | |
| H-NC-4 | 33.29 (5.16) | 13.97 (5.5) | 53.1 (7,696) | 13.27 | 43.5 | |
| H-NC-5 | 33.29 (5.16 | 13.97 (5.5) | 43.8 (6,346) | 16.55 | 59.5 | |
| H-CC-1 | 45.61 (7.07) | 15.24 (6) | 40.3* (5,852*) | 33.5 | >38# | |
| H-MC-1 | 45.61 (7.07) | 15.24 (6) | 47.0* (6,817*) | 6.33 | 14.5 | |
| H-MC-2 | 45.61 (7.07) | 15.24 (6) | 49.2* (7,131*) | 14 | 39.2 | |
| Plain Concrete | PC1 | 45.61 (7.07) | 15.24 (6) | 20.1 (2,915) | 1.5 | - |
It should be noted that the columns with some kind of cover had a smaller cross section after the peak load once the cover had spalled off. Therefore, the actual stress capacity might be higher than the nominal strength that is determined from the original areas. The ultimate strain was determined to be at 60% of the peak loads on the descending portion of the curve when there was only a single peak or at 60% of the peak loads on the second ascending portion of the curve whenever there was a second peak.
In general the light HC showed a higher load capacity than other columns, with a maximum stress capacity around 11 ksi (75.8 MPa). That is more than 3.5 times the capacity of the plain concrete and about 1.3 times the stress capacity of the heavy HC. Inversely, the maximum strain is relatively low at about 5.2% on average. That is still about three times more than plain concrete but far less than the heavy HC which ranges from 13.3% to 17.2% strain. The load-displacement curves of all light HC samples show a monotonically descending behavior after passing the peak loads. Hence the ultimate strains, defined at the 60% of the peak loads, are close to their maximum strains. On the other hand, a second rising portion is present for the heavy HC samples, which greatly increase their ultimate strains ranging from 20% to 60%.
The overall capacity and to a greater extent the ultimate strain was influenced largely by the failure mode. Sudden global rupture of the HC reinforcement in the case of light HC columns resulted in a higher load capacity and lower displacement. On the other hand, heavy HC columns showed a progressive contraction of the HC reinforcement from the very top (i.e. the HC reinforcement retracted and exposed the top concrete) with a small and progressive rupture at the top of the reinforcement, resulting in very large displacements.
3.1.2. Failure Modes
Different failure modes were displayed by different columns, depending on the type of reinforcement, the nature of the cover, and the presence if any of non-uniformities in the column. It is known that when casting a vertical column, the top portion of concrete usually has larger pores, leading to lower strength.
3.1.2.1. Light HC Columns
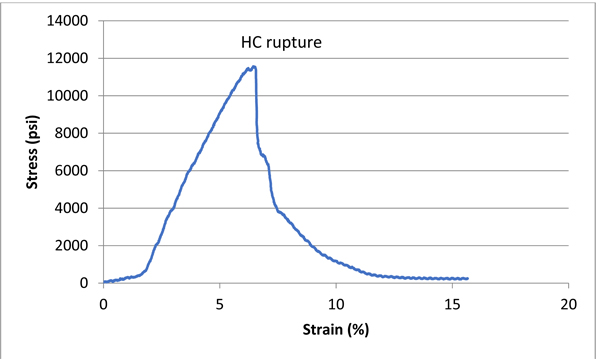
All of the light HC specimens were made of 2-layers without cover. Fig. (2) presents a typical stress-strain diagram. All of the small column specimens displayed a sudden failure with HC reinforcement rupture characterized by a sudden drop of capacity around the peak stress (Fig. 3). The stress capacity then fell sharply towards zero.
3.1.2.2. No Cover Heavy HC Columns
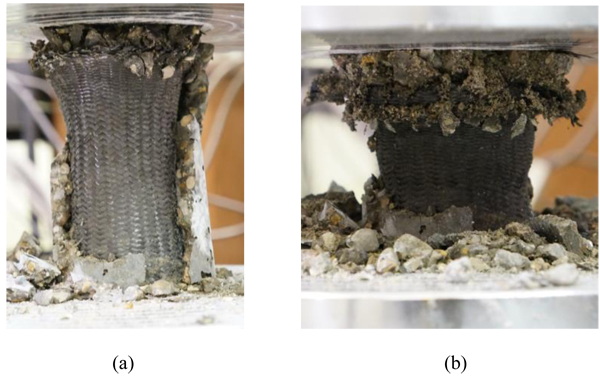
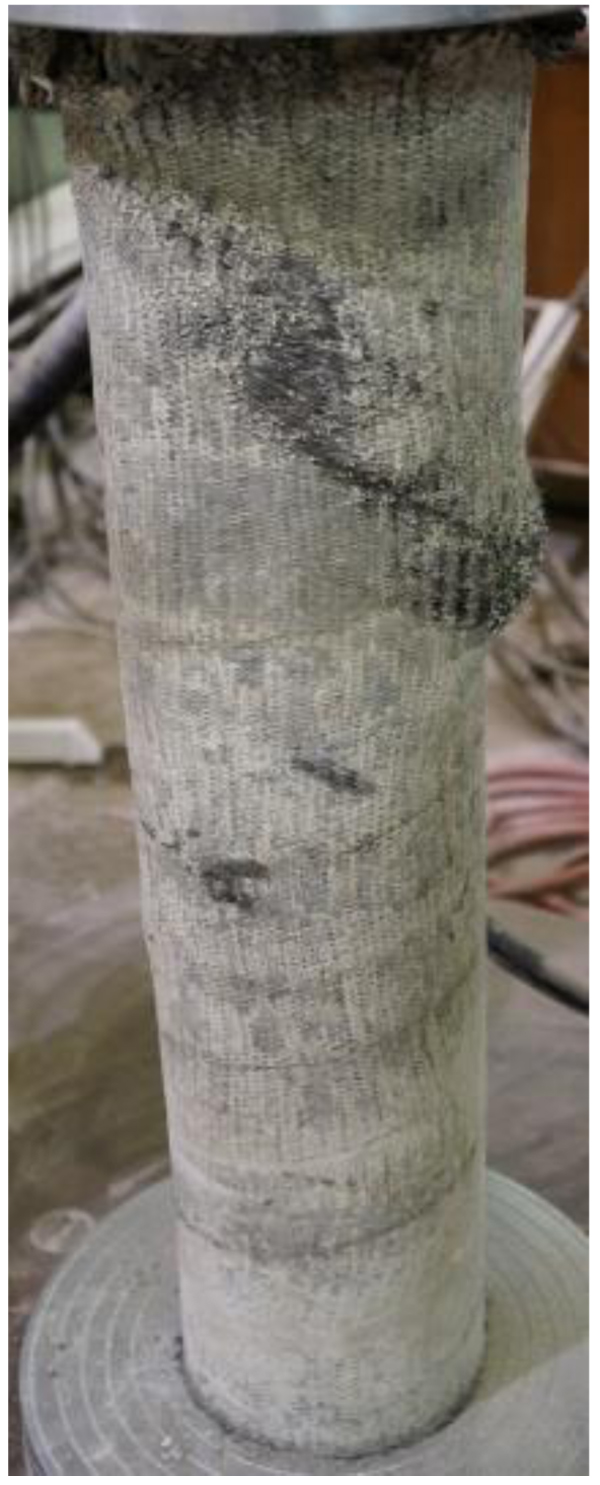
All the heavy HC columns displayed similar stress-strain behavior and failure modes. They showed a first peak as the HC started to shorten (or retract) and gave way to a small open concrete portion at the top (Fig. 4a). As this concrete continued to break off and fall on the sides of the column, the column shortened and the HC reinforcement started to rupture along the edges at the top (Fig. 4b). However, this rupture was localized on the top layers only in contrast with the sudden global rupture of the HC for the light HC columns. As the HC reinforcement continued to retract and rupture, the core concrete still remained confined. This slow and localized rupture allowed the column to continue to carry significant loads and a second peak was observed (Fig. 5). The strength started to decrease only after a larger rupture of the HC occurred.
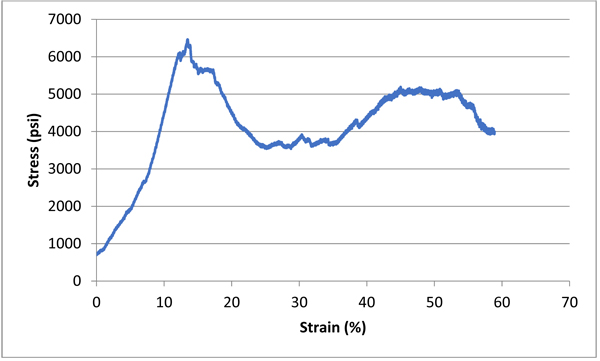
Also, while all of the columns experienced a load drop after the first peak, the magnitudes of the drops varied greatly. This is most likely attributed to the initial conditions of the HC reinforcements near the top of the samples and the exact nature of the progressive rupture of the HC reinforcements during loading. This issue is currently under investigation.
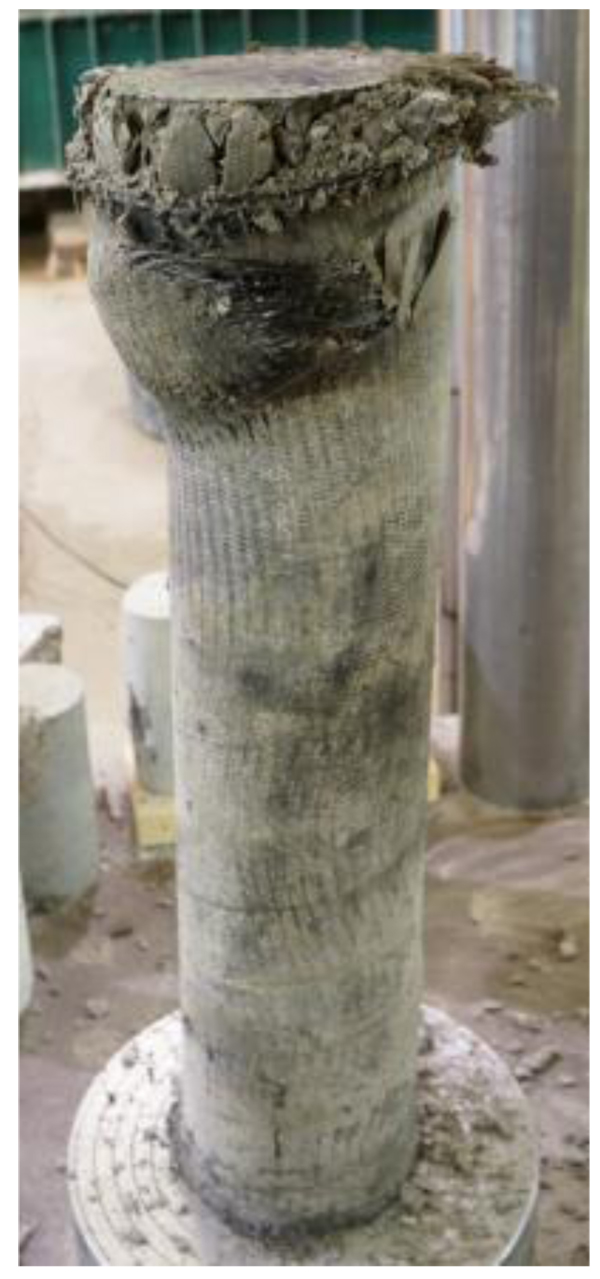
3.1.2.3. Concrete Cover Heavy HC Columns
For these small columns, making a uniformly concrete covered specimen has proved to be challenging; mainly due to the flexibility of the HC reinforcement and the relatively small thickness of the cover layer (about 0.5 inches or 1.3 cm) with respect to the size of the coarse aggregate (0.375 inches or 1.0 cm). Nevertheless, the results mirror closely the columns without concrete cover.
The presence of small pockets of air inside the cover induced the cover to start spalling off at a relatively low applied load. However, since the core of the column was still effectively confined, the column started behaving similar to previous no-cover columns after much of the concrete cover had spalled off. The HC first started shortening around the peak stress (Fig. 6a), then the HC started rupturing at the top layers and the stress consequently started decreasing (Fig. 6b).
3.1.2.4. Mortar Cover Heavy HC Columns
Due to the challenges encountered in using concrete cover in these small specimens, a few mortar cover columns were made with the same mix proportions as the concrete except the coarse aggregate. The mortar cover of these columns was very uniform throughout each specimen without much air voids. These columns displayed similar stress-strain curves to the no-cover columns, with an additional small peak occurring at the onset of mortar spalling off in the initial stages of loading.
3.2. Large Columns
From the test results of the small columns, it was observed that there was little influence of adding a cover around the HC reinforcement in terms of load capacity or strain. Therefore, all of the large columns were cast without concrete cover. They were all cast in one large batch and the results are presented below.
There were a total of 9 samples including 2 base reinforced concrete columns. All of the columns had the same diameter with different heights. For the HC reinforced specimens the notation scheme that was adopted for this phase was a sequence including the number of layers and the height with a dash in-between (# of layers - height). For the base columns, a B replaced the number of layers (B-height).
3.2.1. Test Results
A summary of the test results in this phase are presented in Table 4. When attempting to compare these results with the results from Phase I, it should be noted that there is a noticeable decrease of the average concrete strength in Phase II. This is due to the changes in mix constituents. Similar to the case of small columns, the ultimate strain was determined to be at 60% of the peak loads on the descending portion or at 60% of the peak loads on the second ascending portions whenever there was a second peak.
| Sample | Cross Section Area cm2 (in2) | Height cm (in) | Maximum Capacity | Ultimate Strain | ||
|---|---|---|---|---|---|---|
| Stress MPa (psi) | Corresponding Strain (%) | (%) | ||||
| Base RC | B-30.25 | 182.39 (28.27) | 76.84 (30.25) | 20.4 (2955) | 1.37 | 2.31 |
| B-30.63 | 182.39 (28.27) | 77.80 (30.63) | 19.9 (2892) | 4.14 | 4.74 | |
| 1-Layer HC | 1L-18.25 | 182.39 (28.27) | 46.36 (18.25) | 14.9 (2158) | 3.02 | 4.51 |
| 1L-19 | 182.39 (28.27) | 48.26 (19) | 16.3 (2368) | 8.18 | 9.12 | |
| 1L-28 | 182.39 (28.27) | 71.12 (28) | 14.3 (2074) | 1.79 | 2.35 | |
| 2-Layer HC | 2L-22.13 | 182.39 (28.27) | 56.2 (22.13) | 21.6 (3139) | 4.26 | 6.38 |
| 2L-30 | 182.39 (28.27) | 76.2 (30) | 16.2 (2351) | 0.66* | 4.87 | |
| 3-Layer | 3L-31.25 | 182.39 (28.27) | 79.38 (31.25) | 22.2 (3220) | 1.1 | 14.5 |
| HC | 3L-31 | 182.39 (28.27) | 78.74 (31) | 21.7 (3150) | 1.2 | 10.7 |
| Plain Concrete | PC1 | 182.39 (28.27) | 30.48 (12) | 8.5 (1232) | 0.69 | - |
| PC2 | 182.39 (28.27) | 30.48 (12) | 7.9 (1145) | 1.01 | - | |
| Average | - | - | 8.2 (1189) | 0.85 | - | |
The 1-Layer HC columns displayed a little less than twice the plain concrete strength on average. The 2-Layer columns displayed between 2 and 2.5 times the strength of the plain concrete. Also, for both 1- Layer and 2-Layer HC columns, the ultimate strain is noticeably small, varying between 2.35% and 9.12% compared to that of the small columns. The base RC columns displayed a strength capacity about 2.5 times the plain concrete and a strain capacity between 2.3 and 4.7%.
The 3-Layer HC columns showed similar strength to the 2-Layer columns. However, there was a significant load plateau after the peak load, rendering a large ultimate strain (>10%).
The apparent early failure of the large 1&2-Layer HC reinforced columns is likely due to an insufficient amount of reinforcement provided for the loading required. A detailed analysis of the failure modes in the next section provides a better insight into this observation.
3.2.2. Failure Mode
Different failure modes were displayed depending on the type of specimens. In general, all of the 1-Layer and 2-Layer HC reinforced large columns failed due to a HC global rupture. This failure differed from that of the small heavy HC columns in that it was not a progressive failure starting from the top or bottom portion of the HC, rather it is a complete rupture of the HC that renders it unable to carry much more load (similar to the small light HC columns).
3.2.2.1. Base RC Reinforced Columns
Each RC reinforced column displayed a slightly different failure mode. B-30.25 displayed a global buckling failure mode with the entire column buckling, while B-30.63 displayed a local buckling failure mode with individual re-bars buckling.
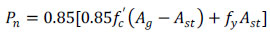
Following ACI 318-08 (2008) design equation 10-1, the anticipated capacity of the base reinforced concrete column can be calculated using the following equation
 |
(1) |
where Pn is the total loading capacity of the column, is the compressive strength of the concrete, is the yield strength of the longitudinal steel, is the gross area of the column, and is the cross-sectional area of the longitudinal steel.
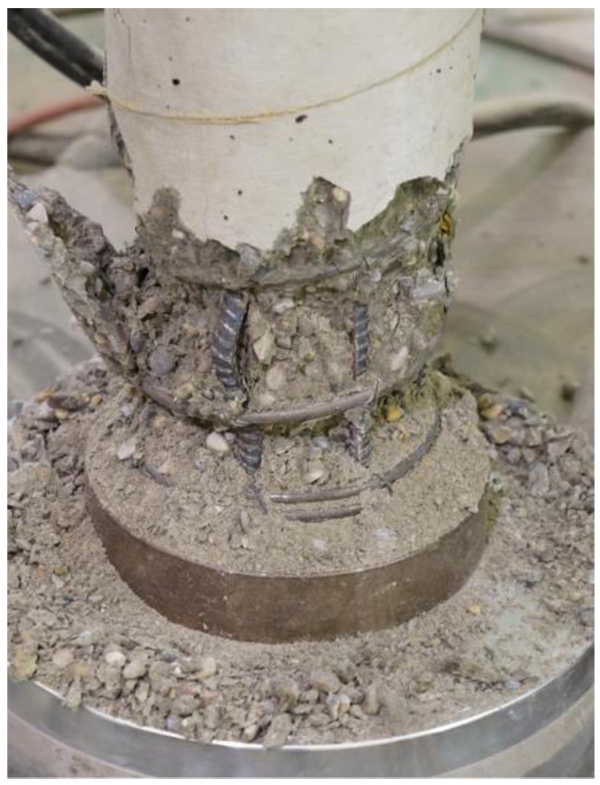
Pn was calculated to be 60.75 kips (270.2 kN). The average RC reinforced column capacity was 82 kips (364.7 kN), 1.35 times the design strength, which was consistent with design procedures. B-30.25 column started experiencing stress concentrations around the wooden spacers at the top edge of the column. The concrete around this area started to spall off as the stress increased to around 2,300 psi (15.8 MPa). This area continued to expand and more concrete continued spalling off until the reinforcement around this area was fully exposed at the peak of the capacity around 3,000 psi (20.7 MPa). At this point the reinforcement along one side of the column started shifting and the column experienced a global buckling failure.
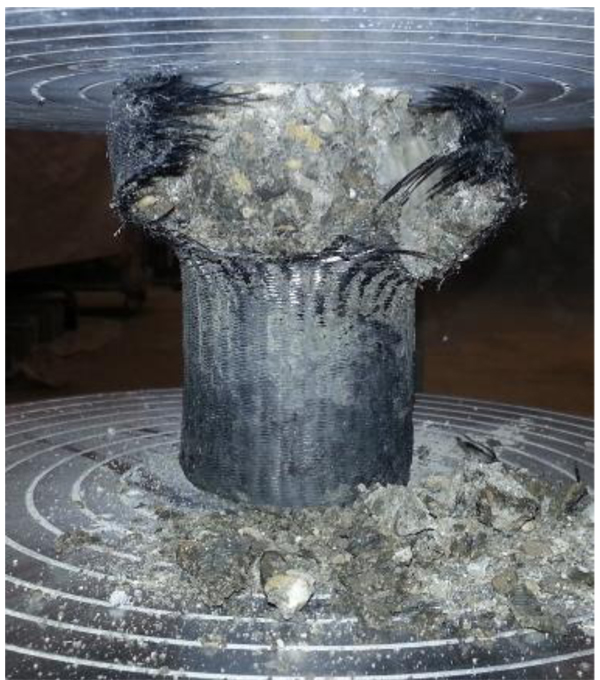
The second base column B-30.63 displayed a similar load capacity but experienced a slightly different failure mode. Similar to B-30.25, this sample started experiencing stress concentration around the wooden spacers at a stress capacity of 2,600 psi (17.9 MPa). The concrete spalled off at a faster rate however, holding the capacity of the column around this peak stress capacity until a significant portion of the re-bar is exposed. The stress increased to a peak around 2,800 psi (19.3 MPa) where individual longitudinal re-bars started to buckle (local buckling), prompting the column to fail (Fig. 7).
3.2.2.2. 1-Layer HC Reinforced Columns
The failure mode for the 1-Layer HC reinforced columns has been the same. For these columns, the stress increases until the maximum capacity is reached, the concrete starts to create a shear band (or line) along the HC reinforcement. Failure of the HC reinforcement gradually develops within this shear band until the ultimate capacity of the HC is reached. HC reinforcement then ruptures and the column fails.
All columns (1L-18.25, 1L-19, 1L-28) displayed a very sharp increase in load capacity with little deformation reaching a peak around 2,200 psi (15.2 MPa). At this load, the failure started to appear on the HC reinforcement following a shear line (Fig. 8). This shear line had a 45 degree angle with the axis of the column. These columns did show a small degree of ductility increase, but the first stress peak in this case coincided with HC rupture and the columns failed concurrently.
3.2.2.3. 2-Layer HC Reinforced Columns
For 2-Layer HC columns, the tendency towards the much ductile behavior of the small heavy HC columns is much clear compared to the 1-Layer columns. All 2-Layer columns clearly displayed an intermediate failure mode between the brittle mode of the small light HC columns and the ductile mode of the small heavy HC columns. The initial peak was observed when the HC started shortening at the top. The first load peak was followed by a drop in capacity due to the crushing failure of the top layer concrete. The load capacity increased again after pseudo-strain hardening and a second peak was reached at which point the HC ruptured and the column failed (Fig. 9).
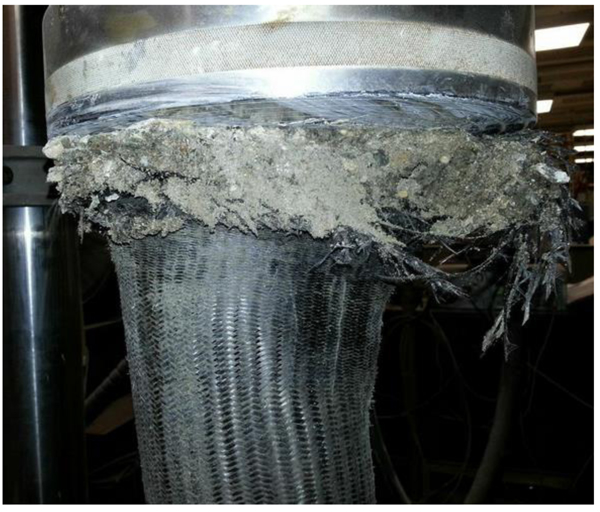
3.2.2.4. 3-Layer HC Reinforced Columns
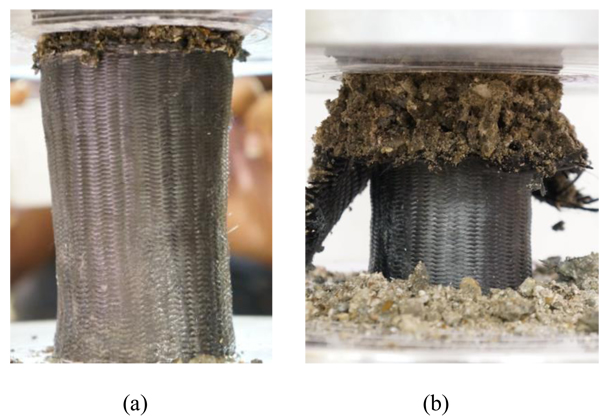
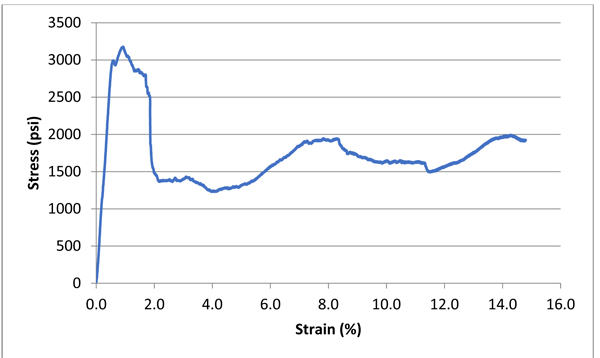
The behaviors for both 3-Layer columns were very similar. There was a steep rise in stress capacity with a peak strength around 3,000 psi (20.7 MPa) with a small corresponding strain of 1%. At the peak load, the HC reinforcement started to retract from the top (or bottom) of the columns, exposing the very top portion of concrete that started to crush (Fig. 10). The load capacity then dropped by around 30-50% at which point the capacity was maintained for a long period of time experiencing large strains (Fig. 11). It is also important to note that the HC reinforcement never globally ruptured indicating that the number of layers was enough to carry the applied loads. The test was terminated due to an excessively large displacement.
3.3. Further Remarks
All small Light HC columns failed suddenly right after the maximum load capacity was reached. This failure was due to HC rupture. Such sudden failures are not desirable in practical applications since no warning signs are visible before failure. This phenomenon is equivalent to the under-reinforcement scenario in the case of steel reinforced concrete. Such a brittle failure is in contract to the small Heavy HC columns, which experienced a prolonged and progressive failure leading to very large displacements. The failure started along the edges of the columns at the top (or bottom) and progressed until final failure. This is more controlled and allows for preventive measures to be taken to prevent catastrophes or at least minimize potential damage.
For the large columns, the RC columns were designed according to ACI specifications and achieved their expected capacity with a maximum capacity between 2,800 and 3,000 psi (19.3 and 20.7 MPa). The RC capacity was higher than the capacity achieved by the 1-Layer HC reinforced columns (ranging between 2,100 and 2,300 psi or 14.5 and 15.9 MPa, slightly less than twice the concrete strength). The 2-Layer and 3-Layer columns achieved a slightly higher capacity at around 3,100 psi (21.4 MPa, around 2.6 times the concrete strength). The 1-Layer and 2-Layer HC reinforced columns were not as ductile as the small heavy column specimens and prematurely failed by HC rupture along a shear line. For the 1-Layer columns, the HC ruptured upon reaching the first peak, indicating that the reinforcement is less than required. For the 2-Layer columns, some degrees of progressive failure of the HC were evident but limited. The 3-Layer HC reinforced columns experienced an early peak load at around 1% strain with a strength capacity similar to that of the 2-Layer columns. Moreover, the 3-Layer HC never completely ruptured and the columns experienced large strains (more than 10%, (Fig. 11)) beyond the first peak load. The progressively ductile failure of HC reinforced columns (without steel reinforcement) was distinctly different than those of conventionally CFRP-wrapped columns. Such columns with or without steel reinforcement were typically failed in a sudden and explosive manner by the complete rupture of the FRP jacket due to hoop tension [21, 22].
The ideal compressive response of concrete columns reinforced with HC reinforcement should show two-peak behavior, which is caused by the progressive rupture of the HC as the column fails, similar to that of Figs. (5 and 11). Obviously, a smaller load drop after the first peak is preferred. The issue of how to control the initial load drop is critical and can be improved by the optimal design of the hybrid fiber materials and the twist angles of interlocking fiber strands, on which research is on-going and will be reported in a future publication.
CONCLUSION
The following conclusions can be drawn from this work:
- (1). The small columns reinforced with light HC displayed high load capacities (10,877 psi or 75.0 MPa), but also brittle failures due to the rupture of HC reinforcements at relatively low displacements.
- (2). The small columns reinforced with heavy HC showed rather ductile behavior with relatively smaller strength capacities (8,022 psi or 55.3 MPa), and failed progressively while experiencing large displacements.
- (3). The general behavior and failure modes for both the concrete and mortar cover small HC columns were the same as the no cover HC columns after the cover spalled off. These observations render the cover mostly non-structural, but it could be used as a warning sign when it starts to crack or presents signs of distress. It could also play a role in chemical, environmental, or fire protection.
- (4). For the large samples, the RC columns failed in local or global buckling. The 1-Layer and 2-Layer HC reinforced columns were not as ductile as the small heavy HC column specimens and failed by rupture of the HC along a shear line (band). The 3-Layer HC reinforced columns experienced an early peak load at around 1% strain with a strength capacity similar to that of the 2-Layer columns. Moreover, the HC never completely ruptured and the columns experienced large strains after the first peak load. The compressive behavior of properly designed HC (2 and 3 layer) columns show similar load capacities but significantly better ductility (ultimate strain) in comparison to the corresponding RC columns.
CONSENT FOR PUBLICATION
Not applicable.
CONFLICT OF INTEREST
The authors declare no conflict of interest, financial or otherwise.
ACKNOWLEDGEMENTS
Declared none.

