All published articles of this journal are available on ScienceDirect.

A Dynamic Model for Simulation of the Scale of Industrial Chain of Construction Waste Reclamation in China
Abstract
The scale of the industrial chain for construction waste reclamation in China is still at a small magnitude with a relatively slow development rate, yet to form an industrial chain that is mature. With the industrial chain theory, this paper takes Guangzhou as an example to construct a simulation model of the scale of industrial chain of construction waste reclamation based on system dynamics. As the results show: (1) though the subsidy policy carried out by the government has a significant effect on the development of the industrial chain of construction waste reclamation, a greater amount of compensation will not necessarily lead to a larger scale of industrial chain of construction waste.(2) The inventory optimization management is conducive to promote the development of industrial chain of construction waste. (3) The governmental compensation amount of RMB 50,000 per 10,000 tons in the next 5 to 10 years will be the optimal to ensure the rapid development of the industrial chain of construction waste. (4) The scale of the industrial chain of construction waste reclamation, the inventory of the dealers and the inventory of resource-oriented enterprises interact and mutually constrain, implying that with the expansion of the production scale of resource-oriented enterprises, the oscillation amplitude of the inventory of the dealers will become greater while the frequency will be smaller .The conclusion of the study provides reference value and theoretical basis for the development of industrial waste resource industry chain.
1. INTRODUCTION
With the issues in energy-saving and environmental protection put forward again in the 13th Five-year Plan, the reclamation of construction waster has become a focus among those experts in the field of construction and relevant government departments. The great amount of construction waste, as a by-product of the continuous urban development, is simply treated with landfill or dumping at will, thus causing a waste of resources and lands as well as environmental pollution. According to statistics, construction waste has accounted for 30 to 40 percent of the total amount of urban waste in China [1]. However, the efficiency of construction waste reclamation in China insofar is quite low, less than 5 percent according to relevant data [2]. However, according to the European Waste Restriction Directive 2008/98 / EC, the European countries' recycling standards for construction waste: the minimum percentage of “non-hazardous” construction and demolition waste by 2020 should be at least 70% (weight) [3]. The government plays an important role in the process of recycling of construction waste, for example, the Spanish government policy for construction waste recycling “tax subsidies and economic punishment” [4]. This has led to the phenomenon that the annual output of renewable products of construction waste recycling enterprises, and the scale of entire construction waste resource industry chain are small in our country. Moreover, the development speed is slow, which makes a sharp contrast to the complete industrial chain of construction waste recycling in European Union countries.
A mature industrial chain of construction waste reclamation is the key to solve the problem of construction waste disposal, and therefore, the smooth operation and development of the industrial chain of construction waste reclamation is of great significance to the construction waste disposal. In recent years, increasing attention has been paid to the study of industrial chain of construction waste reclamation among the scholars in China. For example, Wang et al. has carried out a study on the role of subject social responsibility on the industrial chain of construction waste reclamation [5], and Hu et al. offers an analysis of the role of production factors, demand conditions, corporate strategy, related industries, development opportunities and government behavior on the development of recycling of construction waste based on the diamond model [6]. Gao et al. carried out a game analysis through the structure model of the industrial chain of construction waste reclamation to put forward that the development of resource-based enterprise should be promoted and the stability of raw material supply in the industrial chain be maintained as well as the market competitiveness of recycled products be improved to further enhance the development of the industrial chain of construction waste reclamation [7]. Liu et al. set up the model of the industrial chain of green building from the perspective of recycling economy and carried out a game analysis on the government and builders in the industrial chain of green building, suggesting that the management of recycling in the industrial chain of green building should be enhanced, and the development of the complexity of the industrial chain of green building be boosted and an industrial alliance of green building be organized as well as relevant incentive policies be formulated and improved by the government as soon as possible [8]. While Murat Kucukvar et al. analyzed the optimal strategy choice in the entire economic supply chain under the different evaluation indicators of three strategies including reclamation, landfill and incineration by constructing a hybrid life cycle evaluation model based on economic input and output [9].
Many scholars have carried out researches on the industrial chain of construction waste reclamation based on the system dynamics theory. For example, Xu has set up an urban construction waste system combination chart that integrates construction waste subsystems, social subsystems, ecological subsystems and economic subsystems in one based on the system dynamics theory for further research and analysis [10]. Likewise, Liu et al. conducted a cost-earnings study and analysis on the construction waste management in Pearl River Delta area, proposing that the governmental economic subsidies and fines are of great significance to the management of construction waste [11, 12].
At present, there have been only a few studies on the industrial chain of construction waste reclamation based on the system dynamics theory. Therefore, based on the small scale of industrial chain of current construction waste reclamation in China, this paper takes Guangzhou as an example based on the industrial chain theory and the principles of system dynamics to construct a simulation model of the scale of industrial chain of construction waste reclamation, and the results can serve as theoretical reference for the government to promote the maturity of the industrial chain of construction waste reclamation.
2. SYSTEM STRUCTURE OF THE INDUSTRIAL CHAIN OF CONSTRUCTION WASTE RECLAMATION
The industrial chain is a vivid description of the interrelationships between industrial sectors based on technical and economic links. Virtually speaking, the industrial chain is a concept that contains four dimensions including value chain, enterprise chain, supply chain and space chain, which form the industrial chain in the process of balancing and coupling each other [13, 14]. The industrial chain of construction waste reclamation refers to form a whole chain containing the value chain, enterprise chain, supply chain and space chain with the supply-side of construction waste, construction waste resource-oriented enterprises, dealers of recycled products, demand-side of renewable products as the subject, the construction waste and recycled products as connected products and the market demands as orientation [15].
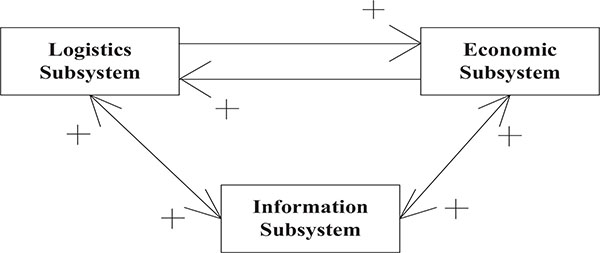
The system model of the industrial chain of construction waste reclamation contains logistics subsystem, economic subsystem and information subsystem. As shown in Fig. (1), in the whole system model, the logistics subsystem and the economic subsystem together form a positive feedback closed loop to reinforce mutually, while based on the impact of national policies, industry scale and other factors involved in the information subsystem effectively influence the logistics subsystem and the economic subsystem, and the continuous improvement in the logistics subsystem and the economic returns indirectly affects the national policy, industrial scale and other factors, thus forming a positive feedback loop.
2.1. Logistics Subsystem
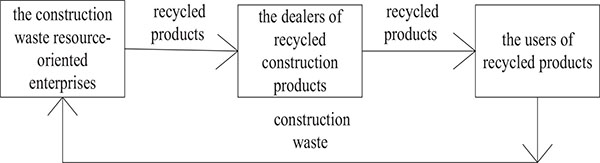
In the logistics subsystem of the system model of the industrial chain of construction waste reclamation, there is a logistics chain-the logistics chain of construction waste reclamation. As shown in Fig. (2) below, the operation process of the logistics chain of construction waste reclamation starts as follows: As the developers develop new projects and the contractors commence construction, the construction waste accumulate. Following this, the construction waste resource-oriented enterprises use the waste to produce recycled products, which will be sold to the dealers of recycled construction products to be further supplied to the users of recycled products of construction waste (construction units in general). In this way, it becomes a recycling system with recycled products and construction waste as the carrier.
2.2. Economic Subsystem
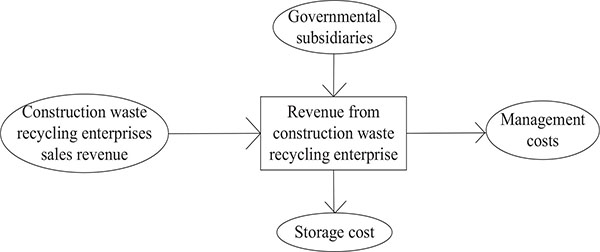
The economic subsystem reflects the capital inflow, outflow and income. In the economic sub-system of the system model of the industrial chain of construction waste reclamation, it includes an the economic chain of construction waste reclamation; the relation chart of which is shown in Fig. (3).
2.3. Information Subsystem
In system dynamics, information plays the role of feedback, and delay as well. In the industrial chain of construction waste reclamation, information has always played an important role incorporating information related to the sales forecast of recycled products by dealers, policies e.g. governmental subsidies and sales forecast of resource-oriented enterprises related to variance factors of the information system. For example, the sales forecast of recycled products by dealers is obtained based on the market demand rate of the recycled products after a time delay.
3. THE SYSTEM DYNAMICS MODEL STRUCTURING OF THE INDUSTRIAL CHAIN OF CONSTRUCT WASTE RECLAMATION – A CASE STUDY OF GUANGZHOU CITY
System dynamics (SD), a science that integrates system science theory with computer simulation and studies the structure and behavior of system feedback, is an important branch of system science and management science [16]. The approach of system dynamics refers to a combination of qualitative and quantitative analysis coupled with systematic comprehensive reasoning, in which the model structuring is a process of learning, investigation and research [17].
3.1. Boundary and Basic Assumptions of the System Dynamics Model Structuring of the Industrial Chain of Construct Waste Reclamation
The industrial chain of construction waste reclamation is a complex non-linear system involving many factors, among which the correlation is very complex. Therefore, to construct the system dynamics model of the industrial chain of construction waste reclamation, the boundary of the model should be determined, and the complex interactions among various influencing factors should be transformed into simple ones through assumptions.
The industrial chain of construction waste reclamation of Guangzhou was taken as an example to carry out the corresponding research and analysis. Based on the logistics subsystem, economic subsystem and information subsystem in the system model of the industrial chain of construction waste reclamation, the construction waste resource-oriented enterprises and dealers of recycled products are treated as the research object, to carry out the research with the scale of the industrial chain of construction waste reclamation, the inventory of the construction waste resource-oriented enterprises and the inventory of the dealers of recycled products as the reference indicators.
Basic Assumptions:
- All of the construction waste resource-oriented enterprises and dealers of recycled products in Guangzhou were treated as a whole to carry out research and analysis.
- The competitive effects of traditional building materials were not taken into account.
- The synergy of the upstream and downstream enterprises was ignored.
3.2. System Dynamics Flow Diagram Structuring of the Industrial Chain of Construct Waste Reclamation
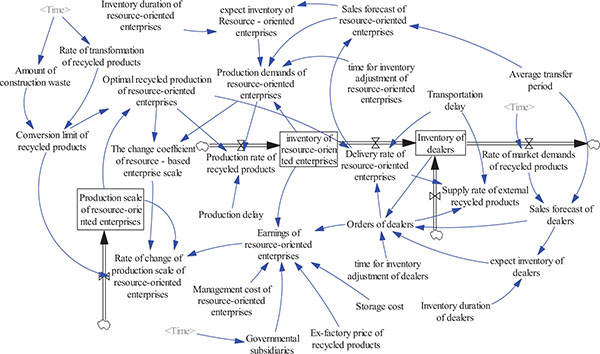
According to the determined boundary and basic assumptions coupled with the relations among the factors involved in the industrial chain of construction waste, the system dynamics stock-flow diagram of industrial chain of construction waste was established as shown in Fig. (4). In the system model, it mainly involves state variable, rate variable and auxiliary variable. The state variable is used to describe the state of the system elements, and the rate variable determines the trend of the state variable with time, while the auxiliary variable is conducive to provide the auxiliary information necessary for establishing the complex relationship between the rate variable and the state variable. Among them, there are three state variables, five rate variables, fifteen auxiliary variables and nine constants.
3.2.1. Determination of the Variables and the Function Relationship between the Major Variables in the Model
In this paper, the industrial chain of construction waste reclamation in Guangzhou was taken as the research object with reference to Guangzhou Statistical Yearbook 2005-2015 to classify and describe the state variables, rate variables, auxiliary variables and constants, as shown in Tables 1-3 below [18, 19].
| Variables | Types | Variable Expression | System |
|---|---|---|---|
| Production scale of resource-oriented enterprises | State | INTEG (Rate of change of production scale of resource-oriented enterprises,70) | Economy |
| Inventory of resource-oriented enterprises | State | INTEG (IF THEN ELSE(Production rate of recycled products> Delivery rate of resource-oriented enterprises, 0, (Production rate of recycled products - Delivery rate of resource-oriented enterprises)),70) | Logistics |
| Inventory of dealers | State | INTEG (Supply rate of external recycled products + Delivery rate of resource-oriented enterprises – Rate of market demands of recycled products,200) | Logistics |
| Production rate of recycled products | Rate | DELAY1(MIN(Optimal recycled production of resource-oriented enterprises, Production demands of resource-oriented enterprises), production delay) | Logistics |
| Supply rate of external recycled products | Rate | DELAY1(orders of dealers- Delivery rate of resource-oriented enterprises, transportation delay) | Logistics |
| Delivery rate of resource-oriented enterprises | Rate | DELAY1(MIN(orders of dealers, Optimal recycled production of resource-oriented enterprises), transportation delay) | Logistics |
| Rate of change of production scale of resource-oriented enterprises | Rate | Production scale of resource-oriented enterprises*(Limit production of recycled products transformation - Production scale of resource-oriented enterprises)* Earnings of resource-oriented enterprises *coefficient of change of resource-oriented enterprises | Economy |
| Production demands of resource-oriented enterprises | Auxiliary | MAX(0, Sales forecast of resource-oriented enterprises +(expected inventory of resource-oriented enterprises -inventory of resource-oriented enterprises)/time for inventory adjustment of resource-oriented enterprises) | Logistics |
| Sales forecast of resource-oriented enterprises | Auxiliary | SMOOTH(Delivery rate of resource-oriented enterprises, average transfer period) | Information |
| Earnings of resource-oriented enterprises | Auxiliary | Ex-factory price of recycled products* Orders of dealers +governmental subsidiaries *(Orders of dealers + inventory of resource-oriented enterprises)-storage cost * inventory of resource-oriented enterprises – management cost of resource-oriented enterprises *(Orders of dealers + inventory of resource-oriented enterprises) | Economy |
| Sales forecast of dealers | Auxiliary | SMOOTH(Rate of market demands of recycled products, average transfer period) | Information |
| Orders of dealers | Auxiliary | MAX(0, Sales forecast of dealers +(expected inventory of dealers - inventory of dealers)/ time for inventory adjustment of dealers) | Logistics |
| Optimal recycled production of resource-oriented enterprises | Auxiliary | MIN(Limit production of recycled products transformation, Production scale of resource-oriented enterprises) | Logistics |
| Variables | Types | Evaluation |
|---|---|---|
| Production scale of resource-oriented enterprises 10,000 tons per year | State | 70 |
| Inventory of resource-oriented enterprises 10,000 tons | State | 70 |
| inventory of dealers 10,000 tons | State | 200 |
| Rate of market demands of recycled products 10,000 tons per year | Auxiliary | WITH LOOKUP (Time,([(2005,0)-(2015,800)], (2005,150.3),(2006,278.25),(2007,303.1),(2008,451.7),(2009,598.2),(2010,738.8), (2011,886.1),(2012,1041.3),(2013,1214.51),(2014,1383.27),(2015,1579.25))) |
| Rate of transformation of recycled products | Auxiliary | WITH LOOKUP (Time,([(2005,0)-(2015,1)], (2005,0.05),(2006,0.15),(2007,0.2),(2008,0.25),(2009,0.3),(2010,0.35),(2011,0.4), (2012,0.45),(2013,0.5),(2014,0.6),(2015,0.6))) |
| Amount of construction waste 10,000 tons per year | Auxiliary | WITH LOOKUP (Time,([(2005,0)-(2015,3000)], (2005,1182.05),(2006,1210.51),(2007,1302.62),(2008,1415),(2009,1567.8),(2010,1645.6), (2011,1740.5),(2012,1810.36),(2013,1950.74),(2014,2011.2),(2015,2413.5))) |
| Governmental subsidiaries RMB 10,000 per 10,000 tons | Auxiliary | WITH LOOKUP (Time,([(2005,0)-(2015,10)], (2005,0),(2006,0),(2007,0),(2008,0),(2009,0),(2010,0),(2011,0), (2012,0),(2013,0),(2014,0),(2015,2))) |
| Constants | Meaning | Evaluation |
|---|---|---|
| Storage cost(RMB 10,000 per 10,000 tons) | The storage price per ton of recycled products in the storage warehouse of construction waste resource-oriented enterprises | 5 |
| Ex-factory price of recycled products(RMB 10,000 per 10,000 tons) | Price per ton of recycled products sold to the dealer from construction waste resource-oriented enterprises | 25 |
| Production delay(per year) | information feedback delay of orders of dealers by construction waste resource-oriented enterprises | 0.1 |
| Average transfer period(per year) | time for information spreading and feedback | 0.5 |
| Inventory duration of dealers(per year) | Period from the end of the first order to the beginning of the second order of a dealer | 0.5 |
| time for inventory adjustment of dealers(per year) | Period from placing an order to completing the target inventory by a dealer | 1 |
| Inventory duration of resource-oriented enterprises(per year) | Period from the end of the first order to the beginning of the second order of a construction waste resource-oriented enterprise | 0.5 |
| time for inventory adjustment of resource-oriented enterprises(per year) | Period from placing an order to completing the target inventory by a construction waste resource-oriented enterprise | 1 |
| Management cost of resource-oriented enterprises(RMB 10,000 per 10,000 tons) | labor, equipment depreciation and other costs for production of one ton of recycled products by a construction waste resource-oriented enterprise | 15 |
| Transportation delay(per year) | period of delay from placing an order to the delivery of the goods by the dealer | 0.1 |
3.2.2. Effectiveness Examination of System Dynamics Model of the Industrial Chain of Construction Waste Reclamation
When all the variables and functions are determined, the effectiveness of the system dynamics model of the industrial chain of construction waste reclamation was examined, so as to verify the rationality, authenticity and reliability of the model. During simulation, the initial parameters of the model were set as follows: INITIAL TIME = 2005, FINAL TIME = 2015, TIME STEP = 0.0625, and the unit is per year. In this paper, the effectiveness of the model was examined from two perspectives. On one hand, a common way to test the effectiveness of the model was to examine the relationship between the ex-factory price of recycled products and the scale of production of resource-oriented enterprises. As shown in Fig. (5), changes took place in the scale of production of resource-oriented enterprises as the ex-factory price of recycled products varied from RMB 250,000 per 10,000 tons to RMB 500,000 per 10,000 tons. On the other hand, the simulation of the model considered the changes and reason analysis of the production scale of resource-oriented enterprises, inventory of construction waste resource-oriented enterprises and inventory of recycled products of dealers as the major measures of effectiveness test, as shown in Figs. (6-9), to observe whether the law of change is consistent with reality.
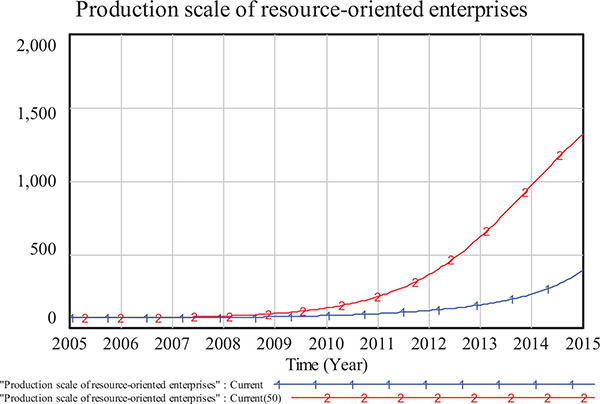
It can be seen from Fig. (5) that the higher the ex-factory price of recycled products is, the greater will be the production scale of resource-oriented enterprise. Therefore, it determines the rate of change. The law of change is consistent with reality.
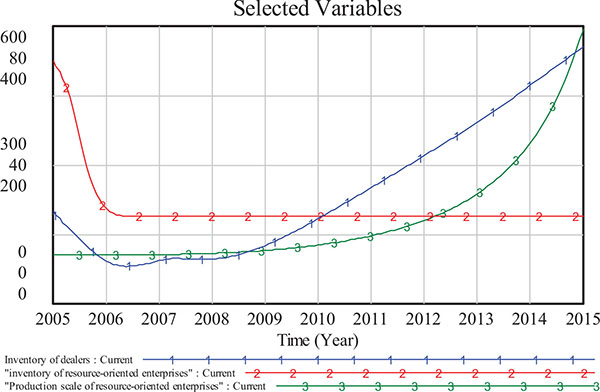
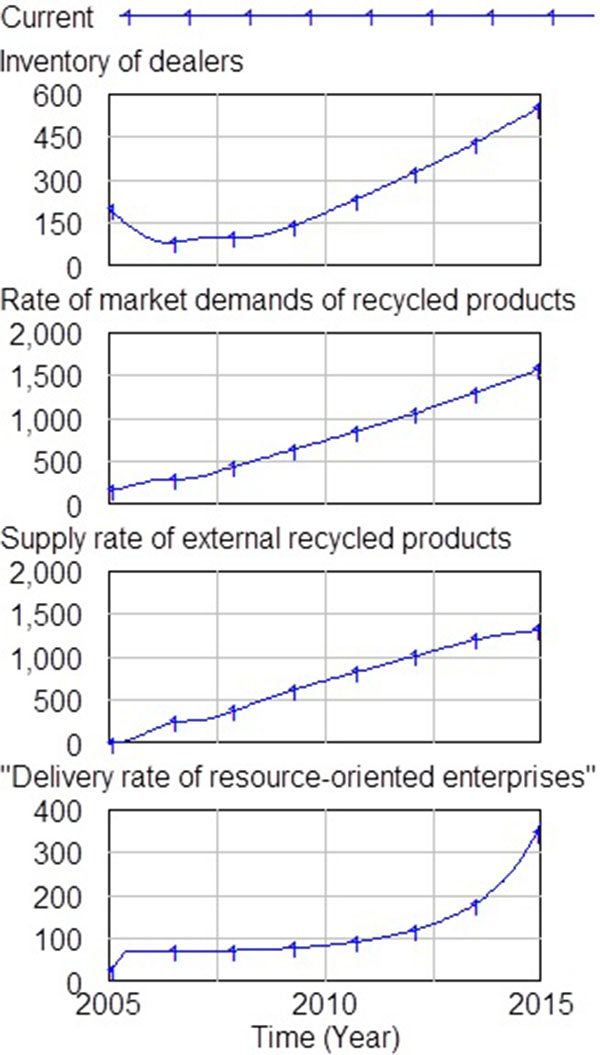
It can be seen from Fig. (6) that from 2005 to 2015, the production scale of resource-oriented enterprises showed a J-type growth trend; the inventory of resource-oriented enterprises showed a rapid downward trend and tends to convergence towards a stable value; while the inventory of the first dealer again decreased before small fluctuations and growth.
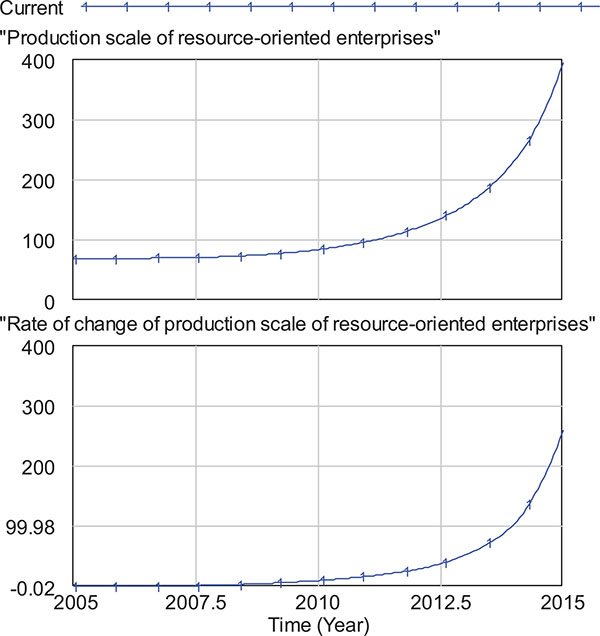
According to the analysis in Fig. (7), the production scale of resource-oriented enterprises has been gradually increased from 700,000 tons per year in 2005 to 3,954,000 tons per year in 2015. Due to the incomplete supporting policies for construction waste reclamation by the government in the first half of the period from 2005 to 2015, the market recognition and demands for recycled products have been weak, further leading to relatively slow development rate of the industrial chain of construction waste reclamation. Given the early large investment in equipment and poor profitability for the industrial chain of construction waste reclamation, a slight negative growth was observed in the same period in terms of the scale of industrial chain of construction waste reclamation throughout Guangzhou. While as the latter part of Fig. (8) shows, with the emphasis on environmental protection, recycling of resources and recycling economy of the government, and the construction waste disposal in 2015 in particular a substantive policy was put forward to grant a substantial subsidy of RMB 2 for 1 ton of recycled products produced by construction waste resource-oriented enterprises [20], which is one of the major reasons responsible for the rapid development of the industrial chain of construction waste reclamation. The results of the simulation are in compliance with the development trend of the industrial chain of construction waste reclamation in Guangzhou from 2005 to 2015.
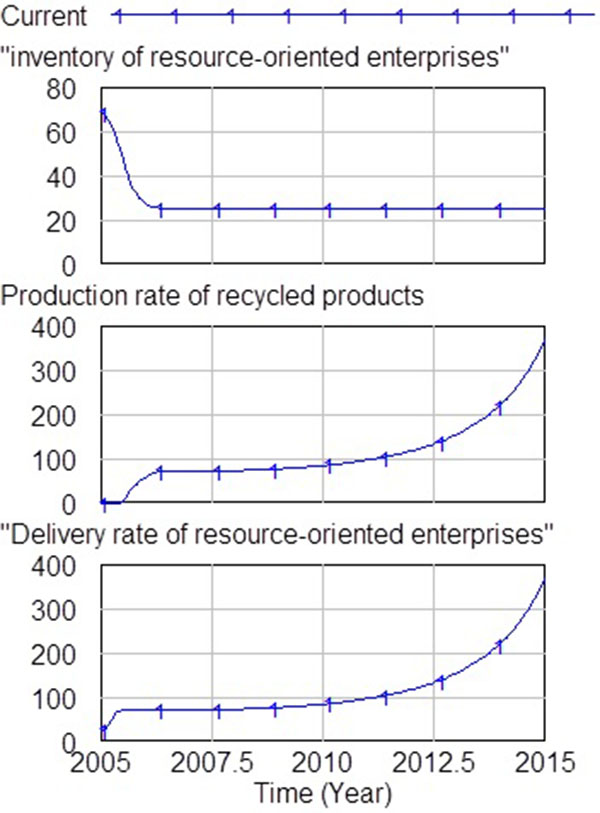
It can be seen from the analysis of Figs. (8 and 9) that the inventory of resource-oriented enterprises in Guangzhou has decreased sharply from 700,000 tons in 2005 to 250,000 tons in 2015, which then remained stable. While dealers in Guangzhou showed a tendency of rapid growth in 2009 and reached 5,470,000 tons in 2015 before a slight fluctuation and the lowest point in 2006 declined from the 2 million tons in 2005. In Fig. (8), according to the curve of the inventory of resource-oriented enterprises and rate of change, the industrial chain of construction waste reclamation lacked production capacity and the local recycled products failed to meet the market demands, resulting in a large consumption of inventory, coupled with the the renewable production delays, delays in transport and market demand for information throughout the whole supply chain of recycled products. This explains why the resource-oriented enterprises in Guangzhou have maintained a small inventory of 250,000 tons. As shown in Fig. (9), the curve of inventory of dealers and rate of change reflect that due to the interest body being closest to the recycled product market, the dealer of the recycled product is less sensitive to the market demands. In the process of order, storage and supply of recycled products, the rate of external recycled products supply starts at zero due to the low cost of ordering local recycled products in Guangzhou. As the production capacity and inventory of the industrial chain of construction waste reclamation in Guangzhou had been unable to meet the market demand, the dealers of recycled products had to place orders from the construction waste resource-oriented enterprises in the neighboring cities e.g. Shenzhen, which led to an increase in the rate of external recycled products supply [26]. Nevertheless, the construction waste resource-oriented enterprises in Guangzhou still maintained the highest rate of delivery. The simulation results are consistent with the inventory changes in the construction waste resource-oriented enterprises and dealers of recycled products in the supply chain of recycled products in Guangzhou from 2005 to 2015.
4. ANALYSIS AND DISCUSSION ON THE RESULTS OF MODEL SIMULATION
To determine the effectiveness of the model, the simulation period will be adjusted from 2015 to 2020, during which this paper carried out the simulation on the model of industrial chain of construction waste reclamation based on a forecast of the market demand rate of recycled products. In the process, the initial parameters of the model were set as: INITIAL TIME = 2015, FINAL TIME = 2020, TIME STEP = 0.0625, unit: Year.
With the overcapacity of construction industry and the national control policies imposed on real estate, the growth rate of the construction industry in Guangzhou will be reduced to about 4% during till 2020. And due to the poor social recognition of construction waste recycled products and a comparatively large fluctuation in the market demand for recycled products, about 3 million tons per year, coupled with the highly fluctuating frequency, it can be forecasted that the equation of the market demand rate of recycled products from 2015 to 2020 is: 1579+STEP (1579*0.04,2015)+ IF THEN ELSE (Time> 2015, RANDOM NORMAL (-300, 300, 0, 300, 6), 0), unit:10,000 tons per year. In 2015, the subsidy policy of RMB 2 per ton of recycled products has been implemented in Guangzhou. It was assumed that the subsidy policy remains unchanged from 2015 to 2020; and with technological development in China, the construction waste recycling rate reached 60% in 2015 which will be 75% in 2020, assumed with a linear growth. Based on these estimates, it can be known that the capacity of construction waste in Guangzhou is: WITH LOOKUP (Time,([(2015, 2000)-(2020,4000)], (2015,2413.5), (2016,2720.3), (2017,2898.5), (2018,3201.2), (2019,3409.9), (2020,3743.1))), unit: 10,000 tons per year.
4.1. Simulation of the Scale of the Industrial Chain of Construction Waste Reclamation
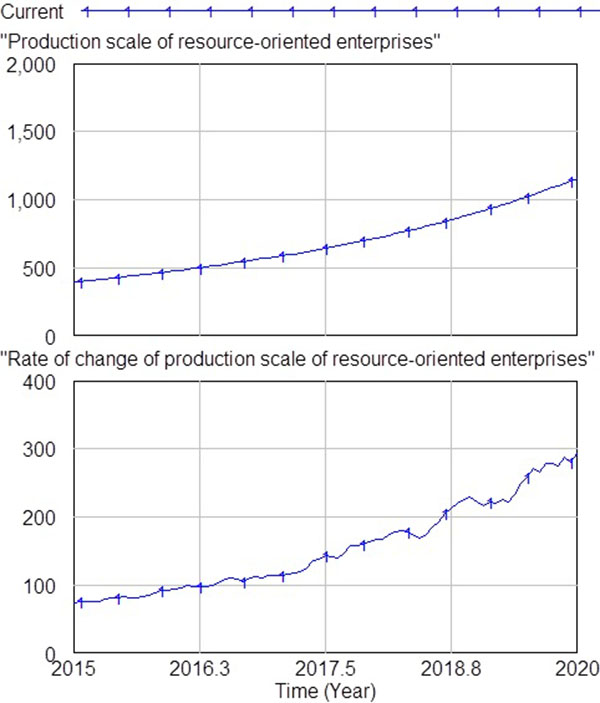
The curve of forecast and rate of change of the scale of the industrial chain of construction waste reclamation from 2015 to 2020 through model simulation are shown in Fig. (10).
Fig. (10) shows that the production scale of resource-oriented enterprises and the rate of change of the production scale of resource-oriented enterprises showed an upward trend, in the whole process of which, there had been a small amplitude of fluctuation. Through forecast on the market demand of recycled products, it can be concluded from the curve of production scale of resource-oriented enterprises that the production scale of the industrial chain of construction waste reclamation in Guangzhou will reach 11,574,300 tons per year in 2020. In the foreseeable future, the production scale of the industrial chain of construction waste reclamation in Guangzhou will reach the maximum and remain at relatively stable level.
4.2. Simulation of the Inventory of Dealers
The curve of forecast and rate of change of the inventory of dealers from 2015 to 2020 through model simulation are shown in Fig. (11).
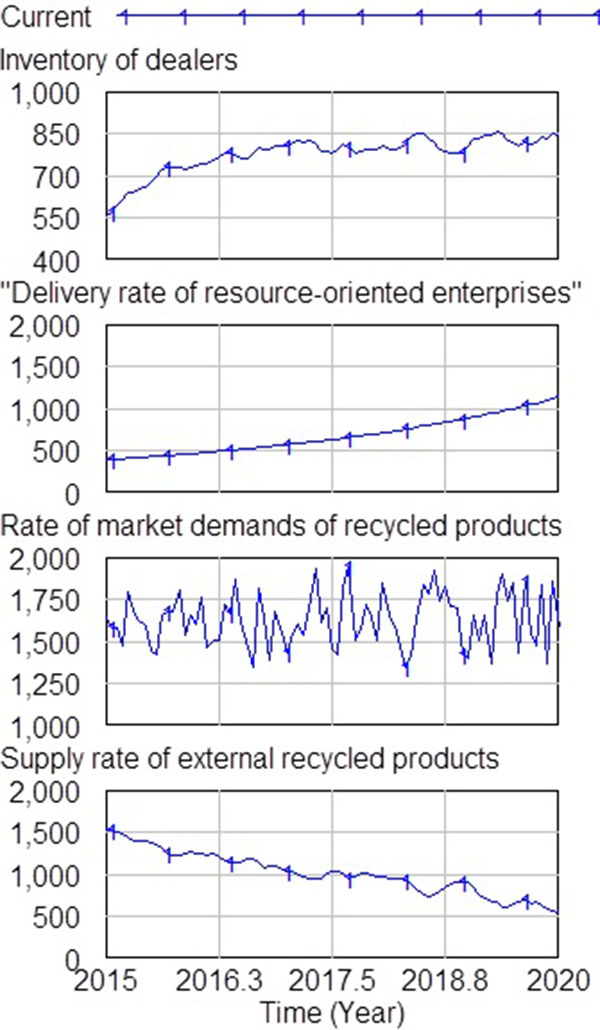
As Fig. (11) shows, from 2025 to 2020, due to the uncertainty of market demand for recycled products and the expansion of the production scale of construction waste recycling enterprises in Guangzhou, the delivery rate of such enterprises waqs kept at the largest level while external enterprises were kept at a state of overall decline. Since 2015, the inventory of dealers has shown a volatile upward trend, reaching a comparatively stable level around 2017, approximately 8.2 million tons per year. In the foreseeable future, with the expansion of production scale of construction waste recycling enterprises in Guangzhou, the external supply of recycled products will be replaced, namely the rate of supply of external recycled products will become zero and the inventory of dealers will show stability with fluctuations. In addition, with the increase in the social demands for recycled products, the recycled products in Guangzhou will reverse from being import products to the export products.
4.3. Simulation of the Inventory of Resource-oriented Enterprises
The curve in the graph of forecast and the rate of change of the inventory of resource-oriented enterprises from 2015 to 2020 through model simulation are shown in Fig. (12).
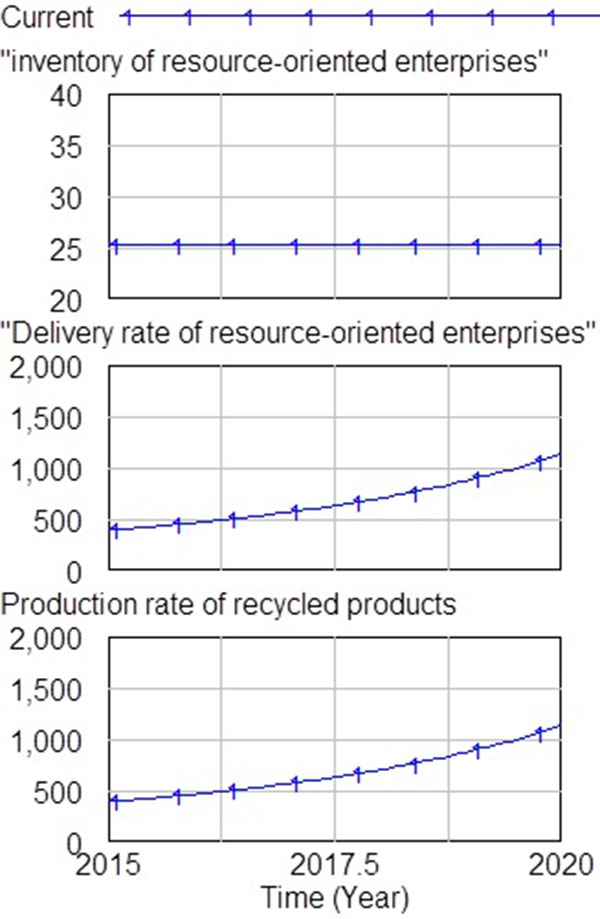
Fig. (12) shows that due to the production capacity of the industrial chain of construction waste reclamation was unable to meet the market demand for recycled products in Guangzhou, the rate of production and delivery of recycled products of such enterprises have always been kept at the highest level with the minimum fluctuation. While due to the production delays in the recycled products, delays in transportation and market demand information, the inventory of resource-oriented enterprises remained stable at 252,000 tons. In the foreseeable future, with the expansion of production scale of construction waste recycling enterprises in Guangzhou, the inventory of such enterprises will remain at relatively stable level with fluctuations.
4.4. Relations Between the Scale of the Industrial Chain of Construction Waste Reclamation, Inventory of Dealers and Resource-oriented Enterprises
The change in the curve of forecast of the scale of the industrial chain of construction waste reclamation, the inventory of dealers and resource-oriented enterprises from 2015 to 2020 through model simulation is shown in Fig. (13) and Table 4.
| Variables Time (year) |
2015 | 2017.25 | 2017.75 | 2018.44 | 2018.81 | 2019.31 | 2019.56 |
|---|---|---|---|---|---|---|---|
| Inventory of dealers(10,000 tons) | 555.5 | 821.3 | 779.5 | 851 | 777 | 858.2 | 804.8 |
| inventory of resource-oriented enterprises(10,000 tons) | 25.2 | 25.2 | 25.2 | 25.2 | 25.2 | 25.2 | 25.2 |
| scale of the industrial chain of construction waste recycling enterprises(10,000 tons per year) | 395.4 | 609.5 | 678.1 | 793.9 | 865.1 | 976.4 | 1036.5 |
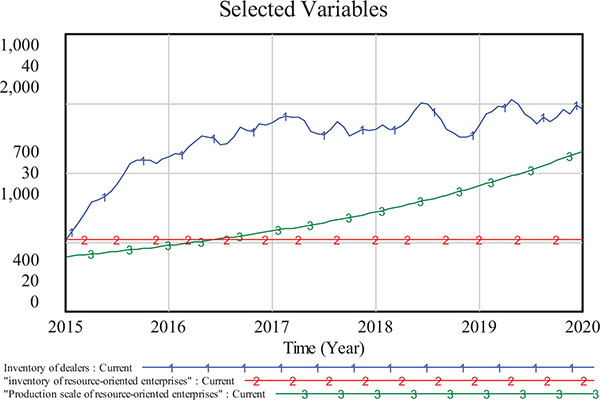
In the scale of the industrial chain of construction waste reclamation, the inventory of dealers and resource-oriented enterprises are the parameter indicators significantly reflecting the activities of dealers and resource-oriented enterprises in the industrial chain and supply chain, therefore; it is necessary to determine the relationships among the three. It can be seen from Table 4 and Fig. (13) that during 2015 to 2020, the inventory of dealers, indicating the process of the ability to supply recycled products of the local resource-oriented enterprises, the market demand of local recycled products and the ability to supply recycled products of external enterprises, have been growing continuously from the 5.555 million tons in 2015 to a stable level around 2017. In the whole process of supply of recycled products, these three indicators are mutually influenced and restricted. When the scale of resource-based enterprises increased, the oscillation magnitude of the inventory of dealers became larger and the frequency became smaller. Among them, the change in the inventory of resource-oriented enterprises is subject to the inventory of dealers, which in turn restricts the inventory of resource-oriented enterprises; In addition, the inventory of resource-oriented enterprises affects the income of such enterprises, which further influences the production scale of these enterprises. Moreover, the inventories of dealers and theses enterprises are subject to the production scale of these enterprises.
4.5. Sensitivity Analysis of Government Subsidiary
The curve of forecast and rate of change of scale of the industrial chain of construction waste reclamation from 2015 to 2020 through simulation on the altering the sensitivity of governmental subsidiary amount are shown in (Fig. 14).
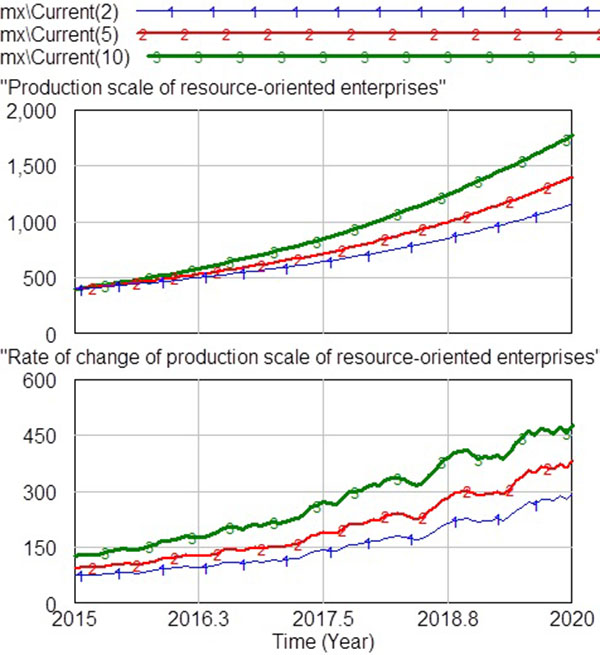
As can be seen from Fig. (14), the subsidiary amount of RMB 100,000 per 10,000 tons has led to a greater curve of production scale of resource-oriented enterprises, in which the amounts of RMB 50,000 and RMB 20,000 per 10,000 tons, indicated that the rate of change of production scale of resource-oriented enterprises significantly increased with the amount of government subsidiary. That is to say, the amount of government subsidiary showed greater sensitivity to the change in the production scale of industrial chain of construction waste reclamation. In 2020, with different amount of government subsidiary (which are taken as RMB 20,000 per 10,000 tons, RMB 50,000 per 10,000 tons, and RMB100,000 per 10,000 tons), the production scale of industrial chain of construction waste reclamation will be 11.5743 million tons per year, 13.983 million tons per year and 17.686 million tons per year; provided the amount of government subsidiary increased from RMB 20,000 per 10,000 tons to RMB 50,000 per 10,000 tons and to RMB100,000 per 10,000 tons, respectively. The effect of such subsidiary on the production scale of industrial chain of construction waste reclamation (the growth value of the production scale of industrial chain of construction waste reclamation resulted from an increase of RMB10,000 per 10,000 tons) turned out to be 803,000 tons per RMB 1 million a year and 763.750 tons per RMB 1 million a year. Obviously, the amount of RMB 50,000 per 10,000 tons of government subsidiary is the optimal to realize the rapid growth of the industrial chain of reclamation and ensure the effectiveness of subsidiary. It also explains that the production scale of resource-oriented enterprises increased with the amount of government subsidiary, while the effect of subsidiary was not the same. The greater amount does not imply large scale of the industrial chain of construction waste reclamation.
CONCLUSION AND SUGGESTIONS
In view of the small scale of industrial chain of construction waste reclamation in China, this paper from the perspective of industrial chain adopts the system dynamics to set up the simulation model of industrial chain of construction waste reclamation to simulate the development of the scale of industrial chain and the inventory of dealers. The results are shown as follows:
- In China, the development of the industrial chain of construction waste reclamation is closely related to the government's subsidy policy. According to the study, due to the lack of governmental subsidy policy, the revenues of the construction waste recycling enterprises are being affected, resulting in a slow growth of the scale of the industrial chain of construction waste reclamation. With the introduction of relevant subsidiary policies and assignment policies by the government, a significant increase is achieved in the scale of the industrial chain of construction waste reclamation. The conclusion is similar to that of the Spanish scholar on the construction waste disposal, and it has certain universality [4].
- The amount of government subsidiary is in significant positive correlation with the growth of the scale of the industrial chain of construction waste reclamation, yet the linear relationship between the effectiveness of such subsidiary amount on the growth of the scale of the industrial chain of construction waste reclamation is uncertain. RMB 50, 000 per 10,000 tons will be the optimal amount of subsidiary in the next 5 to 10 years, and it does not mean that a greater amount of subsidiary will necessarily lead to a larger scale of the industrial chain of construction waste reclamation. It has been suggested that the government reinforces the construction of waste recycling enterprises and efforts in the promotion of recycled products, to increase the share of subsidiary and reduce tax properly.
- The techniques of the industrial chain of construction waste reclamation, yet to be mature with the basic scale being relatively weak, coupled with poor confidence of the resource-oriented enterprises in the recycled products, will lead to a lack of internal power of the enterprises (confidence in the expansion of production capacity). Construction waste recycling industry chain will lead to low efficiency due to the utilization of immature recycling technology,and the small scale recycling industry chain can lead to external factor, limiting the development of the industrial chain base. This consequently will lead to slow down the pace of progress of the industrial chain, or even make it stagnant.
- Inventory optimization management (including the design of inventory regulation node and target inventory etc.) enables resource-oriented enterprises and dealer to maximize the efficiency of resource allocation, thereby speeding up the progress of the industrial chain of construction waste reclamation.
- The scale of the industrial chain of construction waste reclamation, the inventory of the dealers and the inventory of resource-oriented enterprises interact and mutually constrain eac other .Increased dealer inventory results in reduced inventory of resource-based enterprises. The process of the supply of recycled product can lead to yield production efficiency for construction waste recycling company, and can pace up the supply. The greater yield and production efficiency will make the scale of construction wastes industry chain greater.
Based on the conclusion presented above, proper recommendations are given as the follows. First of all, the government should reinforce the support for construction waste recycling enterprises and efforts in the promotion of recycled products, specifically to increase the subsidiary amount to RMB 50,000 per 10,000 tons in the next 5 to 10 years. Secondly, the government should implement assignment policies on the recycled products (to assign a proportion of recycled products in the construction unit in accordance with the nature of the project for mandatory use of the recycled products) and the accountability system in the process of implementing the assignment polices. Thirdly, the enterprises should enhance the technical development and growth of basic scale and finally, it is necessary for the enterprises to strengthen the market for recycled products.
CONFLICT OF INTEREST
The authors confirm that this article content has no conflict of interest.
ACKNOWLEDGEMENTS
This study is supported by the Young Innovative talents development program of Guangdong Education Department (No. 2014WQNCX073) and research project of universities owned by the municipal government of Guangzhou (No. 1201431441). The research was supported by the National Natural Science Foundation of China (NSFC) (No.71501052).

