All published articles of this journal are available on ScienceDirect.
Efficiency of Different Basic Modelling Approaches to Simulate Moisture Buffering in Building Materials
Abstract
The aim of this study is the numerical investigation of the capacity of porous hygroscopic building materials to damp indoor humidity variations due to external environmental loads and internal sources due to heat and moisture exchange. By means of numerical simulation, building material moisture content is computed by using a basic approach based on a diffusion model. Subsequently, a model incorporating the isothermal sorption curves of materials and complete thermal analysis is elaborated. The first modelling approach is more appropriate for material characterization even though it requires more time for modelling implementation and involves greater computational costs. The second modelling approach is useful for the assessment of hygro-thermal behaviour and energy performance of complex building components made of different materials. Moreover, this second approach can be easily applied to a 3D solid model of complex geometrical and architectural layouts. Results involve two different geometries. The first geometry belongs to a 1cm sized cube and represents the test system used in our study. The second one is representative of a usual building wall with a thermal bridge, consisting of different layers. From results analysis, it can be deduced that a more accurate numerical approach, using thermos-physical properties, porosity and hygroscopicity of materials and their corresponding sorption isotherm curves as input data, could be proposed for material characterisation and hygrothermal behaviour evaluation, in relation to the real physical indoor and outdoor transient climatic conditions. On the other hand, in many practical technical applications, our two proposed approaches can comprehensibly describe the investigated process combined with building-plant system energy performances, depending on the implementation process and computational costs we can implement.
1. INTRODUCTION
Energy saving in civil applications is a subject of great interest and primary importance. Several efforts have been made for studying innovative material combining appropriate structural performance and thermal insulating properties [1]. Ongoing research studies are also devoted to the passive building concept [2]. The use of porous materials as indoor building envelopes is a passive control technique for relative humidity amplitude control. A great deal of published research has shown the benefits from inside relative humidity variation control provided by hygroscopic materials [3-7]. The International Energy Agency (IEA) research project contributed to a more exhaustive understanding of this process [6]. Most of the literature has demonstrated that moisture buffer capacity of hygroscopic materials used in buildings influences the indoor microclimatic conditions for thermal comfort, durability and thermo-physical performances of material/envelope, indoor air quality (IAQ) and ventilation control and contributes to energy saving, due to operating hours and size reduction of the heating and ventilating air conditioning (HVAC) plant system [9-12]. It has been widely demonstrated that mould and microorganism growth on building surfaces and structural connections (e.g. thermal bridges) associated with high relative humidity levels of indoor air are connected to moisture exchanges and heat and mass transfer related to transient external and internal ambient conditions [13-15]. Moisture buffering or damping phenomena have been acknowledged by most of the literature on this subject, but investigation on fabric building components (e.g. building system with prefabricated elements/panels and thermal bridges) using material properties is still lacking. A NORDTEST project [16] on the “Moisture Buffering of Building Materials” started in 2003 suggesting an experimental test protocol. The aim of this project is to define the term “moisture buffering” that depends on sorption and vapour permeability and suggests an experimental methodology for material property characterization usually performed inside climatic chambers by cyclical relative humidity variation (8 and 16 hrs scheme respectively at 75% and 33% at a constant air temperature of 23°C).
Most of the research on this subject is based on laboratory experiments and supported by three different approach levels [15, 17-22]. At the material level, referring to the international standards for moisture storage performance, determination (i.e. sorption isotherms ISO 12571 [23] and vapour permeability ISO 12572 [24]) is carried out at stationary conditions. The MBV, Moisture Buffer Value, has also been proposed [25-26], for a direct experimental moisture accumulation capacity measurement under transient conditions. At the element/system level, where several materials can be combined by their application in different thicknesses, the ideal and practical MBV and moisture effusivity can also be derived from experimental measures of moisture accumulation capacity. At room level, moisture buffer performance is related to the moisture buffering in the whole room, and exposure areas/volumes, moisture load, ventilation rate and indoor microclimatic conditions [12] must be taken into consideration. The relation between these three experimental measurement levels is usually studied by numerical simulation of element and room behaviour using the material properties measured at the first level. In particular, energy and mass balance and interface equations are usually implemented in simulation tools and solved using numerical methods for space and time discretization. It has been fully discussed that heat and mass transfer processes with the most appropriate accuracy and computational efficiency must be taken into account, especially when the hygrothermal conditions of a room and their fluctuations over time have to be predicted by using CFD transient simulations, using control volume or finite element techniques, coupled with detailed models for the building envelope and moisture buffering materials (e.g. multi-layered components and thermal bridges) including hysteresis effects and absorption/adsorption and desorption isotherm curves [10, 12, 26-28]. The whole physical process is always regarded as the “Moisture buffer effect or performance of a room” and it is directly related to the material properties (porosity, density, permeability) that determine moisture absorption and releasing behaviour, but also the ventilation rate, total moisture load and external climate. The opportunity of “controlling” indoor moisture content by applying specific building materials represents a crucial item for improving thermal comfort, IAQ and energy saving by reducing the HVAC systems operating hours for ventilation control and air conditioning. Much research has developed detailed Heat, Air and Moisture (HAM) analysis of materials usually exploited for building envelopes. Most of these studies are based on the 1-D approach and for this reason, the investigation could be limited to real-world applications, which can introduce thermo-physical parameter variability and complex analyses due to geometrical arrangements of different materials in multi-layered building envelopes and complexity in boundary condition definitions [15, 17]. On the other hand, different complexity levels, ranging from pure diffusivity models to the more complex models incorporating pore space description used to obtain the hygrothermal transport and storage functions, can be applied to solve the moisture balance for different specific applications. The phenomenon is really complex: hygrothermal modelling approaches have been proposed [8] to study interactions between building materials and indoor environments due to the coupled whole building (WB) and HAM response; simplified approaches have been suggested based on simple lumped models for material moisture buffer effect assessment in the environment, whose parameters are often obtained from the MBV experimental procedure and based on the Effective Moisture Penetration Depth (EMPD) [25].
In the present study, we propose a comparison of results carried out by two different 3-D modelling approaches in order to simulate the moisture buffering in porous materials used for building applications. Our mathematical formulations are grounded in the choice of the relative humidity as driving potential since it is continuous at the interface of two layers of materials with different moisture storage properties. Simulation models were developed by using a finite elements method (FEM) and multiphysics approach with a growing level of complexity, starting from an isothermal diffusion model to a non-isothermal transport-diffusion model for porous media. As a consequence, in our present work, different methodological approaches were proposed and applied to geometrically and constitutive non-symmetrical systems, in order to highlight the suitability of complete 3-D models for describing the physics involved. The widely employed NORDTEST methodology was used as a testing condition for the studied systems. In the framework of the studies finalized to contextualize moisture buffering in building materials, our research work can contribute to defining consistent compromises for specific applications between levels of complexity of the modelling approach and relative operative/computational costs needed for building-up and running the simulation models. Our dynamic simulation models can be a useful tool to evaluate the moisture buffer performances of different building components, with complex multi-layered geometry, and then to provide fundamental guidelines for energy design of the building-plant system.
2. MATERIALS & METHODS
2.1. Governing Equations for Numerical Modelling
Two different approaches were used to simulate the moisture transfer for the investigated applications. The first one (labelled from now on “MOD_01”) was carried out from pure diffusive modelling. Relative humidity (ϕ) was used as a potential function in the mathematical formulation. The corresponding governing equation is given below:
 |
(1) |
Where ϕ is the depended variable, δp is the vapour permeability, psat is the saturation pressure, ρ 0 is the material density and ξ is the moisture capacity. The diffusion approach was used to simulate the moisture buffering process in a test section under the external thermo-hygrometric conditions imposed by the NORDTEST [16]. Following this protocol, materials must be subjected to cyclic variation of relative humidity between a bottom and a top level; 33% being the lower value of ϕ kept for 16 hrs and 75% as the upper one kept for 8 hrs. These conditions should also be based on a constant temperature of 23 °C. Therefore, this first modelling approach did not keep into account the energy equation solution, and the saturation pressure was taken as a constant value in eq. (1). Under this assumption, a global diffusion coefficient was evaluated as:
 |
(2) |
Where:
 |
(3) |
A second numerical approach (labelled from now on “MOD_02”) was applied in order to consider the effect of temperature variation on the moisture capacity of the studied material. This means that the sorption isotherms curves were numerically exploited to solve the following partial differential equation:
 |
(4) |
Where:
 |
(5) |
Eq. (5) represents the sorption isotherm or the well-known moisture storage curve. The variation of the saturation pressure with temperature was also considered by using the Antoine equation [29] given below:
 |
(6) |
Temperature distribution can be computed by solving the energy equation, as follows:
 |
(7) |
In Eq.(7), the apostrophe on the specific heat (Cp) and thermal conductivity (λ) indicates the effective value of the thermo-physical property (referred to moisture), while m is the amount of moisture changing phase and hlv is the phase change enthalpy.
2.2. The Physical System Definition
Two systems were used for our investigation (Fig. 1). The first one, called <SYS_01> corresponds to a test section: it is a plaster 10 x 10 x 5 cm block. This system was used to test the two different modelling approaches applying the boundary conditions imposed by the NORDTEST protocol.
The second system, called <SYS_02>, represents a widespread application, consisting of a portion of an external wall with different layers and typical thermal bridge. The multi-layered wall consists (from the internal to the external surface) of a plaster layer, a lime layer, two brick walls separated by an insulating layer and an external plaster. In the studied system, the horizontal structure consists of a floor, a lime and a brick layer.
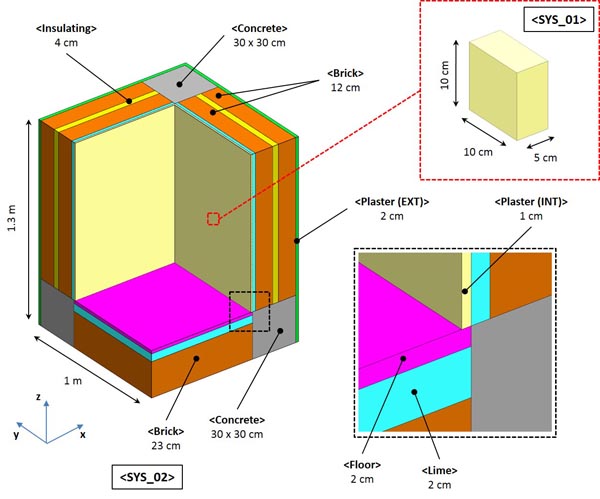
Concrete beams joining each other in the corner cause an interruption in the wall insulation, assembling a classical thermal bridge. Properties of considered materials are reported in the following Table 1.
| Density | Moisture capacity | Vapour permeability | Thermal conductivity | Specific Heat | |
|---|---|---|---|---|---|
| [kg/m3] | [kg/m3] | [kg/(m∙s∙Pa)] | [W/(m∙K)] | [J/(kg∙K)] | |
| Brick | 700 | 11.1 | 1.23E-11 | 0.16 | 750 |
| Lime | 500 | 12.3 | 2.31E-11 | 0.12 | 1250 |
| Laminated wood (floor) | 800 | 91.4 | 7.41E-14 | 0.15 | 1600 |
| Gypsum plaster (INT) | 850 | 7.9 | 2.23E-11 | 0.20 | 840 |
| Concrete | 2200 | 66.3 | 2.0E-12 | 1.60 | 795 |
| EPS (insulating) | 20 | 0.2 | 1.48E-12 | 0.04 | 1500 |
| Mineral plaster (EXT) | 1900 | 56.3 | 7.41E-12 | 0.80 | 850 |
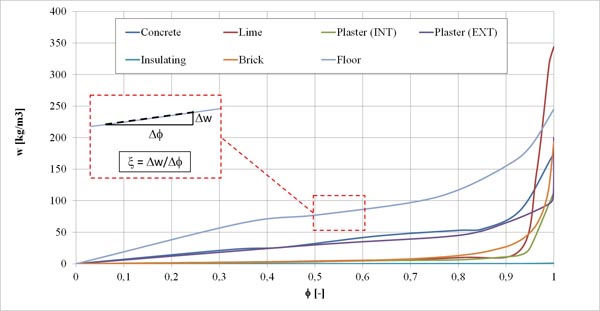
As introduced before, we used two different simulation approaches. In the first one, we used constant values of physical properties for all the materials as reported in Table 1. In this case, the numerical value of the moisture capacity for each material corresponds to the slope of the sorption curve computed for the intermediate values of the relative humidity (RH-range corresponding to 40-60%). Fig. (2) shows the sorption curves for the considered materials and a graphical representation of the procedure adopted for evaluating the constant value of the moisture capacity. This procedure consists of a discrete derivative evaluation of each sorption curve based on a linearization of the moisture content variation as a function of the relative humidity in the above-mentioned intermediate range of variation.
For the second simulation approach, the sorption isotherm curves and their RH-derivative were directly used in each model, in order to compute the slope of the sorption curve (moisture capacity) as a function of the spatial distribution of the relative humidity during transient analyses. In particular, the sorption isotherm utilization in the physical model, allows consideration of the equilibrium moisture content of a porous material as a function of relative humidity at a specific temperature. By coupling the solutions of the diffusion model with those of the thermal analysis it was also possible to relate values of the saturated vapour pressure with temperature distribution within the different studied materials.
Boundary conditions applied to <SYS_01> can be summarized as follows: according to NORDTEST experimental tests, the “exposed” faces (bigger ones) are loaded by a periodic relative humidity variation, while the other surfaces are considered insulated. A surface convective coefficient (Zs = 2.7E-3 s/m) was used in the analytical expression of the imposed flux boundary condition. In <SYS_02>, we used the hourly climatic data of the Standard year of Florence (Italy) calculated by the method provided [30] as the external load to the building envelope (air temperature and relative humidity). Otherwise, for the inner wall surfaces, we considered a controlled fixed (20 °C) temperature value and a periodic variation of the indoor relative humidity representative of vapour generation released by occupants.
2.3. Numerical Solution
Eq. (1), (4) and (7) with their correspondent boundary conditions were numerically solved by using a FE-based approach for spatial discretisation in COMSOL Multiphysics modelling environment. Numerical meshes consisted of non-structured and non-uniform computational grids made up of tetrahedral Lagrange elements of the second order. The influence of spatial discretization was preliminary checked, in order to assure mesh-independent results.
Grid test results and basic modelling suggestions carried out from the mesh study for the test section <SYS_01> are provided in Table 2. The given maximum relative gap refers to the maximum difference of transient relative humidity values computed along a 5-day simulation. Values of ϕ are calculated at the centre of the <SYS_01> block.
The maximum relative gaps shown in Table 2 were normalized with respect to the finer grid refinement used for the mesh study (Mesh #3).
| Mesh #1 | Mesh #2 | Mesh #3 | ||
|---|---|---|---|---|
| Maximum element size | [m] | 2E-2 | 1E-2 | 5E-3 |
| Number of elements | 1706 | 8486 | 69430 | |
| Maximum relative gap | 0.70% | 0.05% | - |
Results do not appear particularly dependent on spatial discretisation. Finally, the computational grid Mesh #2 was retained for computations of <SYS_01>. Analogous values of size elements were used for system <SYS_02> spatial discretisation. Time-marching was performed by adopting an Implicit Differential-Algebraic (IDA) solver, based on a variable-order and variable-step-size Backward Differentiation Formulas (BDF). Because the time-marching scheme is implicit, a nonlinear system of equations was solved for each time step by applying a modified Newton algorithm. Algebraic systems of equations coming from differential operator discretization were solved by a PARDISO package, a parallel direct solver particularly efficient for solving unsymmetrical sparse matrixes by a LU decomposition technique.
3. RESULTS AND DISCUSSION
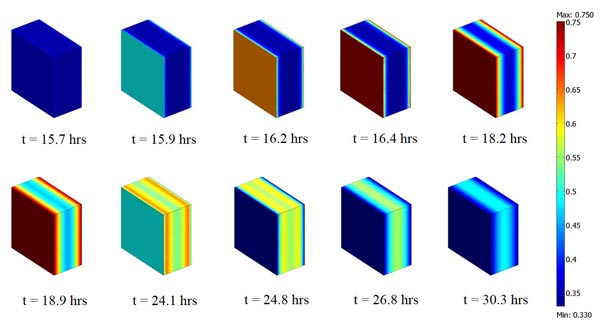
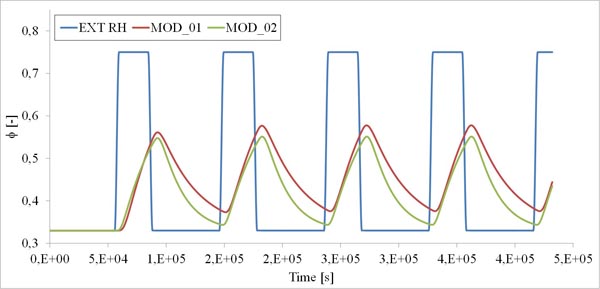
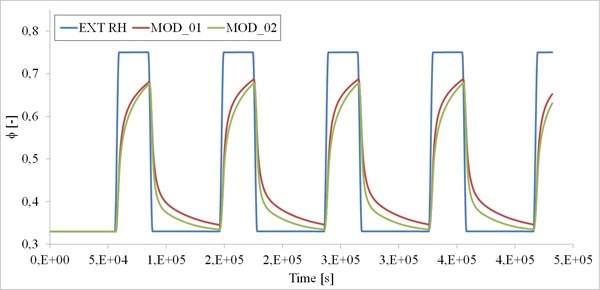
Numerical simulations were initially carried out in order to assess difference in moisture buffering capacity simulated by the two different approaches applied to the test system <SYS_01>. A 5-day simulation was performed following the two different approaches, by considering the same initial condition (ϕ = 0.33) applied to the gypsum plaster block. As introduced, the NORDTEST protocol conditions were applied to the external and exposed surfaces of the block by considering a surface resistance film to the vapour penetration. Fig. (3) shows by means of a colour map, the relative humidity variation during a period of absorption and releasing phases of moisture in the considered material. Fig. (4) gives the time-history of the relative humidity computed for <SYS_01> with different numerical modelling, for which the label MOD_01 indicates the simplest one (constant moisture capacity) and MOD_02 indicates the more detailed one (variable moisture capacity). The ϕ values are computed at the block centre (x=0.025; y=0.05; z=0.05). The applied cyclic load to the block is also given (blue line). A time-shift between external load and internal relative humidity variation is clearly observable for both the modelling approaches.
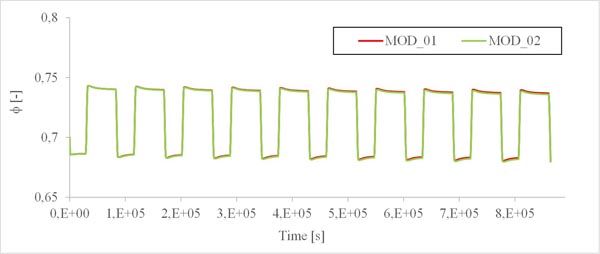
From the results analysis shown in Fig. (4) it clearly appears that the MOD_01 approach utilization determines an overestimate of the moisture buffering capacity of the studied material. The relative difference of the ϕ values assessed at the block centre by the two models reaches 13.4%. By the way, if a technical practical application is considered, the inner wall plaster thickness is commonly 10 mm. By plotting the ϕ values evaluated by the MOD_01 and MOD_02 at a 5 mm depth (half of the common plaster layer thickness)(Fig. 5), the maximum relative difference between the numerical values of ϕ becomes 8.6%.
This means that at the “material level”, a detailed approach involving more complex modelling and more higher computational costs is fully justified.
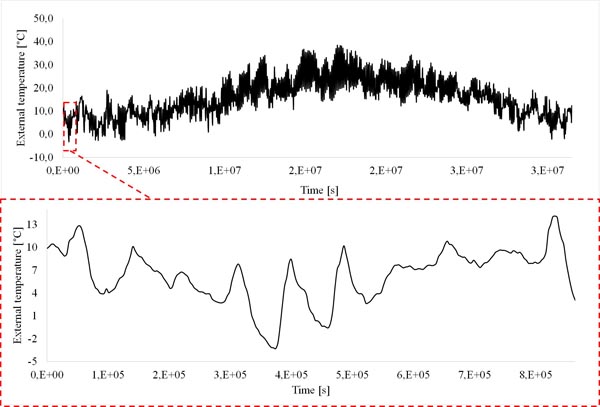
In order to better understand the differences due to a technical application, the <SYS_02> was also investigated by adopting two different numerical approaches. In this case, the second modelling procedure was further complicated by a non-isothermal formulation used for the algebraic model. Moreover, real climatic conditions were considered as the external thermo-hygrometric load, corresponding to the used hourly climatic data for Florence during the 10 days of January of the Standard Year (Figs. 6 and 7).
This period was chosen for transient simulations because it involves the most critical thermo-hygrometric external conditions compared to the annual trend (enlargement in (Figs. 6 and 7)). Relative humidity reaches a peak of 90%, when at the same time, the air temperature values are close to 0°C or lower. The internal climatic conditions considered as boundary conditions for the model are connected to a controlled indoor temperature (20 °C) and periodic variation of the relative humidity in the range 40% (16 hrs) - 80% (8 hrs). This corresponds to a variation of the indoor vapour production of 7.4 g/m3, that could be considered a reasonable amount produced by the usual activity of two persons standing.

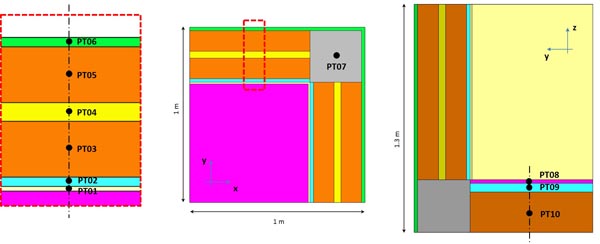
In order to compare the different approach used in the <SYS_02> simulation under the introduced hygrometric loads, time histories of relative humidity evaluated at the half thickness of each material layer were considered. Position of points chosen for time-history investigation is graphically indicated in Fig. (8).
Time history representation is provided in Figs. (9 and 10) for the internal and external plaster of the wall (PT01 and PT06). Labels “MOD01” and “MOD02” in the graphs indicate the first and second modelling approach used to carry out the plotted results. It is clear that a significant gap between the time-history of the relative humidity can be noticed for the internal plaster layer (gypsum plaster). This difference is lower for the external plaster layer (mineral plaster). However, the maximum relative gap between the values computed by the two simulation approach results (normalized with respect to the second one, MOD02) for the gypsum layer amounts to 4.7%, and thus is lower than the corresponding value computed for the <SYS_01>. In particular, the <SYS_01> was studied according to the NODTEST laboratory protocol. The maximum relative gap found for the external plaster layer in <SYS_02> is 2.0%. Graphs of the relative humidity time evolution in the lime layers (PT02 and PT09) are shown in Figs. (11 and 12).


For the lime layer applied on the vertical wall, an important gap can be observed: the maximum relative gap over the simulated time period is 6.9%. For the lime located under the floor, the gap is really the lowest with a value of 0.08%. This was an expected result; although PT02 and PT09 refer to the same material, the horizontal lime layer is overlapped by the laminated wood floor, whose water permeability value is very low. For this reason, the floor hygrothermal behaviour is similar to that provided by a vapour barrier. As a consequence, the internal load is very slightly “detected” by the underfloor lime layer. For the laminated wood floor, the relative gap in humidity variation between the MOD01 and MOD02 simulation approaches is very low again Fig. (13), where the maximum value for PT08 is 0.15%). This effect proves that for this material, the vapour permeability effect is preponderant compared with the moisture buffering capacity, independent of the approach used for simulating it.


Referring to all of the remaining layer/material of the studied building component, relative gaps carried out by the MOD01 and MOD02 simulation results are very slight and consequently, numerical values of the maximum relative differences are given in Table 3.
| Arrangement | Material | Maximum relative gap
|
|
|---|---|---|---|
| PT01 | Vertical wall | Gypsum plaster | 4.76% |
| PT02 | Vertical wall | Lime | 6.97% |
| PT03 | Vertical wall | Brick | 0.11% |
| PT04 | Vertical wall | EPS | 0.23% |
| PT05 | Vertical wall | Brick | 0.14% |
| PT06 | Vertical wall | Mineral plaster | 2.00% |
| PT07 | Structural element | Concrete | 0.21% |
| PT08 | Horizontal (floor) | Laminated wood | 0.15% |
| PT09 | Horizontal (floor) | Lime | 0.08% |
| PT10 | Horizontal (floor) | Brick | 0.01% |
Results obtained for the <SYS_02> clearly indicate that for heat and mass transfer assessment in a building system, a simplified approach for moisture transport simulation is proved and justified in order to save computational resources addressing model implementation and computational costs for running simulation. However, these results are comparable with those obtained by the more detailed simulation approach, even if they can be very useful for an in- depth material characterisation and its hygrothermal behaviour related to microclimatic indoor/outdoor variations. In this case, greater effort is required during pre-process phase and simulation runs.
CONCLUSION
We applied two modelling approaches for simulating the moisture buffering in building materials. In both the procedures, the relative humidity was chosen as a driving potential in the governing equations. The first procedure was based on a pure diffusive approximation, while the second one allowed consideration of the effect of temperature variation on the moisture capacity of the different materials by means of the sorption curves. The two approaches were applied to a material “test-section” and a common thermal bridge application, in order to perform transient analyses under time-dependent thermo-hygrometric constraints. Results clearly show that:
- a simplified approach generally determines an overestimation of the moisture buffering capacity in the materials;
- a more accurate numerical modelling appears to be much more suitable for describing the moisture content variation in materials at slight depths from the exposed boundary (both indoor and outdoor);
- the vapour permeability of materials plays a preponderant role with respect to the moisture buffering capacity, independent of the approach used for computing it;
- a more in-depth (and computational cost) approach appears useful at the “material level”, in order to analyze material response to thermal and hygrometric time-variation; although it is more complex, it allows better characterization of the thermo-physical and hygrometric behaviour of a chosen material;
- in technical building applications, the use of a simplified approach provides more consistent results by reducing efforts in numerical model implementation and simulation time. In addition, simplified modelling determines advantages in terms of flexibility, due to its easy implementation within any dynamic building-plant system model.
By being based on these items, our study can contribute to setting out the basic criteria and helpful strategies in an approach to numerical simulation for studying humidity buffer effects of porous building materials/elements involving absorption, storage and desorption of water vapour. In perspective, our proposed methods can be profitably applied to passive/indirect control of indoor humidity by the building materials as damping and/or reducing effects for indoor mechanical ventilation and air conditioning.
| Symbol | Description | SI unit |
|---|---|---|
| Dw | Moisture diffusivity | m2/s |
| Cp | Specific heat capacity | J/(kg∙K) |
| hlv | Latent heat of condensation/evaporation | J/kg |

|
Mass rate of moisture changing phase | kg/s |
| Psat | Saturation vapour pressure | Pa |
| t | Time | s |
| T | Temperature | K |
| Xi | Generic spatial coordinate | m |
| W | Moisture content | kg/m3 |
| Greek symbol | ||
| δp | Vapour permeability | kg/(m∙s∙Pa) |
| ϕ | Relative humidity | - |

|
Density | kg/m3 |
| λ | Thermal conductivity | W/(m∙K) |
| θl | Sorption capacity | kg/m3 |

|
Specific moisture capacity | kg/m3 |
CONFLICT OF INTEREST
The authors confirm that this article content has no conflict of interest.
ACKNOWLEDGEMENTS
Declared none.

