All published articles of this journal are available on ScienceDirect.
Seismic Performance Evaluation of Existing RC Buildings Without Seismic Details. Comparison of Nonlinear Static Methods and IDA
Abstract
The inelastic response of existing reinforced concrete (RC) buildings without seismic details is investigated, presenting the results from more than 1000 nonlinear analyses. The seismic performance is investigated for two buildings, a typical building form of the 60s and a typical form of the 80s. Both structures are designed according to the old Greek codes. These building forms are typical for that period for many Southern European countries. Buildings of the 60s do not have seismic details, while buildings of the 80s have elementary seismic details. The influence of masonry infill walls is also investigated for the building of the 60s. Static pushover and incremental dynamic analyses (IDA) for a set of 15 strong motion records are carried out for the three buildings, two bare and one infilled. The IDA predictions are compared with the results of pushover analysis and the seismic demand according to Capacity Spectrum Method (CSM) and N2 Method. The results from IDA show large dispersion on the response, available ductility capacity, behaviour factor and failure displacement, depending on the strong motion record. CSM and N2 predictions are enveloped by the nonlinear dynamic predictions, but have significant differences from the mean values. The better behaviour of the building of the 80s compared to buildings of the 60s is validated with both pushover and nonlinear dynamic analyses. Finally, both types of analysis show that fully infilled frames exhibit an improved behaviour compared to bare frames.
1. INTRODUCTION
Existing reinforced concrete (RC) buildings designed according to the old Greek codes represent typical construction practice of many Southern Europe countries. These buildings date back to the 60s up to late 80s and represent the majority of the existing building stock. Consequently, the seismic performance of these buildings needs to be investigated. They were designed for low seismic coefficient using simple models without ductility detailing and capacity design provisions for buildings before 1984 or simple capacity design provisions for buildings after 1984 and before the application of the new codes. Their performance is significantly influenced by the existence of masonry infill walls and their distribution. A large number of researchers have studied the in-plane behaviour of infilled frames [1-17]. It is obvious through their studies that infill walls can act beneficially or unfavourably, depending on their distribution, and, if used properly, can provide a practical alternative for retrofitting existing structures to resist seismic loads.
Existing buildings have suffered during the strong earthquakes in Greece in the past 30 years (Thessaloniki 1978, Alkyonides 1981, Kalamata 1986, Aigio 1995, Kozani 1995, Athens 1999, Lefkada 2003, Kefallonia 2014 earthquakes) and worldwide (Mexico 1985, Chi-Chi 1999, Kocaeli-Izmit 1999, L’Aquila 2009, Christchurch 2011 earthquakes). The differences in seismic response between new and existing RC structures during recent earthquakes brought forward the need to quantify their performance characteristics, with particular emphasis in existing buildings, since these exhibit higher vulnerability to earthquake excitation and suffered most of the damage. The seismic response of these buildings is characterized by substantial uncertainty. During past earthquakes many deficiencies were reported for existing RC buildings, such as low concrete strength, weak column - strong beam behaviour, short column behaviour, inadequate splice lengths, poor confinement of end regions of columns and beams and improper hooks of the stirrups, leading to weaker than desired buildings [9, 18-20].
Reliable seismic assessment of existing buildings is very important. Several simple nonlinear static procedures have been developed, such as Capacity Spectrum Method (CSM) [21], Displacement Coefficient Method (DCM) [22] and N2 Method [23], which is also employed in Eurocode 8 [24], and later improved procedures were developed by other researchers [25-29]. These procedures were compared with nonlinear dynamic analyses by many researchers in order to validate their accuracy [30-33]. The results from nonlinear dynamic analyses are considered more accurate; however, this type of analysis is very time consuming. On the other hand, nonlinear static procedures offer simplicity with reasonable accuracy. Nevertheless, different nonlinear procedures often provide substantially different estimates of target displacement for the same ground motion and structure.
The objective of this paper is the seismic performance evaluation of representative existing RC buildings, typical of the inventory of existing building in Southern Europe countries. For this reason, a 5-storey and a 7-storey buildings are selected, designed according to Old Greek Design Codes [34, 35], in order to represent typical buildings of the 60s and the 80s. The significant influence of masonry infill walls in the seismic behaviour of a structure is also validated. The seismic performance of these buildings is evaluated with more than 1000 pushover and nonlinear time history analysis. Two simplified nonlinear static methods are used for the estimation of the target displacement and their results are compared with the results from nonlinear dynamic analyses.
2. DESCRIPTION OF BUILDINGS
The buildings analysed in this study are representative cast-in-place RC structures with no plan irregularity. The buildings are typical building forms of the 60s and the 80s.
Buildings of the 60s were designed following allowable stress procedures of the 1959 seismic design code [34], using grade B160 (equivalent to C12) concrete and smooth S220 reinforcement with allowable design stress of 140 MPa. Seismic design was based on a three-zone classification system, the seismic base shear coefficient in the three zones on hard soil being equal to 4%, 6% or 8% of the structural weight equal to the sum of unfactored dead plus live loads. Only simplified design models were used for analysis, with a special check for perimeter columns and beams, while interior beams were usually designed for gravity loads only. Neither critical region reinforcement for confinement nor any capacity design provisions were used in design. Buildings of this period are typically characterized by dense and regular column spacing with relatively short bay sizes (3.0 to 4.0 m) and no use of any shear walls. The perimeter frames are infilled with double leaf unreinforced masonry walls 25cm thick, with regular location of openings. Furthermore, voids in the infill layout may be encountered at the ground when the use of the building has changed from residential to commercial during its service life.
Buildings of the 80s were designed according to MOD84 [35], Interim Modifications of the RD59, that introduced modifications to the method of analysis and the lateral load distribution from uniform to inverted triangular and introduced ductile detailing provisions, such as the use of multiple closed stirrups with reduced tie spacing at the end member critical regions and a pseudo joint capacity design. Seismic base shear coefficient remained the same. Concrete B225 (equivalent to C16) and ribbed S400 reinforcement were used. The column spacing is usually regular but the bay sizes are increased between 5.0 up to 7.0 m. An open first storey pilotis system, in which the use of infill walls is completely avoided, is also fairly common, following a growing need for commercial development or parking space in residential areas. Shear walls (primarily an elevator core and/or walls along the perimeter) are typically used.
Two building forms are considered, a 5-storey and a 7-storey RC building (Fig. 1). The buildings are four by three bays in plan. The 5-storey building (denoted K60) is a typical building of the 60s with a storey height of 3.00 m and regular 3.50 m bay sizes in each direction. The 7-storey building (denoted K80) is a typical building of the 80s with a storey height of 3.00 m and regular 6.00 m bay sizes in both direction. Despite the introduction of a shear wall core in the 80s at the elevator shaft, building K80 is designed without the presence of this shear wall for comparison with the earlier generation of bare frames. Furthermore, in order to examine the influence of infill walls, both the bare frame structure as well as a structure with fully unreinforced masonry infilled perimeter frames (denoted as T60) are analysed for the 5-storey building (Fig. 1).
The design loads adopted are the structure self-weight, a surcharge equal to1.50 kN/m2 and a live load of 2.00 kN/m2. The interior masonry infills are modelled as an additional uniform surcharge load over the entire floor plan, equal to 1.00 kN/m2, while the weight of the exterior infill walls is applied directly on the perimeter frame beams, expressed as a uniform load of 3.60 kNper meter height of the wall per meter length.
For every building, detailing practices adopted at the time of construction (bent up bars in beams, lack of proper anchorage of the bottom bars at interior joints etc.) were considered. The buildings were considered to be in seismic zone I and were designed with a seismic base shear coefficient equal to 0.04 of the structural weight, which is equal to the sum of dead and live loads. The 5-storey building K60, designed according to the 1959 seismic design code, has 350x350 square columns at the first floor, reduced to 300x300 at the second floor and further reduced to 250x250 at the third floor up to the roof. Beams’ dimensions are 200/500. In contrast to the 60s frames, building K80 of the 80s has 600x600 square columns at the two lower stories. These dimensions gradually reduce every two stories by 100 mm to 300x300 at the roof. The dimensions of the perimeter beams are 250/500, while the interior beams increase to 200/600.
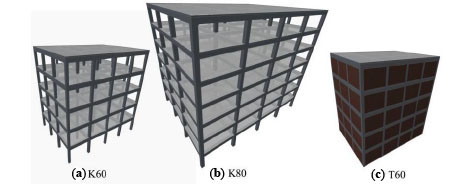
Selected buildings and fully masonry infilled frame.
3. NUMERICAL MODELLING
3.1. Reinforced Concrete Members
All buildings are modelled for inelastic pushover and time history analysis as plane frames, using an extended version of the computer program Drain-2DX [36].Vertical loads and corresponding masses are estimated from the dead loads plus 30% of the live load. Beams and columns are modelled using the two component lumped plasticity beam column element (type 02) with the hysteretic characteristics shown in Fig. (2a). The slab reinforcement within the effective width is included in the calculation of the flexural inelastic characteristics of the beams in negative bending. Effective slab widths of 1.0 m and 0.5 m are adopted for the 3.5m spans, while 1.30 m and 0.65 m are used for the 6.0m spans, for internal and external frame beams respectively.
Inelastic moment-curvature diagrams are calculated for each critical region using average material properties, taking into account the effect of axial load in the columns. The mean concrete strength is assumed to be equal to 16 MPa and 22.5 MPa, for concrete grades B160 and B225, respectively. Separate confined core and cover concrete constitutive models are considered. The average yield stress of the reinforcement is equal to 310 MPa and 430 MPa for S220 and S400, respectively, while the ultimate tensile strength is assumed to be 420 MPa and 630 MPa. The steel is modelled as having trilinear stress-strain characteristics.
3.2. Perimeter Infills
In this study the perimeter infill walls are modelled with diagonal struts, resisting loads only in compression. An element type has been developed for this purpose in the base program Drain-2DX by Tassiou [37], as an extension of the simple inelastic asymmetric truss bar type 01, having the cyclic characteristics given in Fig. (2b). The parent trilinear envelope curve follows the formulation suggested by Zarnic et al. [38] and consists of zero (or small) tensile response, followed by an elastic and a post-cracking part in compression with positive stiffness, and a post-peak softening part with negative stiffness. The mechanical properties of the masonry are evaluated using the expressions described in [18]. According to standard practice all exterior infill walls are double leaf with a total thickness of 25 cm. The compression strength fm of the masonry infill was assumed to be 2.5 MPa and the corresponding modulus of elasticity Ew being equal to 750 ·fm [39]. Maximum resistance of the infills is reached at an interstorey drift of 0.5%. The main parameters of the infill resistance-deformation envelope for building T60 are summarised in Table 1.
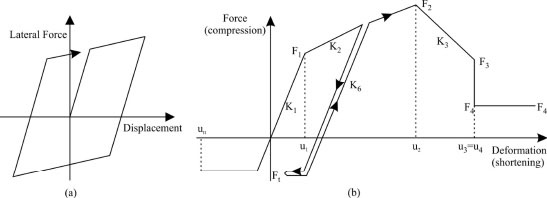
Hysteretic behaviour of (a) line elements and (b) infill walls
Strength (F) and stiffness (K) properties of the equivalent diagonal compression strut (For notation refer to Fig. (2b)).
|
fm [MPa] |
Width [m] |
Height [m] |
Stiffness K1 [kN/m] |
Fy = F1 [kN] |
Fmax = F2 [kN] |
u2 [m] |
K3 / K1 |
u3 [m] |
F3 = F4 [kN] |
|---|---|---|---|---|---|---|---|---|---|
| 2.5 | 3.5 | 2.5 | 27859.5 | 121.5 | 243.0 | 0.015 | -0.10 | 0.089 | 36.5 |
4. SEISMIC EVALUATION METHOD
4.1. Pushover Evaluation of Overstrength, Ductility and Behaviour Factor
The inelastic performance of existing RC frames has been investigated using a static pushover analysis methodology described thoroughly in [18]. The overstrength of the structure is evaluated from pushover analysis as the ratio of base shear at failure to ultimate limit state (ULS) reference base shear, equal to the allowable stress level design base shear multiplied by a material strength correction factor [18]. Ductility capacity is evaluated as the ratio of failure to yield displacement, for an equivalent bilinear system. Subsequently, the behaviour factor is evaluated from ductility ratio, as described thoroughly in [18]. Finally, maximum lateral roof deformation capacity of the buildings is compared with target displacement demands, determined from simplified nonlinear static procedures. In this study, the Capacity Spectrum Method (CSM) proposed by ATC-40 [21] and the N2 Method by Fajfar [23] are used for the evaluation of the target displacement demand imposed on the buildings examined.
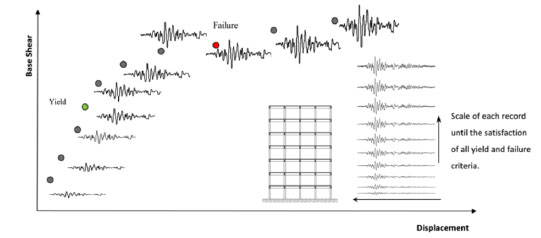
Incremental dynamic capacity curve.
4.2. Incremental Dynamic Analysis Evaluation of Ductility and Behaviour Factor
Incremental dynamic analysis (IDA) [40] or Dynamic Pushover Procedure [41] is a parametric method for the estimation of structural response under seismic loads. The objective of an IDA study is the understanding of structural behaviour under different levels of seismic intensity. A structural model is subjected to multiple level of seismic intensity using one or more ground motion records. Presently, IDA is a state-of-the art method to determine the global collapse capacity of a structure. The use of an IDA approach was one of the two alternative methods proposed in the Background Document of EC8 [24] for the estimation of the behaviour factor of frame buildings and had been used in [42, 43] to evaluate the available q factor of modern irregular RC buildings designed according to this code. Later, the method has been generalised for seismic hazard analysis in a probabilistic context, directly relating the earthquake magnitude to a critical damage index [44].
The results of the pushover study are compared herein using equivalent performance index predictions from plane frame IDAs, using the same set of limit criteria (LC). A large number of actual base excitations are used, as described later on. For each record, nonlinear dynamic analyses are performed for different intensities, until all yield and failure criteria are satisfied. Maximum base shear, spectral acceleration or pga vs top displacement from each analysis is plotted to show the IDA curve (Fig. 3).
Similar to pushover, the quantification of structural performance is made both at the global and the local level. The behaviour factor q is evaluated as the ratio of the elastic spectral acceleration of the collapse record (Sa)elc and yield record, (Sa)elv [45]. Considering that spectral amplification is constant, this can be evaluated as the ratio of the peak ground acceleration (pga) of the collapse earthquake to the pga of the yield earthquake. Yield record is the record with the minimum pga that causes yield in any element of the structure, while collapse record is the record with the minimum pga signifying conventional collapse. Similarly, ductility is evaluated as the ratio of the collapse δc to yield displacement δy, where displacement is the maximum roof displacement resulted from dynamic analysis of these two records. The building q and ductility capacity μ are hence obtained from Eq. (1)
 |
(1) |
4.3. Limit State Criteria
For the estimation of conventional collapse under pushover and dynamic excitation the same local and global LC are adopted, both at the member and at the structural level. The analytical assumptions of the LC considered were presented in detail in [18]. Step by step checks are performed for pushover and time history analysis, evaluating if:
- The plastic rotation of the columns exceeds the corresponding plastic rotation capacity of the section at the critical region (LC designated θpl). This is defined as the product of the ultimate curvature of the critical section and the plastic hinge length, equal to half the effective depth or according to an empirical expression proposed in [39], whichever governs;
- The shear strength exceeds the strength calculated according to the currently enforced design Code, using mean material properties (LC designated V);
- The interstorey drift under dynamic excitation is less than 1.25% for all frames (LC designated dr) This value is adopted for existing RC frames based on experimentally determined failure limits of typical existing RC columns [46];
- Theinfill strut compressive strength is not exceeded by the demand, as described in more detail in [18] (LC designated Inf).
4.4. Post-Processing of the Results
A computer program, DrainExplorer [47], was developed to post process the nonlinear analysis results and monitor in a step-by-step manner the state of the structure during nonlinear static pushover and/or time history analyses. The program reads the frame geometry and member reinforcement details, load profiles and inelastic analysis results from Drain-2DX [36]. Subsequently, it calculates the cross-section inelastic characteristics of all the structural members, generates the pushover or time history curve, evaluates and checks all limit criteria step by step and plots the corresponding points on the curve where these limits are exceeded. For static pushover analysis it compares the collapse displacement with the target displacement evaluated using two alternative capacity spectrum methods proposed in the literature, Capacity Spectrum Method proposed by ATC-40 [21] and N2 Method by Fajfar [23]. Furthermore, in each step of pushover or time history analysis, vertical interstorey drift distribution, plastic hinge distributions, magnitude of the inelastic rotational demands in all the elements and local energy absorption per storey among the beams, columns and walls, if any, of the structure are provided. Furthermore, the condition of the infill walls, where they exist, is established also in each step.
IDAs were also performed with the help of this program. It post processes the results of each analysis of Drain-2dx, prepares the input file for the next dynamic analysis of the IDA. The algorithm performs successive refinements around first yield and collapse pga, to establish the structure’s q and ductility capacity. Finally the program plots the IDA curve, as shown in Fig. (4). For each intensity level, the failure criteria is identified and shown in the results. Finally the program calculates the available ductility and behaviour factor.
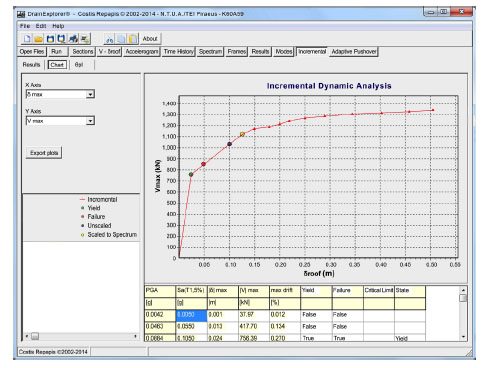
Maximum base shear vs maximum roof drift obtained from IDA, with indication of the pga excitation levels at yield and collapse.
4.5. Joint and Shear Capacity Ratios
For each structure analysed herein it is examined whether the weak beam/strong column criterion is satisfied. To this purpose, the ratio of the sum of the capacity moments of the columns at a joint to the sum of the capacity moments of the beams adjoining this joint (ΣMRC / ΣMRb) is calculated. Values of this ratio smaller than one indicate that the capacity check is not satisfied at the joint and the beams are stronger than the columns. The post processing program also calculates the ratio of the shear resistance to the shear demand resulting from the capacity design in each member end, for each step of the analysis and the results are plotted on the frames. Values less than one indicate that the capacity design for shear is not satisfied for the specific member’s end.
5. PUSHOVER AND TIME HISTORY ANALYSES RESULTS
5.1. Pushover Results
Static inelastic pushover analyses are performed with uniform and triangular distribution of lateral loads for both buildings. Regarding the local collapse criteria of a structural member, it is assumed that failure of the structure occurs only if a limit is exceeded in a column, assuming that the building does not collapse if a beam fails.
The capacity curve, base shear vs. roof displacement is shown in Fig. (5) for the typical building of the 60s with and without infill walls, and for the typical building of the 80s, for uniform and triangular lateral load patterns, together with an equal area bilinear approximation for the estimation of the available ductility and behaviour factor. These curves give important properties of the structures, such as the initial stiffness, the maximum strength and yield global displacement. At the same graph, the roof deformations at which the limit state criteria considered are exceeded in any of the members are also shown, together with the corresponding performance point demands following two performance point estimation methods, CSM and N2. Furthermore, the design base shear Vd and the ultimate limit state (ULS) reference base shear Vu (see 4.1) for all frames are also shown, in order to quantify the overstrength of the structure. Interstorey drift limiting criterion is observed at large deformations and it never seems to be critical for existing buildings, as also presented for more building forms in a previous study too [4]. For all the frames, it is observed that the critical limit state criterion is the plastic hinge rotation capacity. Shear failure is observed in columns of the infilled frame but in larger displacement. Failure of infill walls occurs but is not critical too.
The results of the static pushover analyses are presented in Table 2. These are the maximum base shear Vmax attained by the structure under uniform and triangular lateral load profile, the overstrength Ω, the available ductility μ and the behaviour factor q of the equivalent bilinear system, evaluated using the methodology described thoroughly elsewhere [18], the roof drift at failure δu, the target point demands δCSM and δN2 following [21, 23] and the controlling LC based on which δu has been estimated. For all frames the fundamental period is shown, and for the infilled frames, the compressive strength of the masonry infill walls fm is also shown.
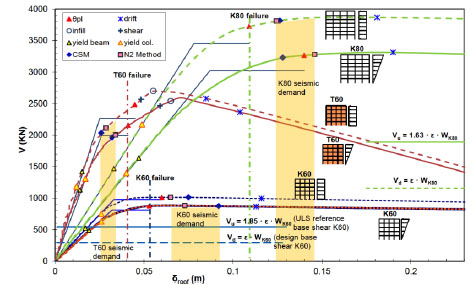
Inelastic pushover characteristics of buildings of the 60s and 80s, with and without infill walls.
Results from pushover analyses.
| Building | Force | fm [MPa] | T [sec] | Vmax [KN] | Ω | µ | q | δu [m] | δCSM [m] | δN2 [m] | Limit Criter. |
|---|---|---|---|---|---|---|---|---|---|---|---|
| K60 | uniform | - | 0.84 | 1012.4 | 1.86 | 1.85 | 2.57 | 0.06 | 0.075 | 0.065 | θpl |
| triang. | - | 876.6 | 1.61 | 1.63 | 2.03 | 0.053 | 0.092 | 0.073 | θpl | ||
| T60 | uniform | 2.5 | 0.44 | 2485.7 | 4.57 | 1.83 | 3.37 | 0.045 | 0.026 | 0.029 | θpl |
| triang. | 2.5 | 2159.3 | 3.97 | 1.63 | 2.87 | 0.041 | 0.032 | 0.034 | θpl | ||
| K80 | uniform | - | 1.38 | 3454.8 | 1.97 | 1.40 | 2.03 | 0.109 | 0.126 | 0.124 | θpl |
| triang. | - | 3265.9 | 1.73 | 1.61 | 2.21 | 0.140 | 0.128 | 0.146 | θpl |
Pushover curves with uniform load pattern have larger shear forces for the same displacement values. Similar results are shown by other researchers [48]. In Fig. (5) and Table. 2 it can be seen that building of the 80s (K80) exhibits better performance than the building of the 60s (K60). From pushover analysis with triangular lateral load pattern it can be seen that the building of the 80s has higher ovestrength and behaviour factor. The overstrength and the ductility of building K60 are 160% and 1.65, respectively. Building K80 has higher overstrength and ductility (173% and 1.61) from building K60, because the former structure is designed according to MOD84 [35], which introduced end member confinement and the requirement for a joint capacity criterion (less strict than the one applied in the present codes, EAK [49] and EC8 [24]), thereby increasing the structure’s lateral resistance.
The target displacement demands are higher than the maximum deformation capacity for the building of the 60s, while demand and capacity values are closer for the building of the 80s. It can be seen that the plastic rotation capacity criterion, which dominates in the building of the 60s improves in the 80s frame as a result of local detailing measures in introduced in 1984 (Fig. 5).
This behaviour changes when infill walls are taken into account (building T60) and the target displacement is higher than failure displacement. The critical limit state remains that of plastic hinge rotation capacity of columns. As expected, the presence of the infills causes a significant increase of the initial global stiffness and failure displacement is reduced by 25% for the infilled structure. The shear capacity of columns is exceeded earlier than in the bare frames due to frame-infill interaction. However, this failure is not critical in these analyses because plastic rotation capacity is exceeded first. Infills in the lower part of fully infilled frames do reach their maximum strength, at a drift which is close to, but higher than this limit. The ductility of the infilled structure is lower than that of the bare frame; however, its target deformation demand is lower as well. After failure of infills occurs, the lateral resistance of the structure approaches that of the bare frame.
In Fig. (6) shear capacity ratio values, calculated as described above, are shown for columns (values for beams are not shown for clarity) at failure deformation. Shear capacity ratio is satisfied for most of the beams and columns of the building of the 60s. Furthermore, for building of the 80s, characterised by longer bay sizes, for which however, the joint capacity check increases the overall column reinforcement, the shear capacity ratio is satisfied in both beams and columns (Fig. 6). This could indicate the reason why shear failure is not critical in most analyses.
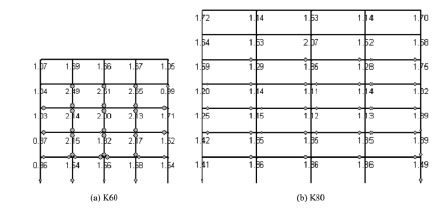
Shear capacity ratio of the columns.
In Fig. (7) the plastic hinge distribution of the buildings considered under uniform and inverted triangular profile of lateral forces is presented, at the point when the first collapse limit state criterion is exceeded. Both the exterior and the interior frames are shown. The values indicated at each joint correspond to the joint capacity ratios estimated at the same deformation. These ratios become less than one when the capacity check is no longer satisfied at the joint and the beams are stronger than the columns. In the same figure, the inelastic energy absorption at each floor, evaluated as the area under the bending moment - inelastic rotation curves of the hinged members and the area under the force - deformation curves of the equivalent infill struts are also shown, as a percentage of the total energy absorbed at the building during the same roof deformation.
In Fig. (7) it can be seen that in building K60 the joint capacity check is not satisfied (index smaller to 1.0 in most of the joints). On the contrary, for building K80 this check is satisfied in most joints, except for the top floor, where there is no requirement from the design code. The plastic hinge distribution observed at this point is in agreement with the joint capacity ratios. The exterior frames exhibit higher inelastic demands, since their columns are subject to lower axial load, compared to the interior frames. Furthermore, for building K60, relatively higher bottom reinforcement in the exterior beams results in high flexural resistance of these members, thereby concentrating all hinging primarily to the columns. The opposite holds true for the interior frames, whose beams are relatively weaker and, moreover, the columns have higher strength reserve as they bear higher axial loads than their exterior counterparts.
Regarding the energy distribution it can be seen that for the building of the 60s designed according to past generation of Codes, a significant amount of energy is absorbed by the columns. It is also shown that the inelastic energy absorption in the case of the triangular load profile results into a shift and concentration of damage towards the middle third of the building. On the other hand, building K80, designed with a simple form of joint capacity design, exhibits a concentration of its plastic hinges mainly in the beams and absorbs the energy mainly in the beams. A weak beam - strong column behaviour is observed, while the inelastic energy absorption is concentrated to the beams and it is better distributed along the height of the structure, as shown in Fig. (7). All the inelastic energy absorbed by the columns concentrates at the base of the columns of the first storey.
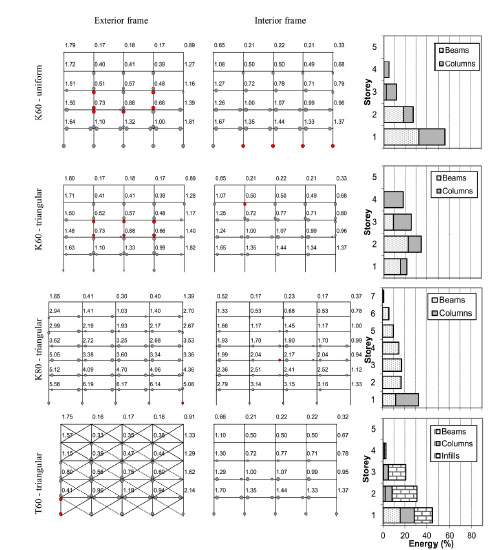
Distribution of plastic hinges and local inelastic energy absorption with height (%) for pushover analysis. Values at joints indicate the joint capacity ratios (Σ MRC / Σ MRb). Infills plotted in “dashed” line when cracked.
In case of the fully infilled frame (T60) energy is mainly absorbed by the infills, while columns in first floor still absorb a significant portion. Plastic hinges are observed mainly at lower stories. Infills cracked are plotted with a dashed line.
5.2. Incremental Dynamic Analysis Results
Pushover results are subsequently compared with nonlinear dynamic analysis. In particular, Incremental Dynamic Analysis is performed using 15 strong motion records for a more realistic evaluation of the expected range of performance. For each IDA 25 nonlinear dynamic analyses were performed for different seismic intensities and a total of more than 1000 nonlinear dynamic analyses were finally carried out for all buildings and records. For consistency with the design assumptions, each record is also scaled according to the Velocity Spectrum Intensity (VSI) [50] to the zone I design spectrum in the Greek Design Code [49] (similar to the EC8 [24] design spectrum) which has a pga of 0.16g. The VSI is evaluated by Eq. (2)
 |
(2) |
where Sv is the spectral velocity, ξ is the dampingand T is the period.
In each IDA curve, four points are marked. These are (i) the point where yield happens to a member for the 1st time (Yield), (ii) the point where failure happens to a member for the 1st time (Failure), (iii) the point for dynamic analysis with the natural record (Unscaled) and (iv) the point for dynamic analysis with the record scaled to design spectrum, as mentioned above. The last point is compared with the target displacement using nonlinear static methods in order to evaluate these methods with nonlinear dynamic analysis whose results are considered more accurate.
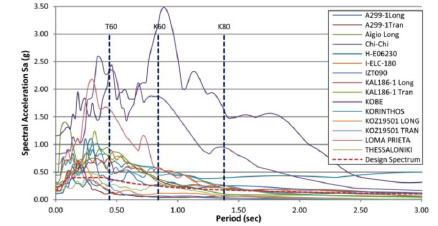
Elastic response spectra of the records.
Ground motion characteristics of the records used.
| Record | Place | Date | pga [g] | pgv [cm/sec] | VSI [cm/sec] | Arias Intensity AI [cm/sec] | Significant Duration 3% -97% AI [sec] |
|---|---|---|---|---|---|---|---|
| A299-1Long | Athens | 1999 | 0.110 | 5.105 | 18.358 | 8.584 | 10.175 |
| A299-1Tran | Athens | 1999 | 0.159 | 7.084 | 21.122 | 14.532 | 8.39 |
| Aigio Long | Aigio | 1995 | 0.490 | 40.237 | 113.683 | 97.169 | 4.38 |
| Chi-Chi | Taiwan | 1999 | 1.157 | 115.735 | 717.045 | 2030.656 | 18.065 |
| H-E06230 | Imperial Valley | 1979 | 0.439 | 109.820 | 178.680 | 175.40 | 11.225 |
| I-ELC-180 | Imperial Valley | 1940 | 0.313 | 29.690 | 132.917 | 170.396 | 24.60 |
| IZT090 | Kocaeli | 1999 | 0.220 | 29.777 | 112.260 | 81.309 | 16.595 |
| KAL186-1 Long | Kalamata | 1986 | 0.234 | 30.902 | 106.918 | 54.17 | 6.125 |
| KAL186-1 Tran | Kalamata | 1986 | 0.269 | 24.756 | 102.264 | 72.56 | 7.51 |
| KOBE | Kobe | 1995 | 0.821 | 81.362 | 417.362 | 839.008 | 10.78 |
| KORINTHOS | Korinthos | 1981 | 0.289 | 23.482 | 123.619 | 85.347 | 16.39 |
| KOZ19501 LONG | Kozani | 1995 | 0.216 | 9.241 | 38.795 | 26.412 | 7.975 |
| KOZ19501 TRAN | Kozani | 1995 | 0.140 | 6.585 | 24.679 | 19.595 | 10.65 |
| LOMA PRIETA | Loma Prieta | 1989 | 0.644 | 55.148 | 179.638 | 323.749 | 10.18 |
| THESSALONIKI | Thessaloniki | 1978 | 0.141 | 11.388 | 51.840 | 17.230 | 8.73 |
The elastic response spectra of the records used, along with the Elastic Design Response Spectrum currently enforced by EAK 2000 [49] for zone I are shown in Fig. (8). The period of the three buildings examined is pointed out. The recorded pga, the peak ground velocity (pgv), the Velocity Spectrum Intensity (VSI), the Arias Intensity and the significant duration of the ground excitation (considered to be the time bounded by the 3% and 97% limits of the Arias Intensity) of the unscaled records are shown in Table 3.
The maximum predicted total displacement during each nonlinear time history analysis is plotted against the spectral acceleration in Fig. (9) for bare frame of the 60s. Likewise, IDA response between different excitations is compared in the same figure for the fully infilled frame of the 60s (T60) and the bare frame of the 80s (K80). In these plots, the mean IDA curves of all the records are shown too.
Conventional collapse is checked using the same set of LC for each record. The global IDA results are shown in Table 4 and plotted in Fig. (10) for each record together with the pushover predictions. Average, maximum and minimum predictions for q and ductility capacity (qmin, μmin,
 ), together with the minimum predicted roof displacement at collapse from IDA are compared to the pushover results. Critical limit state is also presented in Table 4.
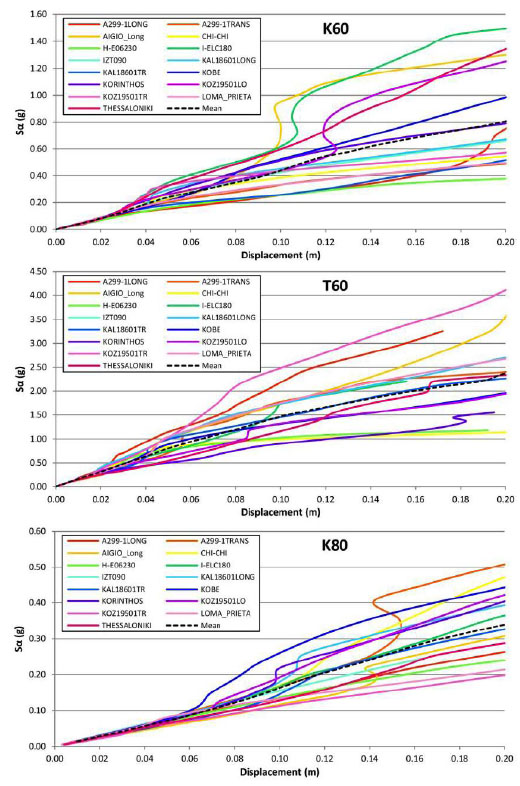
IDA curves for bare frame of the 60s (K60), fully infilled frame (T60) and bare frame of the 80s (K80).
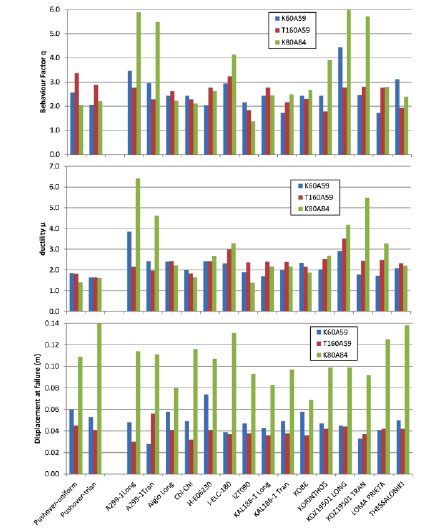
Behaviour factor, ductility and displacement at failure evaluated from Pushover and IDA analyses.
From Table 4 and Fig. (10) it can be seen that the q factor, ductility capacity and roof displacement at failure predicted by the dynamic analyses exhibit a wide variability around the mean values. In general, mean values for the behaviour factor and ductility capacity evaluated with IDAs are higher compared to the values evaluated with pushover analysis, with an exception of the mean behaviour factor of the infilled frame of the 60s. However, the values evaluated from pushover analysis are included between the minimum and maximum values from IDAs. On the other hand, failure displacement values evaluated with the two methods are in good agreement. Behaviour factor and ductility capacity are larger for building K80, as expected. Failure displacement is also larger than building K60. Failure displacement of infilled frame T60 is smaller than the one of bare frame K60. On the other hand, behaviour factor and ductility capacity is smaller or larger, depending on the record.
Critical limit state for IDAs in most cases is that of plastic hinge rotation capacity of columns, the same with pushover analyses, with an exception for three cases were shear failure was critical, like the bare frame of the 60s (K60) under A299-1Tran record. However it should be noted that in some cases critical limit state may differ according to the seismic intensity of a record for the same building, while in other remains the same. In Fig. (11) IDA curve is plotted for K60 building for the KOZ19501TRAN record. Each point represents the maximum results from dynamic analysis with a record with different intensity. Different marks at each point show the different critical limit state at each intensity. At the 3rd point 1st yield occurs at a member. At the 6th point, 1st failure occurs. Plastic hinge rotation capacity is the critical limit state. The same limit state is critical up to intensity of Sa = 0.305g. At the next analysis, shear capacity is the critical limit state, up to intensity of 0.52g. Critical limit state switches to plastic hinge rotation capacity up to intensity of 0.78g and then back to shear, up to maximum intensity of 1.0g.
Behaviour factor, ductility and displacement at failure evaluated from Pushover and IDA analyses. Mean, minimum and maximum values from all the records.
| K60 (T = 0.84 sec) | T60 (T = 0.44 sec) | K80 (T = 1.38 sec) | ||||||||||
|---|---|---|---|---|---|---|---|---|---|---|---|---|
| q | µ | δfailure (m) |
LC | q | µ | δfailure (m) |
LC | q | µ | δfailure (m) |
LC | |
| Pushover-uniform | 2.57 | 1.85 | 0.060 | θpl | 3.37 | 1.83 | 0.045 | θpl | 2.03 | 1.40 | 0.109 | θpl |
| Pushover-triang | 2.03 | 1.63 | 0.053 | θpl | 2.87 | 1.63 | 0.041 | θpl | 2.21 | 1.61 | 0.140 | θpl |
| Record | ||||||||||||
| A299-1Long | 3.467 | 3.848 | 0.048 | θpl | 2.765 | 2.158 | 0.030 | θpl | 5.881 | 6.417 | 0.114 | θpl |
| A299-1Tran | 2.951 | 2.431 | 0.028 | V | 2.275 | 1.975 | 0.056 | V | 5.474 | 4.622 | 0.111 | θpl |
| Aigio Long | 2.429 | 2.407 | 0.058 | θpl | 2.622 | 2.438 | 0.041 | θpl | 2.223 | 2.226 | 0.08 | θpl |
| Chi-Chi | 2.429 | 2.004 | 0.049 | θpl | 2.275 | 1.837 | 0.032 | θpl | 2.108 | 1.632 | 0.116 | θpl |
| H-E06230 | 2.021 | 2.427 | 0.074 | θpl | 2.765 | 2.427 | 0.041 | θpl | 2.625 | 2.684 | 0.107 | θpl |
| I-ELC-180 | 2.936 | 2.309 | 0.039 | θpl | 3.238 | 2.980 | 0.037 | θpl | 4.136 | 3.290 | 0.131 | θpl |
| IZT090 | 2.164 | 1.892 | 0.047 | θpl | 1.847 | 2.359 | 0.038 | θpl | 1.377 | 1.390 | 0.093 | θpl |
| KAL186-1 Long | 2.429 | 1.698 | 0.043 | θpl | 2.765 | 2.398 | 0.036 | θpl | 2.439 | 2.173 | 0.083 | θpl |
| KAL186-1 Tran | 1.714 | 1.988 | 0.049 | θpl | 2.166 | 2.383 | 0.038 | θpl | 2.483 | 2.175 | 0.097 | θpl |
| KOBE | 2.429 | 2.345 | 0.058 | θpl | 2.301 | 2.166 | 0.036 | θpl | 2.666 | 1.879 | 0.069 | θpl |
| KORINTHOS | 2.429 | 2.032 | 0.047 | θpl | 1.784 | 2.516 | 0.042 | θpl | 3.898 | 2.695 | 0.099 | θpl |
| KOZ19501 LONG | 4.423 | 2.915 | 0.045 | θpl | 2.774 | 3.509 | 0.044 | V | 5.999 | 4.180 | 0.099 | θpl |
| KOZ19501 TRAN | 2.447 | 1.791 | 0.033 | θpl | 2.808 | 2.454 | 0.037 | θpl | 5.722 | 5.489 | 0.092 | θpl |
| LOMA PRIETA | 1.714 | 1.720 | 0.041 | θpl | 2.765 | 2.479 | 0.042 | θpl | 2.799 | 3.278 | 0.125 | θpl |
| THESSALONIKI | 3.114 | 2.089 | 0.050 | θpl | 1.926 | 2.322 | 0.042 | θpl | 2.400 | 2.207 | 0.138 | θpl |
| Mean value | 2.606 | 2.260 | 0.047 | 2.472 | 2.427 | 0.039 | 3.482 | 3.089 | 0.104 | |||
| Minimum value | 1.714 | 1.698 | 0.028 | 1.784 | 1.837 | 0.030 | 1.377 | 1.390 | 0.069 | |||
| Maximum value | 4.423 | 3.848 | 0.074 | 3.238 | 3.509 | 0.056 | 5.999 | 6.417 | 0.138 | |||
For every record, time histories for displacement, interstorey drift and shear forces at each storey are evaluated. Profiles of these are also presented at every step of the analysis. In Fig. (12) time histories for top displacement, interstorey drift of the 3rd storey and base shear are presented for building K60 for the 1986 Kalamata earthquake (KAL186-1Long). Profiles of these values are presented in the same figure at time of maximum displacement and maximum base shear. It can be seen that for this record, interstorey drift is maximum at the 4th storey.
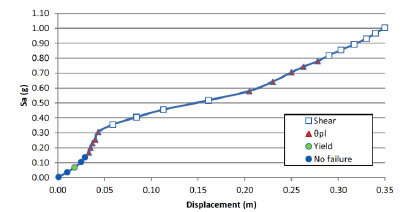
IDA curve for K60 under KOZ19501TRAN record.Critical limit state for each nonlinear dynamic analysis with different seismic intensity.
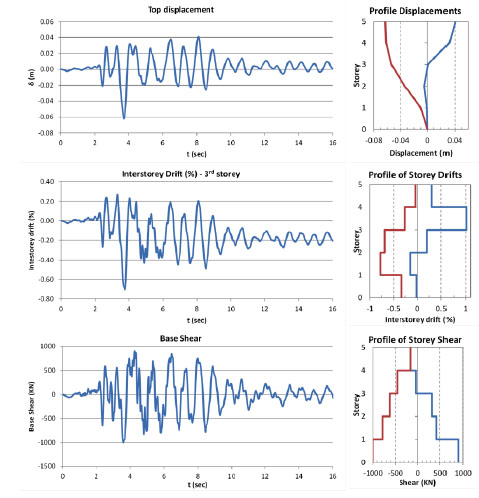
Time-histories and profiles for the KAL186-1Long record (K60 building).
In Fig. (13) profiles of storey displacements, interstorey drifts and shear forces are presented for all the methods. Mean values from nonlinear dynamic analysis are compared with the values from pushover analysis at target displacement using CSM and N2 method. Nonlinear dynamic analyses were performed with the records scaled to the design spectrum. Results are plotted for the three examined structures. It can be seen that nonlinear static methods seems to overestimate the displacements, intestorey drifts and shear forces. There are differences among the two static evaluation techniques in the distribution of storey displacements and interstorey drifts, while their results are almost similar for the distribution of shear forces. The results of N2 method seem to be more close to the nonlinear dynamic analysis but with significant differences.
In Fig. (14) the plastic hinge distribution is shown for dynamic analysis of building K60 for the unscaled KAL186-1Long record. Results are shown for two different steps of the analysis, the step at maximum interstorey drift and the final step of analysis. In the same figure ductility rotation demands are shown near each plastic hinge. Furthermore, energy absorption for beams and columns along the height of the building is plotted near the frames. At step of maximum drift, energy absorption is maximum at the 4th storey, where interstorey drift is also maximum. On the contrary, on the final step energy absorption is maximum at the 3rd storey. Values of ductility rotation demands are larger in the 4th storey at the step of maximum drift. From the plastic hinge distribution it can be seen that a soft storey mechanism is created in the 3rd and 4th storey and energy is mainly absorbed by the columns of these two storeys similar to the results obtained from pushover analysis. Plastic hinges in beams are more at interior beam, since capacity design check is satisfied at exterior beams.
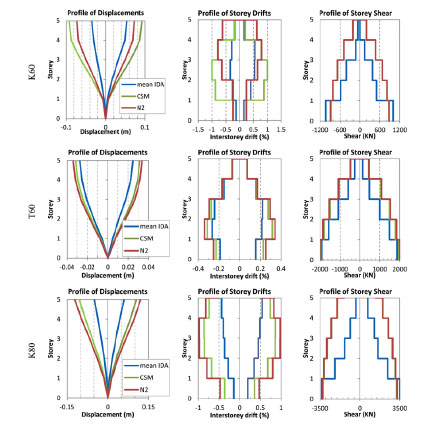
Profiles of storey displacements, interstorey drifts and shear forces for pushover and IDA.
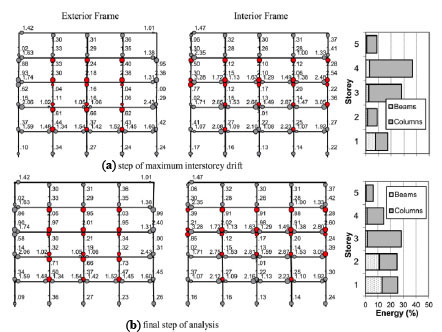
Plastic hinge distribution, ductility rotation demands and energy absorption for (a) the step at maximum drift and (b) for the final step of analysis. K60 building and KAL186-1Long record. Red are plotted the failed plastic hinges.
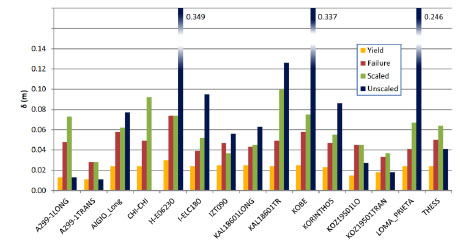
Displacement of the K60 building from IDA analysis for 15 records. Values for yield, failure, the record scaled to the design spectrum and the unscaled record.
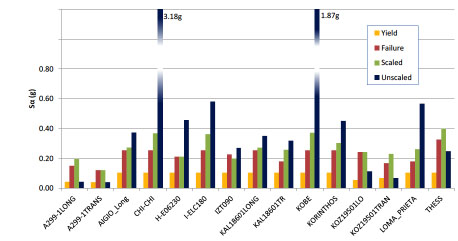
Sa of the K60 building from IDA analysis for 15 records. Values for yield, failure, the record scaled to the design spectrum and the unscaled record.
In Fig. (15) displacements of K60 building subjected to 15 records are presented. Displacements correspond to 4 levels of intensity for each record. The values represent (i) the displacement from dynamic analysis with the record under minimum intensity that causes 1st yield to any member of the structure, (ii) the displacement from analysis that causes 1st failure, (iii) the displacement with the record scaled to design spectrum and (iv) the displacement with the natural (unscaled) record. Similar results are plotted for spectral acceleration Sa for these 4 different cases (Fig. 16).
For K60 building, in all IDAs, the maximum displacement with the minimum record that causes failure is smaller than the maximum displacement obtained from dynamic analysis with the scaled record (Fig. 15). Similarly, spectral acceleration at failure is smaller than Sa for the scaled record (Fig. 16). This indicates that K60 fails for all dynamic analyses with the scaled records. However, if the frame is fully infilled (T60) failure displacement is larger, in most cases, than displacement of dynamic analysis with the scaled record, indicating a better seismic behaviour of the structure (Fig. 17). Infilled frame T60 does not fail when subjected to records scaled to design spectrum in most of the cases. Furthermore, building of the 80s (K80) shows a better behaviour compared to building of the 60s (K60) since it doesn’t fail for every scaled record and when it fails it is with a smaller margin (Fig. 18). Mean value for deformation capacity for this building is larger than the mean deformation demand of the scaled record, as also shown in Fig. (19).
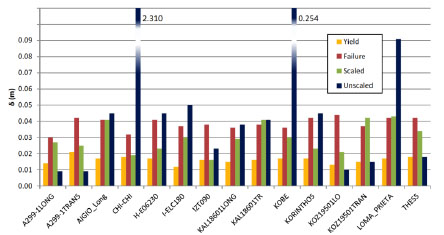
Displacement of the T60 building from IDA analysis for 15 records. Values for yield, failure, the record scaled to the design spectrum and the unscaled record.
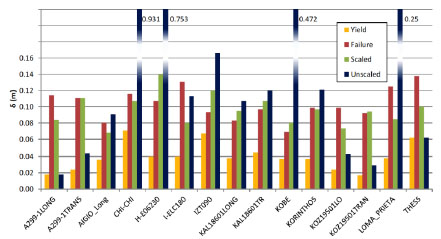
Displacement of the K80 building from IDA analysis for 15 records. Values for yield, failure, the record scaled to the design spectrum and the unscaled record.
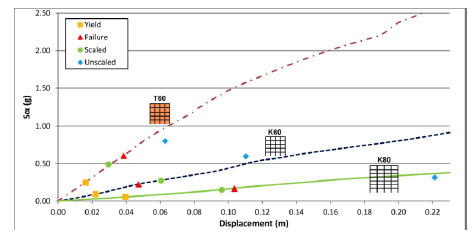
Mean IDA curves for frames K60, T60 and K80.
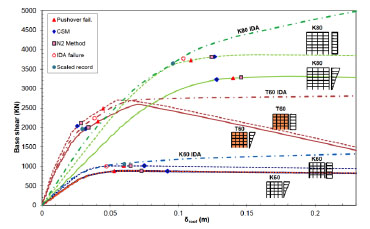
Pushover prediction compared with mean IDA prediction.
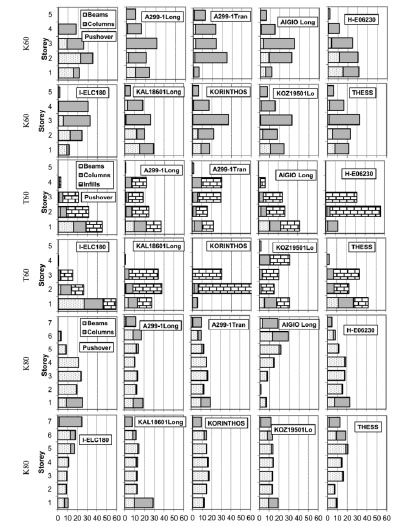
Local energy absorption over total energy with height (%) for pushover analysis and nonlinear dynamic analysis with the records scaled to design spectrum.
In Fig. (19) the mean IDA curves of all the records are compared for the three buildings. In the same figure, the mean points from dynamic analysis of record at yield, failure, record scaled to design spectrum and unscaled record are also shown. Spectral accelerations for building K80 are smaller, since spectral amplification is smaller for its fundamental period. On the contrary, base shear is larger. Maximum deformation capacity of K80 is significantly larger than the one of building K60.
In Fig. (20) pushover predictions are compared to IDA predictions. Mean IDA curves in terms of maximum base shear vs maximum roof deformation are shown in Fig. (20), with indication of the mean level at failure and excitation with the scaled record. Similarly, in pushover curves, target and failure displacements are also depicted.
The target displacement for K60 varies from 6.5 to 9.2 cm, evaluated from pushover analysis with uniform or triangular distribution of lateral loads, evaluated with CSM and N2 method. Displacement from nonlinear dynamic analyses using records scaled to the design spectrum varies from 2.8 cm to 10 cm (Figs. 15, 20), with a mean value of 6.0 cm. It seems that for this building, nonlinear static methods overestimate the target displacement compared to mean value from IDA. However, target displacements are within the extreme values obtained from dynamic analyses. Similar conclusions are made for buildings T60 and K80. The target displacement for T60 varies from 2.6 to 3.4 cm, while displacement from dynamic analyses varies from 1.6 to 4.3 with a mean value of 3.0 cm (Figs. 17, 20). Finally, target displacement of K80 varies from 12.4 to 14.6 cm, while displacement from dynamic analyses varies from 6.8 to 14.0 with a mean value of 9.6 cm (Figs. 18, 20).
In Fig. (21) the inelastic energy absorption at each floor is evaluated as a percentage of the total energy absorbed at the building during the same roof deformation. A comparison is made between the energy absorbed from pushover analysis and from nonlinear dynamic analysis with records scaled to the design spectrum. Similar to the conclusions from pushover analysis, a significant amount of energy is absorbed by the columns for building of the 60s. On the other hand, building of the 80s (K80), designed with a simple form of joint capacity design, absorbs the energy mainly in the beams and energy absorption is better distributed along the height of the structure. In case of the fully infilled frame of the 60s (T60) energy is mainly absorbed by the infills, while columns still absorb a significant portion. In case of the I-ELC180 record, the amount of energy absorption is larger for the beams and columns of the 1st storey than the infills of the structure.
CONCLUSION
The assessment of the seismic behaviour of two existing RC buildings of the 60s and 80s, bare and fully infilled, is presented in this study, based on more than 1000 static and time history analyses. The conclusions derived from this study can be summarized as follows:
Both static pushover and incremental dynamic analyses show that building of the 60s (K60) presents deficiencies. Pushover analysis shows that failure of this structure occurs in target displacement. The structure also fails when subjected to all records scaled to design spectrum, therefore, this structure exhibits inadequate seismic performance.
On the other hand, bare building of the 80s (K80) exhibits a better behaviour than the bare building of the 60s having a higher overstrength and ductility, since it is designed according to the 1984 Interim Modification Provisions [35] which introduced critical region ductility provisions and a joint capacity design. Thanks to these code requirements, this building possesses higher deformability and strength therefore its performance point demand is close to its provided deformation capacity. Similar results are provided by IDA, showing that K80 does not fail for most of the nonlinear dynamic analyses with records scaled to the design spectrum.
Perimeter infill walls, when considered, influence the behaviour of the structure. Fully infilled frame of the 60s exhibits a significantly better performance than the bare frame. Infills increase both stiffness and overstrength of the structure, but reduce its global ductility. Check of limit criteria at target displacement shows that infilled structure does not fail. Moreover, when subjected to records scaled to the design spectrum, the structure does not fail for most of the cases.
IDA results show a large dispersion but mean values are in reasonable agreement with pushover predictions. Target displacement is in good agreement with the mean displacement evaluated with nonlinear time history analyses with records scaled to the design spectrum.
Nevertheless, the different predictions from nonlinear dynamic analyses with different records are not possible to be obtained using static methods only. IDA analyses are therefore an essential tool for the vulnerability assessment of existing structures. Mean IDA curves are also in agreement with the pushover curves.
CONFLICT OF INTEREST
The author confirms that this article content has no conflict of interest.
ACKNOWLEDGEMENTs
Declared none.


