All published articles of this journal are available on ScienceDirect.

Eigen-6c4 Gravity and Alos Palsar Radar Data Integration for Delineating Geological Lineaments in North Ghadames Basin, NW Libya
Authors Info & Affiliations
Abstract
Introduction
The ambiguity regarding the geological interpretation has the potential to be significantly decreased with the use of remote sensing, geophysical data, and the history of geology.
Aims
The objective of this work is to delineate geological lineaments and faults using EIGEN-6C4 satellite gravity and ALOS PALSAR radar data in the north Ghadames Basin, of northwest Libya.
Methods
The satellite gravity dataset of the study region was used to perform a complete Bouguer anomaly map of the study area to start the gravity interpretation. Then different filters were performed on the gravity dataset, such as the total horizontal gradient (THG), CET grid analysis, 3-dimensional Euler solution (ED), and a tilt derivative (TDR) using the commercial Oasis Montaj programme. The techniques of edge identification (THG, TDR, and also CET grid analysis) are utilised for locating and identifying the boundaries or edges of geological structures that contribute to gravity anomalies. The 3-dimensional Euler solution, in conjunction with the TDR method, is employed to precisely figure out the positions and estimated depths associated with subsurface sources. Radiometric calibration, speckle filtering, and geometric correction were applied to preprocess the ALOS PALSAR L 1.1 image via the Sentinel Application Platform (SNAP) software. For automatic extraction, the PCI Geomatica software's LINE module was applied.
Results
The gravity data results indicate that the main trends of the identified geological lineaments are oriented in the North-South, East-West, Northwest-Southeast, and North-Northwest to South-Southeast directions. Furthermore, the depths of the sources observed underneath the study region differ from 250 m to 2750 m. The orientation of extracted lineaments from the ALOS PALSAR L1.1 images, specifically the horizontal-horizontal as well as horizontal-vertical polarisation images, predominantly have orientations in the north-south, north-northeast to south-southwest, east-west, north-northwest to south-southeast, and northeast-southwest directions within the study area.
Conclusion
All these findings of lineaments are associated with the tectonic features of the area. Consequently, identifying these lineaments/faults is important to reduce the ambiguity of geological interpretation and provide more information on the dominant trends for future exploration activities in the study region.
1. INTRODUCTION
Geophysical implements are widely used in various fields such as engineering, ecology, archaeology, hydro- geology, tectonics, mineral deposits, and hydrocarbon exploration. Investigations of geological lineaments can be conducted more efficiently by combining various data analyses and procedures [1, 2]. According to research [3], the Ghadames Basin is yet to reach full maturity associated with hydrocarbon detection. The combination of remote sensing information and potential field datasets, such as gravity data, provides for the characterization of previously unexplored regions and enhances the scientific understanding of the research area [4, 5]. This integration can make the identification of geological structures in the northwest region of Libya that define the buildup of hydrocarbons easier [6]. The location of the study area (Fig. 1) is in the northwest of Libya and lies between 11.300 to 12.000 East and 31.300 to 31.500 North. The sedimentary section of the Ghadames Basin encompasses a wide range of geological times, extending from the Paleozoic to the Cenozoic era. Several geologists have conducted numerous geological investigations in the Ghadames Basin [3, 7-9]. Numerous geoscientific datasets are available in the study region, but they are not published in scientific journals and are interpreted structurally [10]. No exhaustive investigation of all available data has been conducted to analyse the region's structure. Geological lineaments are significant to understand the history of the development within the studied region and its surroundings, which are essential to further hydrocarbon exploration. This study attempts to delineate geological lineaments/faults using EIGEN-6C4 satellite gravity and radar remote sensing data. Numerous scientists have applied satellite gravity data, e.g [11-14]. Trung et al. [14] used gravity datasets to delineate the main tectonic elements within the South China Sea. Similarly, Tedla et al. [13] created a map of Africa's crustal thickness using data from a global gravity model. Moreover, Narayan et al. [11] and Pal et al. [12] utilised EIGEN6C4 and other global combined gravity field models to perform structural mapping across the 850E Ridge and its surroundings [15]. Remote sensing applications are an efficient and modern method for imagery data collection. It has proven its effectiveness in various fields, including mineralogical and lithological mapping and mapping geological lineaments. Consequently, on the other hand, it also significantly reduces the time and cost required for fieldwork [16]. Furthermore, using a digital elevation model, the investigation and interpretation of geological lineaments are easily recognisable [10]. The ALOS PALSAR L1.1 radar image data, can be processed and analyzed to extract surface geological lineaments by utilizing the horizontal-horizontal (HH) and the horizontal-vertical (HV) polarizations. These polarisations provide different information about the scattering properties of the Earth's surface, which can be used to identify geological features and lineaments. In this study, the LINE module, a feature extraction tool within the PCI Geomatica software suite, is utilised to extract surface geological lineaments from ALOS PALSAR L1.1 radar images [17, 18]. Several researchers have previously demonstrated both the performance and lineament extraction abilities of the LINE Module [19-21].
1.1. Geological Setting
The study region is a part of Jabal Nafusah and a structurally significant intracratonic depression known as the Ghadames Basin, located northwest of Libya. The eastern boundary of the area is defined by longitudes 11.30° to 12.00° E, while the northern boundary is defined by latitudes 31.30° to 31.50° N. The elevation range in the study area is approximately 408 meters to 712 meters above sea level. The Ghadames Basin is indeed a major sedimentary basin in North Africa, covering an extensive area of approximately 212,000 km2. It spans across parts of Algeria, Tunisia, and Libya. The Nafusah Uplift forms the northern boundary of the Ghadames Basin. The Tihemboka and Gargaf Arches are structural features that form part of the southern boundary of the basin. In addition, the Hoggar Shield, also known as the Ahaggar Mountains, forms another part of the southern border of the Ghadames Basin, whereas the Sirte Basin forms part of the eastern boundary. The Sirte Basin and the Ghadames Basin share a common boundary where their respective sedimentary deposits meet. Jabal Nafusah experienced an uplift during the period of Hercynian orogenesis, which then subsided. During the early Mesozoic era, the northern part of the Ghadames Basin underwent rifting processes. This tectonic activity caused the partial reactivation of the previously subsided areas in the northern part of the basin by Burollet [22]. The Nafusah Arc is a prominent (east-west) trending tectonic structure that separates the Ghadames Basin from the Jifara Basin in the north [23]. The Ghadames Basin evaluation was initiated with the Pan-African orogeny that occurred during the Neoproterozoic era and was subsequently reactivated during the subsidence of the Paleozoic basin [24]. Northwest African basins formed due to a series of uplifts throughout the Phanerozoic era that intersected with each other diagonally, according to a study [25, 26]. Moreover, he proposed that the beginning of the Caledonian tectonic period rejuvenated a hitherto feeble suture zone of Pan-African origin. Consequentially, it suggests this is the source of the prevailing notion that raising is an essential part of the mostly east-west-oriented “Nafusah arch.”. According to a study [27], neotectonic activity frequently impacts large continental landmasses of recent origin. This phenomenon typically occurs due to mantle activities that result in uplift through the rise of plumes associated with hot spots [28]. According to Lipparini [29], northwest-southeast displace- ment was connected to the uplift. As stated by Mann [30], the structural evolution of the Jabal Nafusah ceased in the late Cretaceous. In general, the Ghadames Basin sedimentary deposits span a wide range of geologic time, extending from the Paleozoic to the Cenozoic era. The sedimentary rocks within the study area range in age from the Middle Jurassic period towards the Quaternary and are composed of clastic with carbonates (sand, limestone, clay minerals, followed by marl).
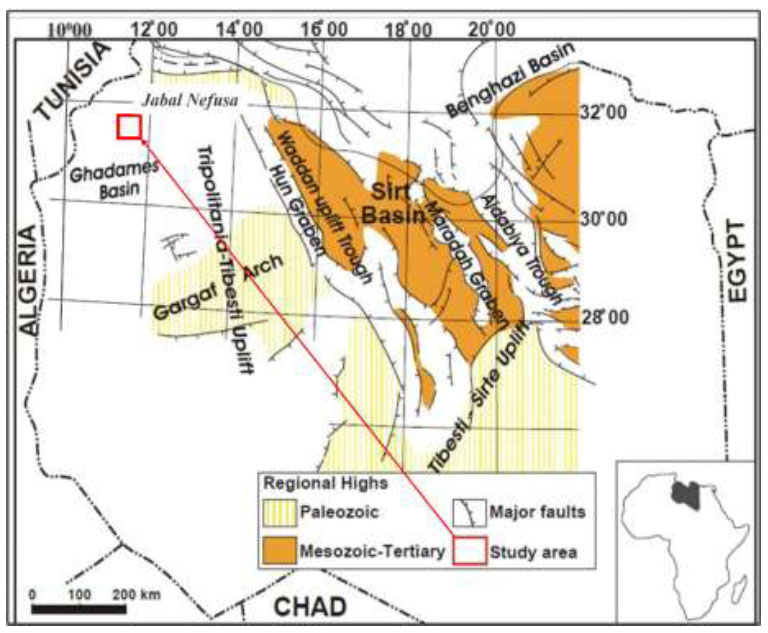
Location map of the study area (red rectangular) and simplified geological map of northwest Libya showing the distribution of rock units modified after [3].
2. MATERIALS AND METHODS
2.1. Gravity Data
The gravity dataset is commonly utilised to identify structures beneath the surface by using variations in the density distribution of subsurface materials that cause corresponding variations in the gravitational field above the Earth's surface. The EIGEN-6C4 satellite gravity dataset for the north Ghadames Basin area was obtained from the International Centre for Global Earth Modelling (ICGEM) website. Satellite gravity data analysis is one of the exploration methods that can be used to outline the subsurface structures in this study [13, 31] another study reported that EIGEN-6C4 satellite gravity datasets are particularly appropriate for studying long wavelength characteristics that could be lost via ground gravity measurement, and they provide global coverage that is unaffected by the terrain's roughness and inaccessibility [15]. Kurniawan [32], highlighted that this method has advanced in recent years. Satellite gravity interpretation has several applications in primary investigation research due to its inexpensive cost and its ability to study geological conditions in remote and/or extended areas [33]. The gravity dataset is made up of 1734 gravity data points and a grid with an interval of 0.010 x 0.010.
2.2. Gravity Data Processing
Originally, the satellite gravity dataset was referred to as the free air anomaly (FAA). Thus, to correct the gravity datasets and remove the rock mass effect between the observation point and the geoid, a process called “Bouguer correction” is commonly applied to get the complete Bouguer anomaly (CBA). The result of performing all appropriate corrections on the gravity dataset is the Bouguer gravity anomaly. Furthermore, gravity data were gridded using minimal curvature random gridding to produce the CBA grid (Fig. 2). The Bouguer anomaly in gravity data, however, includes various anomalies with a wide range of amplitudes. All of the anomalies are nevertheless related to variations in the rock's density beneath the surface. Analysis of gravity data involves employing standard reduction procedures. The EIGEN-6C4 gravity data were analysed utilising the THG, TDR, CET, and Euler solution techniques. In Fig. (2), a simplified flowchart of the methodology is shown.
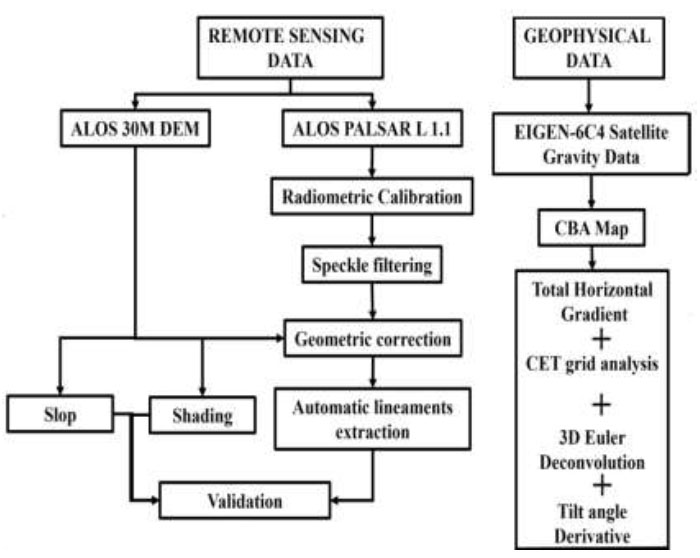
The methodology flowchart.
2.2.1. Total Horizontal Gradient (THG)
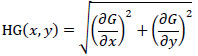
The THG Eq. (1) delineates the limits of gravity anomalies through the use of upright contacts. The application of the horizontal gradient is anticipated to discern the geological contacts in the research region. The THG technique, first proposed by Cordell [34], can be employed to identify variations in density that correspond to contacts via gravity datasets. The maximum peak value of the THG of the Bouguer anomaly is observed over the centre or near the centre of the source body rather than directly over the edge. When it is directly above the centre of a source body, there is a significant change in the gravitational field, leading to a peak in the total horizontal gradient.
 |
(1) |
When G is the gravity anomaly, the magnitude of the horizontal gradient is denoted by HG(x,y), and it is determined by the partial derivatives (∂G/∂x and ∂G/∂y) of G along both axes.
2.2.2. CET Grid Analysis
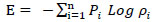
The CET Grid Processing Extension demonstrates Curtin University's Centre regarding Exploration Targeting's (CET) focus on improving gravity data processing capabilities. CET stands for a collection of complex mathematical algorithms employed to analyse and interpret data related to gravity. The algorithms involved are designed to execute multiple purposes, such as locating, improving, and converting gravity dataset discontinuities into vectors. Discontinuities, such as geological structures, can have a significant effect on the behaviour and distribution of gravity anomalies [35]. developed algorithms that combine symmetrical feature detection and textural analysis to identify discontinuities in gravity data using a CET grid. Within the CET processing, the number of filters and the smallest filter wavelength were set to 3, whereas the value used for congruence strength was specified as 5. An equation for CET grid analyses can be expressed as:
 |
(2) |
Where the histogram of n bins has been normalised to produce the probability ρ.
2.2.3. Tilt Derivative (TDR)
The TDR, commonly known as the tilt angle method, is the technique utilised to sharpen and enhance gravity anomalies. It develops on the analytic signal (AS) approach proposed by Miller and Singh [36] and Verduzco et al. [37]. Additionally, to calculate the field's tilt angle, it uses the anomaly's second vertical derivative. Once the tilt angle has been determined, the location of the anomaly's source can be estimated. It is assumed that the sources have roughly two-dimensional structures for this strategy to work. The total derivative (TDR) Eq. (5) can be employed to differentiate between vertical and horizontal gravity anomalies by comparing their derivatives [38]. A positive TDR value signifies an effective contrast with the causative source, while a negative value suggests that the observed value falls outside the impact of the source.
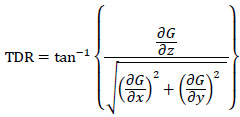 |
(3) |
Where the observed gravity field G is at a given location (x, y). (∂G/∂x), (∂G/∂y) and (∂G/∂z) signify the horizontal and vertical derivatives of G, respectively.
2.2.4. Euler Solution
Euler deconvolution techniques provide estimations of the depth and locations of several gravity sources that are homogeneous in nature. The structural index represents a variable with exponential properties that provides an explanation of the characteristics of the geological bodies, as depicted in Table 1. This method is especially advantageous for interpreting data on gravity since it requires little basic comprehension of the nature of the source body [39, 40]. The expression for Euler deconvo- lution in three dimensions is expressed as follows:
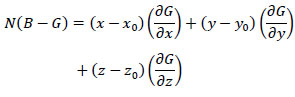 |
(4) |
| Source | G with SI value |
|---|---|
| Sphere | 2 |
| Horizontal | 1 |
| Fault | 0 |
Where G describes the gravity field generated by causative bodies at a specific location (x, y, and z) in terms of the coordinates of the source site (x 0, y 0, z 0), the field's baseline level (B), and the degree of homogeneity or structural index (N).
2.3. Alos Palsar Radar Data
In this study, the ALOS PALSAR L 1.1 data was acquired from the ASF Distributed Active Archive Centre. The ALOS PALSAR sensor was designed to capture radar imagery of the Earth's surface, providing valuable data for various applications, including geological studies, land cover classification, and agriculture monitoring. This study utilised a single ascending L1.1 PALSAR image acquired on September 29, 2007. The image was captured in a specific beam mode known as dual polarisation. In this mode, the radar sensor simultaneously transmits and receives signals in two different polarisations, allowing for more comprehensive and detailed data collection. The two polarisations used in this study are HH polarisation, which stands for horizontal transmit and horizontal receive, while HV polarisation represents horizontal transmit and vertical receive. Furthermore, the PALSAR image was taken at an off-nadir angle of 34.30. PALSAR L1.1 data is in SLC slant range format, and it is complex data, also known as SLC data. It is compressed in both range and azimuth directions [42].
2.4. Alos Radar Data Analysis
The Alos Palsar L1.1 data were preprocessed using the sentinel application platform (SNAP) software. The European Space Agency (ESA) has indeed been involved in the development of algorithms for Phase Unwrapping within the SNAP software. The Phase Unwrapping algorithm is known as SNAPHU by Mancini et al. [43]. Different techniques are applied to ALOS PALSAR L1.1 data for preprocessing, including radiometric calibration, speckle filtering, and geometric correction. On ALOS PALSAR data, radiometric calibration techniques are applied, which require removing the deceptive impact of terrain on backscatter measurements. Additionally, it modifies an image's brightness level to adjust for sensor inaccuracies or modify the values to compensate for atmospheric deterioration [44]. Speckle filtering is a common technique utilised in synthetic aperture radar (SAR) data processing, including ALOS PALSAR data, to reduce the speckle noise while preserving the essential image information, such as edges and features. The filtering process smooths out the noise in regions with homogeneous surfaces while retaining the sharpness of edges and boundaries [16]. Within the present study, the Lee-Sigma filter is chosen and implemented to reduce speckles while preserving features and edges. In addition, speckle noises within radar images are produced by the consistent interference of waves scattered back by the roughness of the Earth, which complicates the problem of image interpretation [45]. A 7*7 pixel filter is applied, and the pixels sit in a 3*3 window. The chosen value within the sigma factor field is 0.90.
Geometric corrections are the process of aligning and rectifying the images to remove distortions caused by factors like sensor orientation, terrain relief, and the Earth's curvature. The process involved utilising ALOS DEM 1 sec data to perform the geometric correction and then geocoding the corrected image to a map projection. The rugged terrain can introduce significant geometric distortions in remote sensing imagery due to variations in elevation and relief. Terrain correction, also known as topographic correction, is a crucial step in the processing of such images to compensate for these distortions and ensure that the pixels are in the correct spatial relationship with one another. The preprocessing of the HH and HV polarisations of the ALOS PALSAR L1.1 data is shown in Fig. (3).
Throughout this investigation, the Line module in PCI Geomatica has been designed to automatically detect linear features, which in this case are geological lineaments from HH and HV polarisations images. Geo- logical lineaments refer to linear features or structures on the Earth's surface that represent geological faults, fractures, or other significant geological formations. According to Thannoun [46], PCI Geomatica is recognised as the most commonly applied software for automatically extracting geological lineaments from remote sensing data. The processing of lineament extraction consists of two stages: line detection and contour detection. This modular algorithm comprises three stages: curve extraction, edge detection, and thresholding [47]. The LINE module and the optional parameters it uses for lineament extraction, as described in Thannoun [46], and these optional parameters and their role in the process:
2.4.1. The Radius (RADI)
The RADI parameter represents the radius of the window used for lineament extraction. It defines the size of the neighbourhood around each pixel that is considered when searching for linear features. A larger radius may help detect longer lineaments, but it could also include more noise and non-linear features. On the other hand, a smaller radius may miss some lineaments but can provide a more precise result.
2.4.2. The Gradient Threshold (GTHR)
The GTHR parameter sets the minimum gradient threshold required to consider a pixel as part of a potential lineament. It determines the intensity variation necessary for a pixel to be classified as belonging to a linear feature. A higher gradient threshold might ensure that only prominent lineaments are extracted, while a lower value may lead to more lineaments being detected, including weaker ones.
The length threshold (LTHR) parameter specifies the minimum length required for a detected lineament to be considered valid and included in the final result. Short, fragmented features that do not meet the length threshold will be excluded. This threshold helps eliminate insigni- ficant linear structures that might not be relevant for geological analyses.
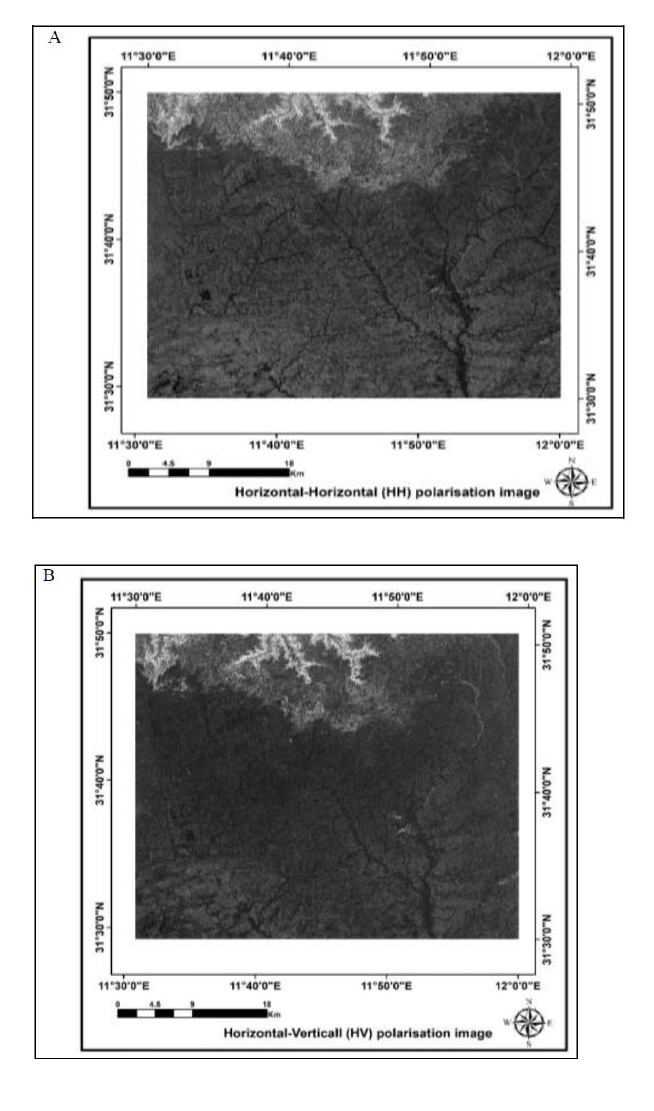
Shows the ALOS PALSAR radar's preprocessing images: (A) the HH polarisation image and (B) the HV polarisation image.
2.4.3. Fill Threshold (FTHR)
The FTHR parameter determines the minimum percentage of valid pixels (pixels with a significant signal) required within a detected lineament. This threshold ensures that lineaments are not extracted from regions with low signal quality, such as areas with strong speckle noise or low radar reflectivity.
2.4.4. Azimuth Threshold (ATHR)
The ATHR parameter sets the minimum threshold for the lineament azimuth (orientation) deviation. It controls the lineaments' allowed deviation from a specified azimuth direction. This helps remove lineaments with orientations significantly different from the main trend, filtering out potential noise or non-geological features.
2.4.5. Displacement Threshold (DTHR)
The DTHR parameter defines the maximum allowable displacement between segments of the same lineament. It helps to connect fragmented lineaments and join them into continuous features, especially in areas where lineaments might be interrupted due to terrain or other factors.
The slope is a commonly used parameter in lineament detection; it is conducted as a significant factor when analysing data from the digital elevation model (DEM) to extract possible geological lineaments [48] in order to validate the extracted lineaments. Definitely, abrupt variations within slope values can be a crucial indicator for identifying linear structures, especially when analysing topographic or elevation data. In geological and geomorpho- logical studies, these linear structures often represent geological faults, fractures, ridges, or other significant features. The shading parameter is also performed on the ALOS DEM 1 arcsecond data using the hillshade tool in ArcGIS 10.8. This is an effective approach to enhance the visualisation of the terrain and improve the identification of geological lineaments. Hillshading is a cartographic technique used to simulate the effects of sunlight on the landscape, creating shadows and highlights that help reveal the terrain's three-dimensional structure. This shading technique can provide valuable information for geological lineament identification and interpretation. Certainly, visual comprehension of the borders between shaded and unshaded regions in the hillshaded DEM can be a powerful method for identifying the presence of geological lineaments. The distinct patterns and features revealed by shading can serve as visual cues. For a better distinction between shaded and unshaded regions, the azimuth was chosen at 315 degrees with an altitude angle of 45 degrees.
3. RESULTS AND DISCUSSION
The observed values of the gravity anomaly within the research area range from -30 mgal to -44 mgal. (Fig. 4). The gravity anomaly exhibits distinct patterns. Speci- fically, low-negative anomalies are identified within the eastern part of the study region, while high-negative anomalies are present in the western and northwest parts. This could be attributed to the presence of less dense subsurface materials or geological structures that result in a weaker gravitational pull. A gravity anomaly map indicates the presence of a graben trending in the southwest (SW) direction associated with extensional tectonic processes in the region. The CBA gravity anomaly suggests the presence of distinct trends that delineate subsurface structural lineaments. These trends are observed in three directions: north-south, east-west, and northwest-southeast.
In this study, faults are typically identified as low gravity zones from the total horizontal gradient map and CET grid analysis (Figs. 5 and 6), which may further be comprehended as geologic boundaries, although gravity anomalies may demonstrate high gravity anomalies depending on the rock density around the survey area. Mostly, the identified faults have trended N-S, E-W, NNW-SSE, and NW-SE. These various patterns all correspond to different tectonic motions. The Northwest-Southeast fault trend is caused by the movement resulting from a collision of European and African plates during the Hercynian tectonic event. The NNW-SSE fault direction is associated with a reactivation of the Cretaceous lineaments located in Hun Graben. On the other hand, the E-W fault trends are subordinate. The fault linked with the development of structures in the Northwest African basin has undergone periodic reactivation as a fault of strike-slip, following a north-south pattern. Furthermore, the north-south fault orientation might be related to the corresponding tectonic event that caused the uplifting of the Nafusah. These reactivations occurred during the beginning of the Caledonian and then Hercynian events.
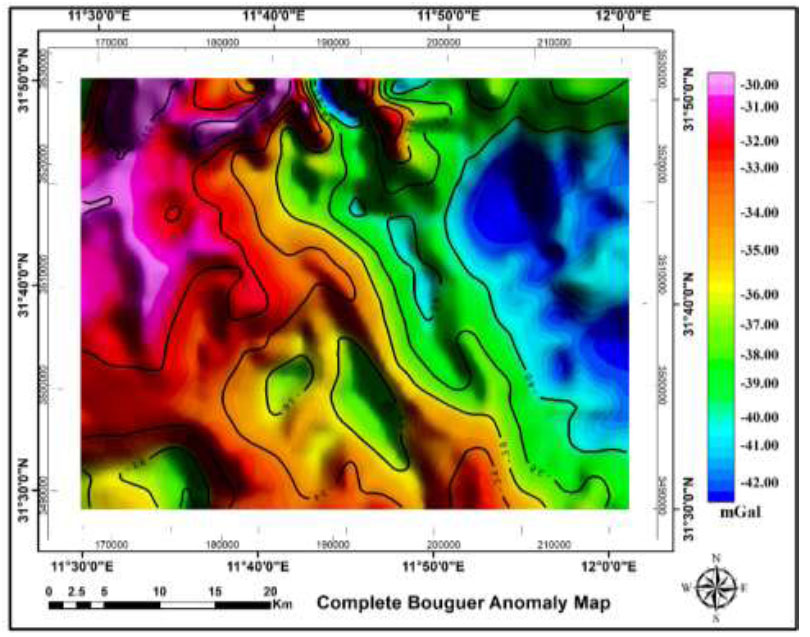
Shows a CBA map of the study area.
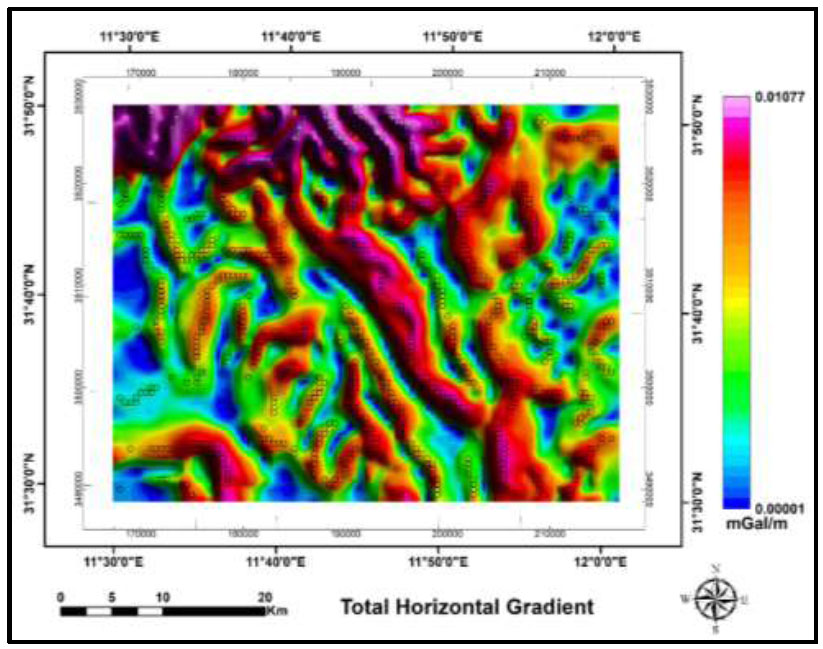
Map resulting from applying the total horizontal gradient.
The Bouguer anomaly in Oasis Montaj is used to generate the Euler solution map. The structural index was assigned different values (0, 1, and 2) to determine the best possible outcomes that could be attained. Further, a structural index of a =0.0 produces more accurate outcomes when compared to SI values of 1 and 2. This is because the data is concentrated in a few particular locations rather than being randomly scattered throughout the research region. A window with a dimension of 5x5, a depth tolerance of 15%, and a structural index of 0.0 indicates the best possible clustering of source-depth solutions. An Euler deconvolution of the gravity anomaly in (Fig. 7) demonstrates that its depth varies from 250 m to more than 2750 m with a north-south, east-west, and northwest-southeast trend. These trends likely represent the predominant orientations of the subsurface structures contributing to the gravity anomaly. The Euler solutions map demonstrated the existence of trending faults that were previously detected by the CET and THG data. This suggests that the Euler deconvolution analysis identified subsurface sources along these faults with specific depths and orientations, supporting the interpretation of the trend faults as significant geological features.
With the contribution of a tilt derivative, the zero-contour in TDR that occurs near or at contact is more distinct. Typically, tilt-angle filtering indicates anomalies close to or at the source. A positive TDR value signifies an effective contrast with the causative source, while a negative value suggests that the observed value falls outside the impact of the source. The magnitudes of the TDR (tilt derivative anomalies) on the Bouguer map vary from -1.6 to 1.6 degrees, as shown in Fig. (8). Furthermore, these TDR values are utilised to identify and locate the edges of geological structures. The TDR of the CBA shows the lineaments of trends N-S (north-south), E-W (east-west), and NNW-SSE (north-northwest to south-southeast). The current results, obtained through the analysis of TDR (Tilt Derivative Anomalies) on the Bouguer map, are consistent with the findings obtained from prior investigations carried out by Goudarzi [49], and Lipparini [29].
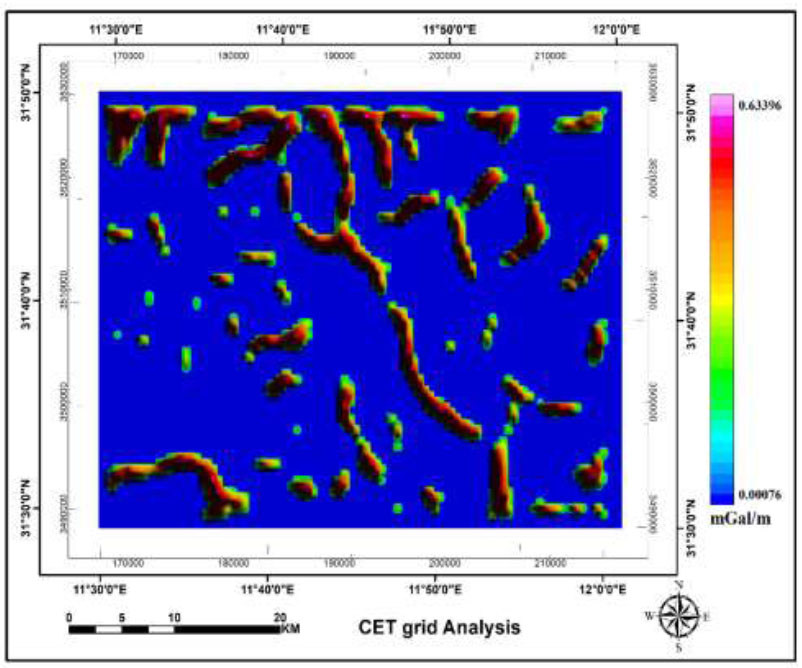
Map resulting from applying the CET grid analysis.
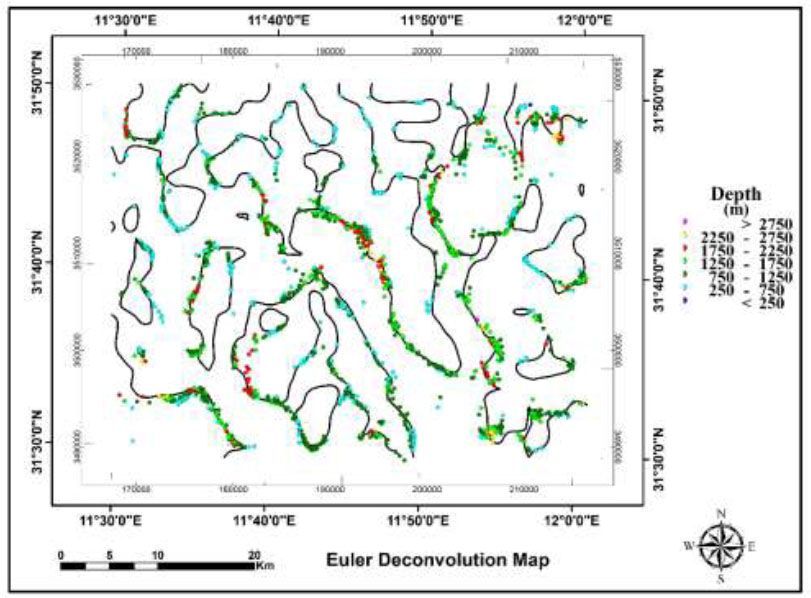
3D Euler deconvolution map (W = 5, SI = 0).
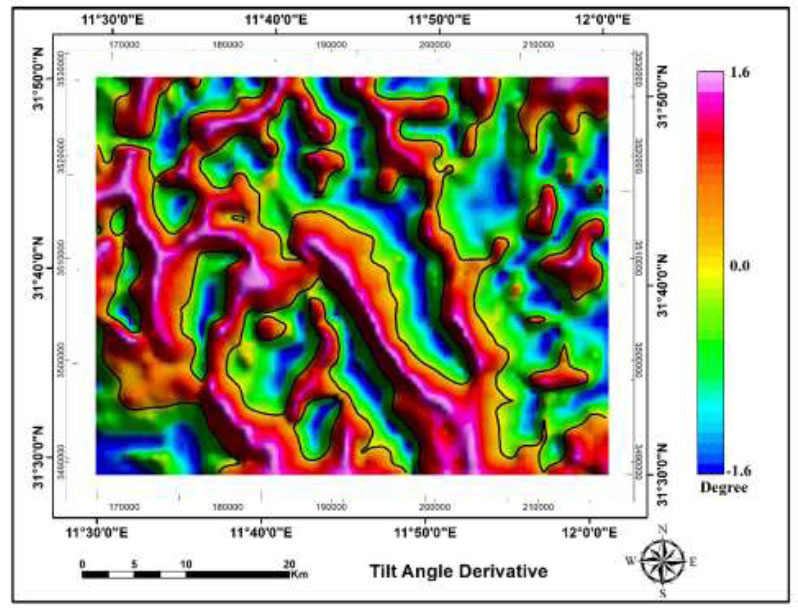
Map resulted from the tilt angle derivative.
The automatic lineament extraction applied to HH and HV polarisation images yields a large number of obtained lineaments. Furthermore, the HH and HV polarisation images possess a resolution that allows for clear identification of linear features such as geological structures like faults, fractures, lineaments, or other elongated patterns on the Earth's surface. The images of the ALOS PALSAR radar data's (Horizontal-Horizontal) and (Horizontal-Vertical) polarisations revealed a significant spatial concentration of the extracted lineaments, with various trends in different directions: North-South, North-Northeast to South-Southwest, East-West, North-Northwest to South-Southeast, and Northeast to Southwest, as shown in Figs. (9A and B). These lineaments may correspond to faults, joints, or other geological structures that exhibit a linear alignment in varying directions. The dominant lineament trend in the region is oriented in the north-south (N-S) direction, with two subordinate or secondary structures present in the area oriented from Northeast-Southwest and East-west. These lineament trends are associated with the tectonic line representing the Jabal Nafusah Arc, which represents an east-west (E-W) secondary trend lineament in the region. The north-northeast to south-southwest (NNE-SSW) lineament trend is attributed to the tectonic activities associated with the formation and evolution of the Tibesti-sirte uplift in the Paleozoic era, while the other lineament directions do not show consistent or significant patterns. The statistically unimportant directions may represent minor fractures, localised geological features, or random variations in the landscape that do not have clear tectonic significance.
In lineament mapping, slop and shading are essential parameters for the interpretation and validation of the extracted lineaments. These parameters play a crucial role in assessing the accuracy, reliability, and geological significance of the identified lineaments. The slope and shading maps were overlain with the automatic lineament extraction. According to the results, most acquired lineaments from the HH polarisation image are placed accurately in areas with abrupt shifts in slope values (Fig. 10A). However, for the extracted lineaments from the HV polarisation image (Fig. 10B), this correlation with the slope values is not observed for most of the lineaments. The contrasting results between HH and HV polarisation images in their correlation with slope values may indicate differences in sensitivity to certain geological structures or surface properties. The findings based on the analysis of the shaded relief map show that the lineaments obtained from the horizontal-horizontal (HH) polarisation are predominantly located along the borders between shaded (darker) and unshaded (brighter) areas (Fig. 11A). Lineaments generated from the HV polarisation images, on the other hand, show significantly less association with the borders of shaded and unshaded regions (Fig. 11B). As a result, the PALSAR that receives horizontal polarisation is more sensitive to terrain characteristics including slope, shade, and relief than the PALSAR that receives vertical polarisation.
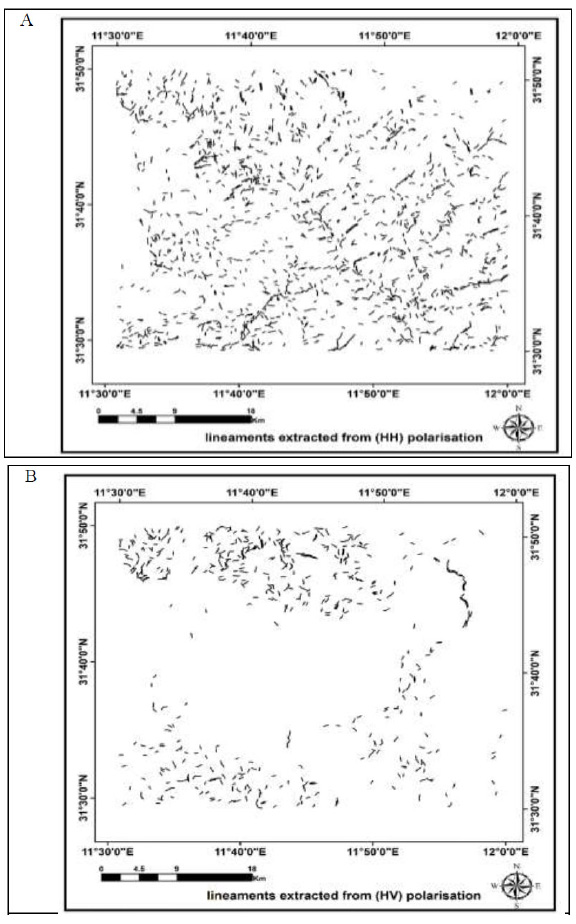
Shows the lineaments extracted from two different radar images: (A) the HH polarisation image and (B) the HV polarisation image.
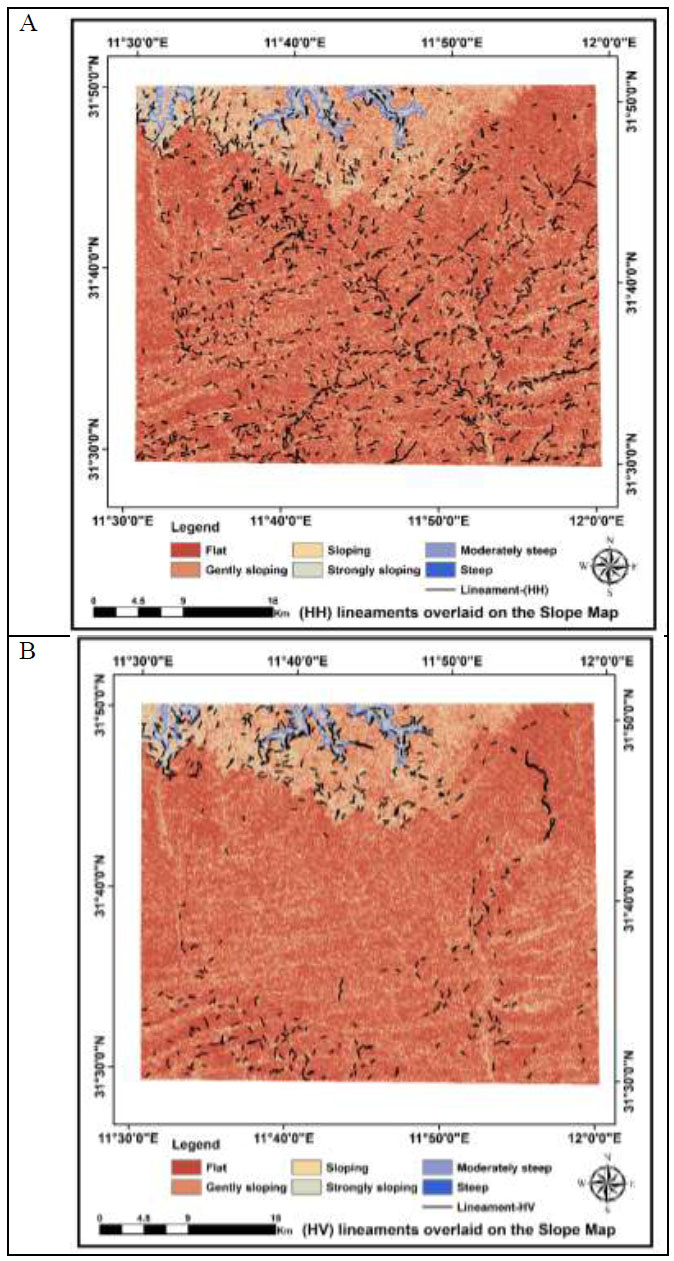
Shows the extraction of lineaments overlaid on the slope map: The HH polarisation image in (A) and the HV polarisation image in (B).
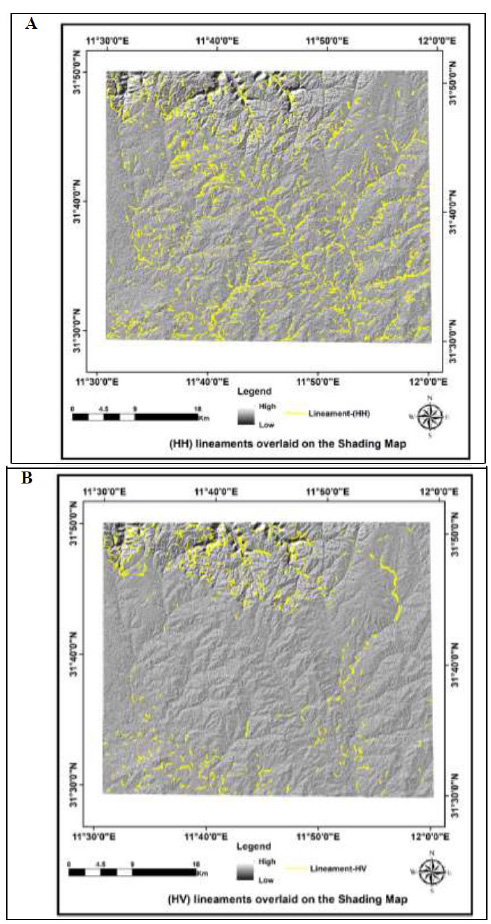
Shows the extraction of lineaments overlaid on a shaded relief thematic map: The HH polarisation image in (A) and the HV polarisation image in (B).
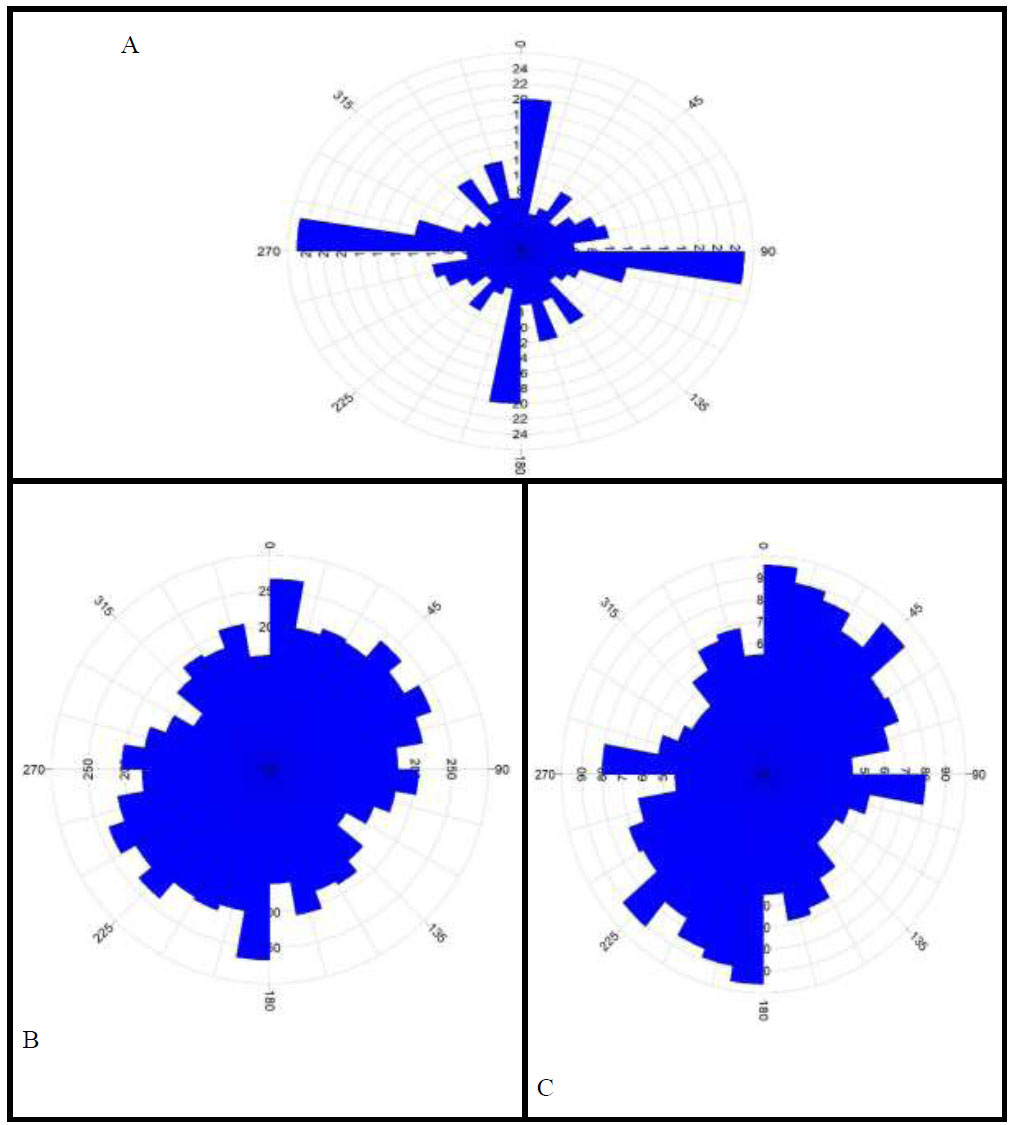
Display three rose diagrams, each representing the orientations of extracted lineaments from different data sources: (A) gravity data, (B) HH polarisation image, and (C) HV polarisation image.
A rose diagram is a powerful and convenient visua- lisation tool commonly used to identify the orientation or preferred directions of geological features, such as linear nets, faults, fractures, or other linear structures. It is especially valuable in the accurate assessment and analysis of geological data [50]. The rose diagrams (Figs. 12A, B, and C) are generated using geological lineaments generated using EIGEN-6C4 gravity data, as well as HH and HV polarisation obtained from the ALOS PALSAR imagery. The orientation of the lineaments resulting from gravity is dominantly N-S, E-W, NW-SE, and NNW-SSE in the study area.
CONCLUSION
The ambiguity regarding the geological interpretation has the potential to be significantly decreased with the integration of EIGEN-6C4 gravity and ALOS PALSAR radar data in the north Ghadames Basin of NW Libya. Various analytical techniques such as total horizontal gradient, CET grid analysis, Euler deconvolution, and tilt derivative are applied to the CBA gravity data, while radiometric calibration, speckle filtering, and geometric correction were applied to preprocess the ALOS PALSAR L 1.1 image. Furthermore, the slope and shading characteristics are utilised to validate the obtained lineaments. The result of applying different filters to the gravity data indicates that the trends of the geological lineaments are in the N-S, E-W, NW-SE, and NNW-SSE directions, with source depths ranging between 250m and 2750 m. The extracted lineaments from HH and HV polarisation images were predominantly oriented in the N-S, NNW-SSE, E-W, NE-SW, and NNE-SSW directions within the study area. The NW-SE fault trend is caused by the movement resulting from a collision of European and African plates during the Hercynian tectonic event. On the other hand, the E-W fault trends are subordinate. The NNW-SSE fault direction is associated with a reactivation of the Cretaceous lineaments located in Hun Graben. The fault linked with the development of structures in the Northwest African basin has undergone periodic reactivation as a fault of strike-slip, following a north-south pattern. Furthermore, the north-south fault orientation might be related to the corresponding tectonic event that caused the uplifting of the Nafusah. All these fault findings are associated with the region's tectonic features.
AUTHORS' CONTRIBUTIONS
It is hereby acknowledged that all authors have accepted responsibility for the manuscript's content and consented to its submission. They have meticulously reviewed all results and unanimously approved the final version of the manuscript.
LIST OF ABBREVIATIONS
| THG | = Total Horizontal Gradient |
| CET | = Centre for Exploration Targeting |
| ED | = Euler Deconvolution |
| TDR | = Tilt Angle Derivative |
| SNAP | = Sentinel Application Platform |
| ALOS | = Advanced Land Observing Satellite |
| PALSAR | = Phased Array L-band Synthetic Aperture Radar |
| HH | = Horizontal-horizontal Polarisation |
| HV | = Horizontal-vertical Polarisation |
| ICGEM | = International Centre for Global Earth Modelling |
| CBA | = Complete Bouguer Anomaly |
| FAA | = Free Air Anomaly |
| AS | = Analytic Signal |
| DEM | = Digital Elevation Model |
| ASF | = Alaska Satellite Facility |
| SLC | = Single-look Complex |
| ERSDAC | = Earth Remote Sensing Data Analysis Center |
| ESA | = European Space Agency |
| SAR | = Synthetic Aperture Radar |
| RADI | = Filter Radius |
| GTHR | = Gradient Threshold |
| LTHR | = Length Threshold |
| FTHR | = Fill Threshold |
| ATHR | = Azimuth Threshold |
| DTHR | = Displacement Threshold |
| SI | = Structural Index |
AVAILABILITY OF DATA AND MATERIALS
The data and supportive information are available within the article.
FUNDING
This study was supported by the Ministry of Higher Education, Malaysia, via Project Code: (FRGS/1/2022/ STG08/USM/03/1).
ACKNOWLEDGEMENTS
Acknowledgement to the Malaysian Ministry of Higher Education for its Fundamental Research Funding Scheme via Project Code: FRGS/1/2022/STG08/USM/03/1 entitled “Performance-based Multimodal Geophysical Design for Soil Dynamic Properties to Improve Visualisation of Subsurface Conditions” and a research university grant entitled “Integrated geophysical characterization of geothermal exploration and strategy for the sustainable use of geothermal resources” with account no. 1001/PFIZIK/8011110.

