All published articles of this journal are available on ScienceDirect.

Response Study of a Tall San Diego, California Building Inferred from the M7.1 July 5, 2019 Ridgecrest, California Earthquake Motions
Abstract
The shaking of a new 24-story tall building in San Diego, California, was recorded by its seismic monitoring array during the M7.1 Ridgecrest, California earthquake of July 5, 2019. The building is located ~340 km from the epicenter of the event. The building is a special moment framed (SMF) steel structure with reduced beam sections (RBS) and viscous damper systems (DS). Peak accelerations recorded by the array indicate 0.007 g at the basement level and 0.044 g at the roof level. Spectral analyses and system identification methods indicate coupled NS, EW, and torsinal fundamental modes at ~ 0.30 Hz frequency and critical damping percentages < 5%. For the EW and fundamental torsional modes, critical damping percentages are < 2.5%. At the low-level shaking, the computed largest average drift ratio is ~ 0.065%, less than 0.5% of the value considered to be the starting threshold of nonlinear behavior or damage.
1. INTRODUCTION
One of the significant positive aspects of the M7.1 Ridgecrest, California earthquake of July 5, 2019, is that there are now response records retrieved from more than a dozen tall buildings (>20 stories) in downtown Los Angeles and San Diego at ~200 km and ~340 km from the epicenter of the event, respectively. Earlier, records from the 73-story, tallest California building and a 51-story building, both in downtown Los Angeles, were studied [1, 2].
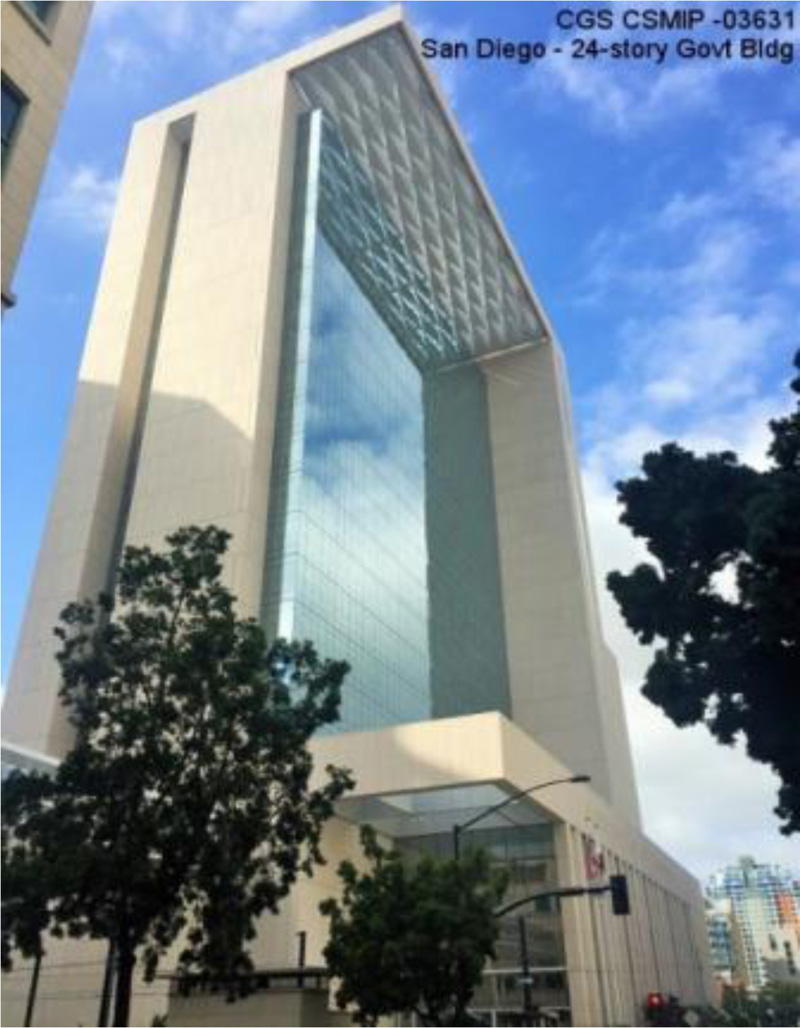
In this paper, we studied the response records from the 24-story, 115.5-m (379 ft)-tall building in downtown San Diego. The building is instrumented by the California Strong Motion Instrumentation Program (CSMIP) of the State of California Geological Survey (CGS) as Station #03631. A picture of the building is provided in Fig. (1). More information about the earthquake, including magnitude, UTC occurrence date/time, and epicentral distance to the building, as well as building-specific recorded peak accelerations at the basement and roof, are provided in Table 1. To the best of our knowledge, this is the first such study on this particular building.
Numerous studies on long-distance, long-period responses of tall buildings severely shaken by events that occur at far distances have been carried out because of seismic structural monitoring projects such as that of CSMIP, U.S. Geological Survey (USGS), and others. Examples of completed studies include but are not limited to the ones mentioned in this study [1-8].
1.1. A Note on Seismic Structural Monitoring
It is important to note that structural monitoring instrumentation programs in the United States are managed by mainly two organizations: (1) State of California Geological Survey, California Strong Motion Instrumentation Program (CSMIP) [https://www.conservation.ca.gov/cgs/smip] and (2) U.S. Geological Survey (USGS), National Strong Motion Project (NSMP) [https://earthquake.usgs.gov/monitoring /nsmp/]. As detailed in a study [9]: “The main objective of seismic instrumentation program for structural systems is to improve our understanding of the behavior and potential for damage of structures under the dynamic loads of earthquakes. As a result of this understanding, design and construction practices can be modified, so that future earthquake damage is minimized.” Furthermore, the utilization of seismic monitoring data is summarized as: “an instrumentation program should provide enough information to reconstruct the response of the structure in enough detail to compare with the response predicted by mathematical models and those observed in laboratories to improve the models. In addition, the data should make it possible to explain the reasons for any damage to the structure. The nearby free-field and ground-level time history should be known in order to quantify the interaction of soil and structure. More specifically, a well-instrumented structure for which a complete set of recordings has been obtained should provide useful information to:
(1) Check the appropriateness of the dynamic model (both lumped-mass and finite element) in the elastic range,
(2) Determine the importance of nonlinear behavior on the overall and local response of the structure,
(3) Follow the nonlinear behavior throughout the structure as the response increases and determine the effect of this nonlinear behavior on the frequency and damping,
(4) Correlate the damage with inelastic behavior,
(5) Determine the ground-motion parameters that correlate well with building response damage, and
(6) Make recommendations eventually to improve seismic codes [10].
(7) Facilitate decisions to retrofit/strengthen the structural system as well as securing the contents within the structures.
In addition, dynamic structural characteristics identified from studies such as presented in this paper are used to improve code formulas for estimating fundamental periods of buildings. Examples of these are moment-resisting frames and shear wall buildings [11, 12]. In both studies, Goel and Chopra utilized identified fundamental period data from the instrumented building. Similarly, for buildings taller than 60 m., critical damping percentages identified from recorded data of instrumented buildings have been used to lower the critical damping percentage to 2.5% (from 5%) in the recommendations of the Los Angeles Tall Buildings Structural Design Council (LATBSDC) [13], as well as the Tall Building Initiative (TBI) of the Pacific Earthquake Engineering Research Center [PEER-TBI) [14].
2. BUILDING STRUCTURAL SYSTEM, FOUNDATION, SEISMIC DESIGN CRITERIA, SITE, AND SITE EFFECTS
2.1. Structural system and foundation
A typical vertical cross-section and seven plan views of the building are provided in Fig. (2) (www.strongmotioncenter.org, last accessed March 26, 2021). The building is 24 stories above and 2 stories below ground level. In-plan shape is best described as irregular-rectangular and asymmetric. There is also clear vertical irregularity (as shown in Fig. 1 and vertical cross-section in Fig. 2). The base dimensions of the building are 90.2 x 60.7 m (296 x 199 ft). Typical floor dimensions are 77.1 x 30.5 m (253 x 100 ft) (www.strongmotioncenter.org, last accessed March 26, 2021).
| Ridgecrest Earthquake of July 5, 2019 | |||||
|---|---|---|---|---|---|
| Mw | Epicentral Distance (km) |
Earthquake Origin Time (UTC) | Peak Accel. (g) | ||
| Ground | Building | ||||
| 7.1 | 340.9 | 2019-07-06 03:19:53 | .007 | .044 | |
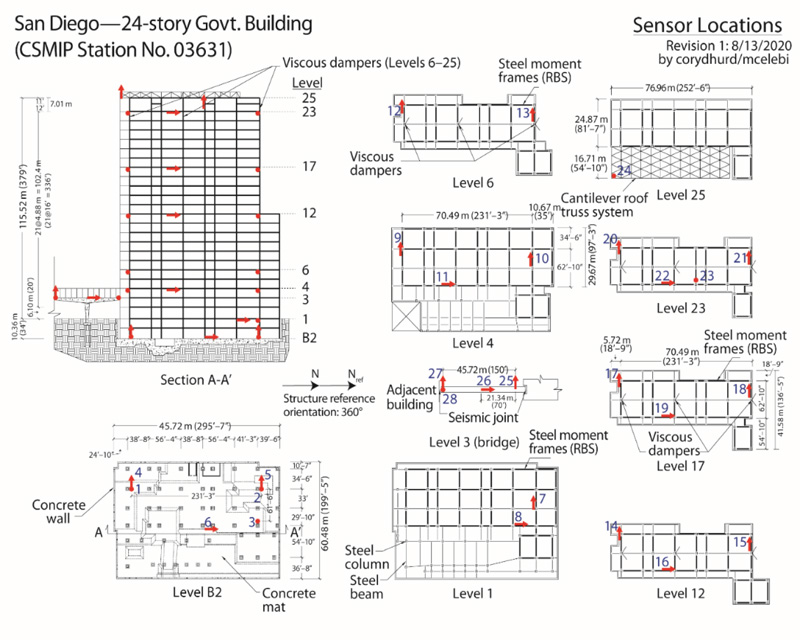
Arrows and dots in the vertical cross-section and plan views display the instrumented levels, locations, and orientations of the accelerometers. The monitoring array is further described later in the paper.
The fact sheet for the building in the Center for Engineering Strong-Motion Data (CESMD) website (www.strongmotioncenter.org, last accessed March 26, 2021) describes the building as having (a) been designed according to the 2010 California Building Code [15] and (b) a lateral force-resisting system with:
(1) Special steel moment frames (SMF) along with major gridlines in the transverse (NS) direction.
(2) Special steel moment frames (SMF) along with the perimeter in the longitudinal direction (EW) with the addition of damping systems (DS) in the longitudinal (EW) direction (viscous dampers are located along with the height of the structure from Level 6 to the roof, typically six but not less than four at each level).
(3) Special steel moment-resisting frames (SMF) with reduced beam section (RBS) connections in both directions. RBS allows plastic hinges to develop, not at joints but away from joints.
(4) Concrete shear walls and steel moment frames that provide lateral resistance below Level 1.
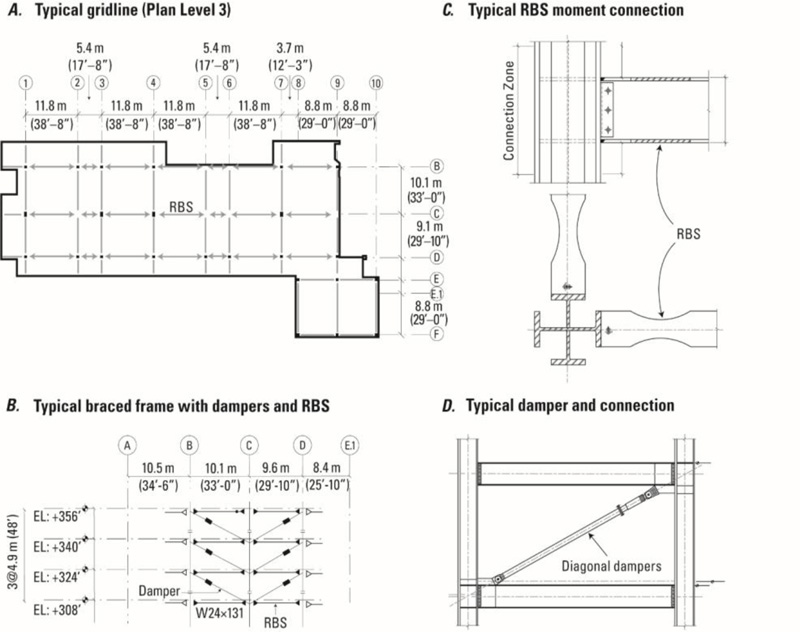
Fig. (3) depicts (a) a typical floor plan that shows the location of RBS and dampers, (b) a typical vertical section that shows both RBS and diagonal dampers, (c) a typical RBS and related connection detail, and (d) a typical diagonal damper and connection.
2.2. Seismic Design Criteria
According to the design blueprints, seismic design criteria are based on California Building Code 2010 [15] and ASCE 7-05 [16]. The following parameters apply: (1) Occupancy category, III, (2) Seismic importance factor, I = 1.25, (3) Spectral acceleration for reference site class, SS = 1.57g, (4) Site-specific ground motions, S1 = 0.62g, (5) Soil site class, D, (6) Site coefficients, FA = 1.00 and FV = 1.50, (7) Maximum Credible Earthquake (MCE) spectral coefficient, SMS = 1.57g, (8) Design Earthquake (DE) coefficient, SDS = 1.05g, and (9) Seismic Design Category, D.
The building is built on a 0.9 to 5.5-m (3-18 ft)-thick mat foundation. There are no piles.
2.3. Site and Site Effects
General site geology (upper geotechnical layer, GTL) is described as thin fill over alluvium and as Site Class D stiff soil with 180 m/s ≤ VS30 ≤ 360 m/s (600 ft/s ≤ VS30 ≤1200 ft/s)(www.strongmotioncenter.org, last accessed March 26, 2021).
Using the upper and lower limits of Vs30 as 180 m/s and 360 m/s, respectively, and the simple site period formula, Ts = 4H/Vs, we obtain 0.33 s ≤ Ts ≤ 0.67 s, where H is the depth of soil layer (in this case taken as 30 m). Immediately, we can conclude that for the ~30-m-deep GTL as defined by the Vs30 range, a 24-story building (with an estimated T ~ N/10 ~ 24/10 ~2.4 s, using the well-known approximate formula, with N being the number of stories) would not necessarily be affected by the GTL. We stress, however, that this is based on gross estimates of Vs30 and is not necessarily accurate.
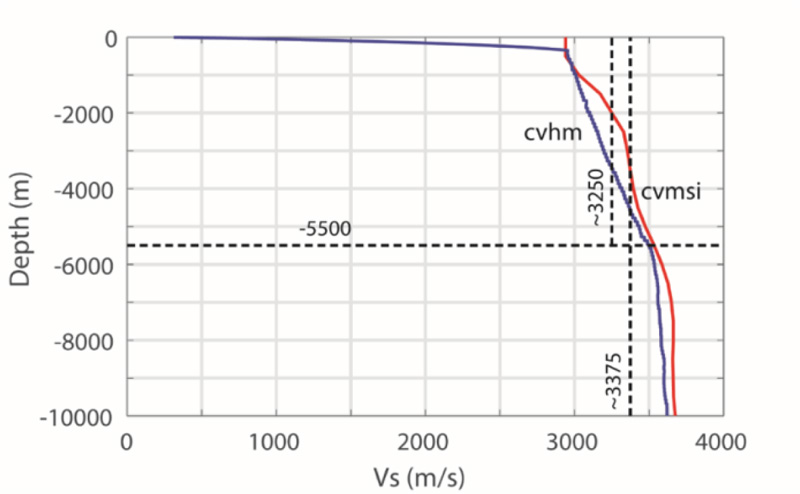
We also explored the coordinate-based, deep-velocity structure at the location of the building to test whether there may be long-distance, long-period effects on the response of the building. This requires deep-velocity profiles that relate the depth to Vs values. Fig. (4) shows Vs-depth profiles from two community velocity models (cvmsi and cvmh) computed and made available by Graves (Robert Graves, USGS, written comm., November 20, 2019). Detailed descriptions of these models (cvmsi and cvmh) are provided and are not repeated herein [17-19].
Fig. (4) shows that both profiles are similar. Therefore, we can use the simple relationship (Ts=4H/Vs) to estimate approximate site periods. Simply, we use an average Vs ~ 3250 m/s corresponding to a depth of ~ 5500 m as a low-end estimate of Ts~ 4 x 5500/3250 ~ 6.8 s. Using VS ~3375 and depth of ~10000 m yields larger Ts. Hence, we conclude that a deep-velocity structure will not affect this 24-story building with respect to long-period shaking.
3. SEISMIC MONITORING ARRAY AND DISTRIBUTION
Seismic instrumentation of the building was completed by CSMIP in 2017, with a total of 24 channels of accelerometers. However, the actual number of accelerometers deployed in the building array is 24, plus an additional four accelerometers deployed on a 45.72-m-(150 ft) long walkway bridge that connects this building to another building. The bridge is separated from the building with a seismic joint (www.strongmotioncenter.org, last accessed March 26, 2021); hence, the bridge data are not included in the scope of this study. As described earlier, the seismic monitoring array of the building is depicted in a vertical section, and seven plan views are presented in Fig. (2). For ease in following the analyses in this study (or future studies), the 24 channels of data are organized in Table 2 according to the location (height of the level of each channel sensor and orientation). In the table, EW1 and EW2 are separated to enable computation of torsional acceleration, as done in the following section.
4. EARTHQUAKE DATA AND ANALYSES
4.1. Acceleration and Displacement Time-Series
Fig. (5) shows horizontal NS, EW, and torsional acceleration time histories. Similarly, Fig. (6) shows horizontal NS, EW, and torsional displacement time histories. As can be seen in Fig. (2) and Table 2, “torsional” is defined as the difference between the two EW channels (EW1 and EW2) on an instrumented floor. Thus, torsional accelerations are computed for the B2, 4th, 6th, 12th, 17th, and 23rd levels (Fig. 5c). Corresponding torsional displacements are provided in Fig. (6c). We note that there is only one accelerometer in the EW direction on the 1st floor; hence, no torsional acceleration is computed (or plotted) at that level. There are no horizontal accelerometers on the 25th floor.
Note that in all (NS, EW, and torsional) time histories: (a) After 50 seconds into the records, the building appears to be in free vibration, with a fundamental period in their respective directions, and (b) There is an apparent beating response that is clearly observable. However, due to the short (150-s) record length, it is difficult to clearly define and compute a specific “beating period” from the records; hence, further deliberations on the beating effect are not pursued. Beating is caused by closely coupled modes and low critical damping percentages [20, 21].
|
Floor/ Level |
Height (between B2 upwards) | Between instrumented levels | NS |
EW1 (south) |
EW2 (north) |
VERT | ||
|---|---|---|---|---|---|---|---|---|
| H(ft) | H(m) | Between Levels/Floors | Hi(m) | |||||
| Level B2 | 0 | 0 | 0 | 6 | 4 | 5 | 2,3,4 | |
| 1 | 34 | 10.36 | B2 and 1 | 10.26 | 8 | - | 7 | - |
| 4 | 86 | 26.21 | 1 and 4 | 15.85 | 11 | 9 | 10 | - |
| 6 | 118 | 35.97 | 4 and 6 | 9.76 | - | 12 | 13 | - |
| 12 | 214 | 65.23 | 6 and 12 | 29.26 | 16 | 14 | 15 | - |
| 17 | 294 | 89.61 | 12 and 17 | 24.38 | 19 | 17 | 18 | - |
| 23 | 390 | 118.87 | 17 and 23 | 29.26 | 22 | 20 | 21 | 23 |
| 25 | 413 | 125.88 | 23 and 25 | 7.01 | - | - | - | 24 |
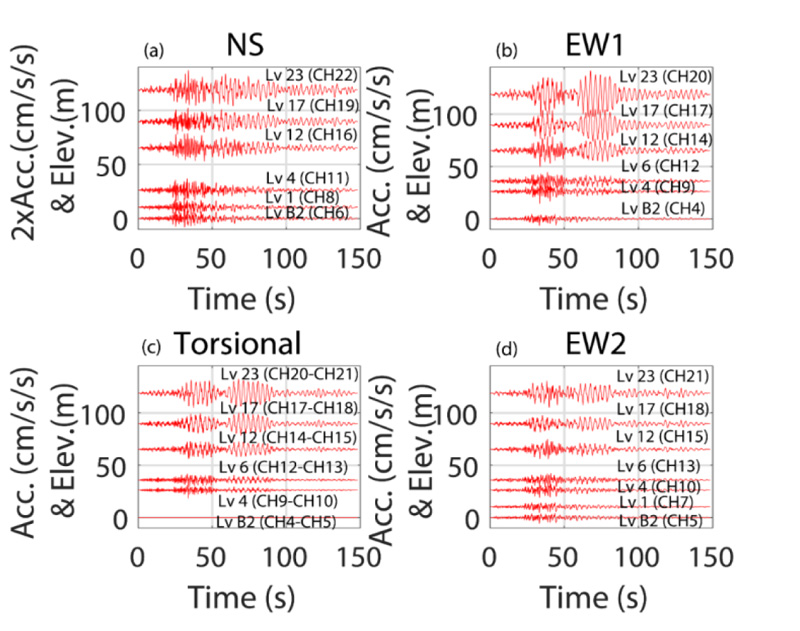
Note: (1) The vertical axes represent both acceleration and elevation for each level for which the time history is plotted. (2) For (a) NS direction, accelerations are amplified by a factor of 2 for better display. (3) Particularly for EW and torsional plots, there is an indication of a beating effect.
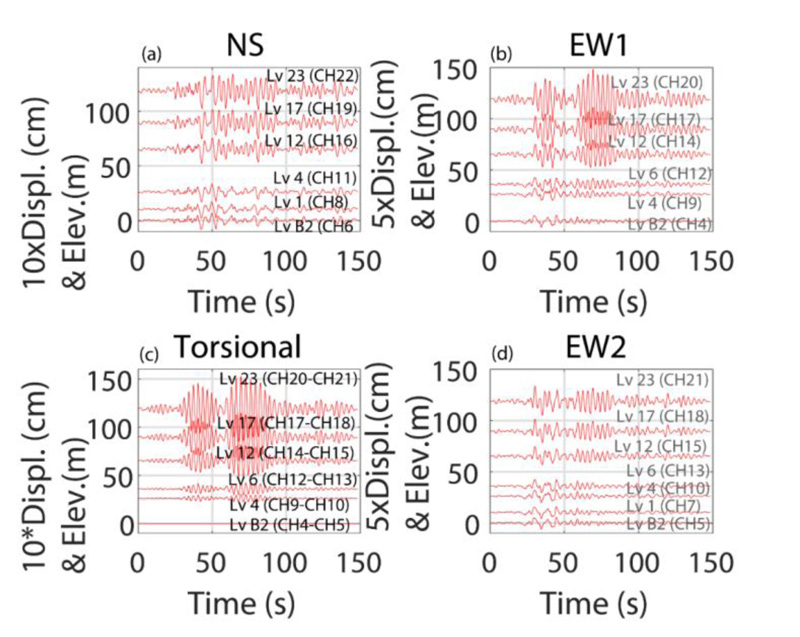
Note: (1) The vertical axes represent both acceleration and elevation for each level for which the time history is plotted. (2) For (a) NS direction, accelerations are amplified by a factor of 10 (in a and c) and 5 (in b and d) for better display. (3) Particularly for EW and torsional plots, there is an indication of a beating effect.
4.2. Vertical Accelerations and Displacements
There are five vertical accelerometers in the building seismic monitoring array (Fig. 2 and Table 2). Acceleration recorded by CH24, which is deployed at 25th level, is depicted in Fig. (7a). Accelerations recorded at three vertical channels at the basement (B2) level are listed as CH1, CH2, and CH3 and at the 23rd level by CH23 (Fig. 7b). Similarly, the corresponding displacement at the 25th level is shown by channel CH24 (Fig. 7c) and those at the basement by CH1, CH2, CH3, and CH23 (Fig. 7d).
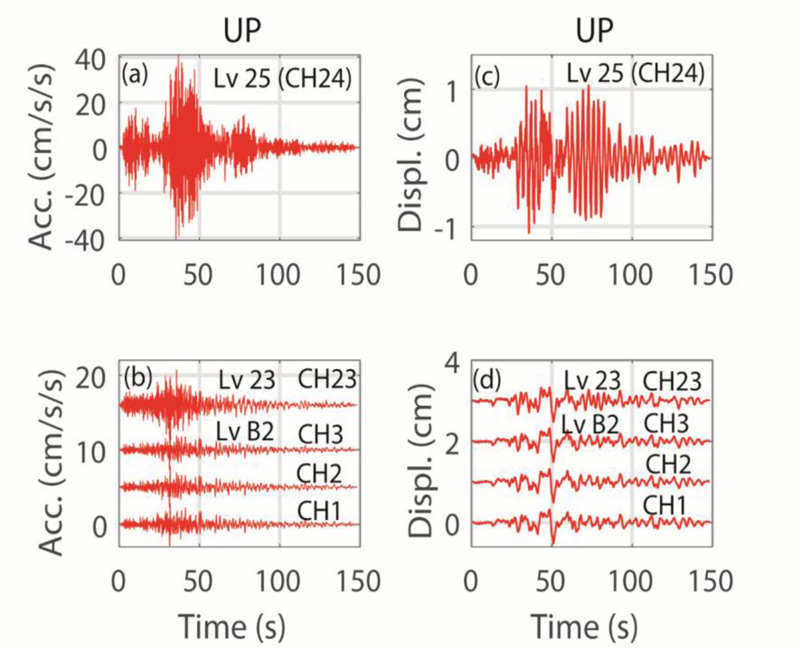
We note the following in examining these vertical acceleration and displacement plots:
(a) The shapes of the vertical acceleration and displacement time-histories of CH24 (25th level) are very different than those of the vertical channels at the B2 level and,
(b) The amplitude of peak acceleration of the vertical channel (CH24) is approximately twenty-fold that of those at channels 1, 2, 3, and 23. The amplitude of peak displacement of the vertical channel (CH24) is approximately double that of those at channels 1, 2, 3, and 23. This implies that the vertical channel (CH24) at the 25th level is possibly influenced by both the vertical and horizontal structural shaking of the tower. Note that the vertical channel (CH24) at the 25th level is located at the unsupported corner of a cantilevered floor at that level (Fig. 2). We further examine this later in the paper.
4.3. Amplitude Spectra, Spectral Ratios, Coherency and Phase
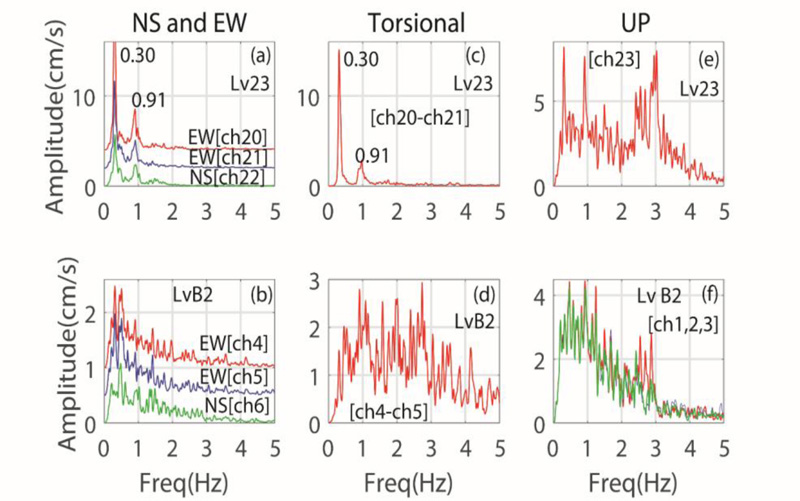
For the 0- to 5-Hz frequency band, Fig. (8) shows amplitude spectra of accelerations in the NS and EW directions, respectively, at (a) the 23rd level, and (b) the B2 level in the torsional direction, at (c) the 23rd level, and at (d) the B2 level in the vertical (UP) direction, and at (e) the 23rd level, and (f) B2 level. In each frame of the figure, channels for which amplitude spectra are computed are identified. For the frequency band between 0 to 5 Hz, the spectra clearly depict very similar frequencies of ~ 0.30 Hz and ~0.90 Hz for the first and second horizontal modes. These frequencies, identified by peak-picking for the 1st modes in NS, EW, and torsional directions (all being ~0.3 Hz), lead to the assertion that these modes are coupled. The same holds for the second mode (all being ~0.9 Hz).
For the 0- to 2-Hz band, we show both repeatabilities of frequencies for all instrumented levels (Fig. 9) with all amplitude spectra of horizontal accelerations in (a) NS, (b) EW1, (c) torsional, and (d) EW2 directions. By peak-picking, for the first modes in NS, EW, and torsional directions, ~0.3-Hz frequency is consistently and repeatedly identifiable. For the second NS and EW modes, ~0.9 Hz is identified; however, for the torsional second mode, ~0.98 Hz is identified. A ~0.43-Hz frequency is also apparent in the amplitude spectra in all horizontal directions. We elaborate on this later in the paper.
Further confirmation of the significant frequencies
(Fig. 10) is shown by ratios of amplitude spectra at the 23rd level and other levels (in descending order) with respect to those at the B2 level for the (a) NS and EW and (c) torsional directions. We make several points such as:
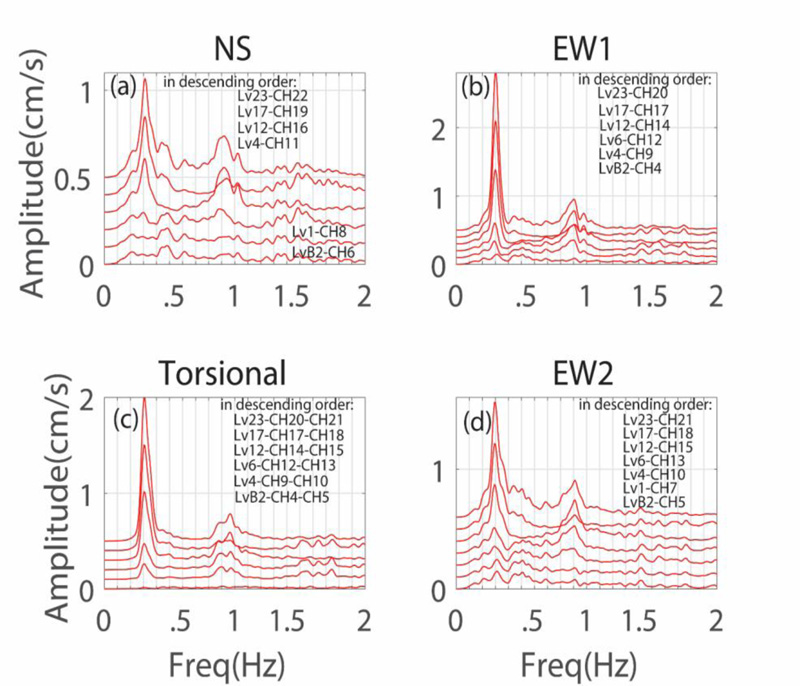
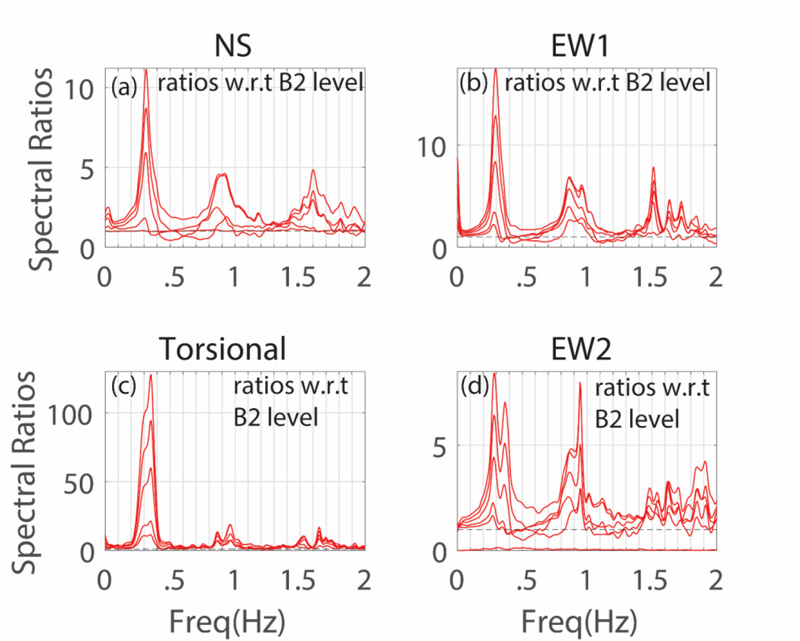
(a) For the first mode, ~ 0.3-Hz frequency appears more clearly in spectral ratios at all levels and in the NS and EW1 directions, torsional and EW2 spectral ratios show a wider 0.3- to 0.38-Hz frequency range. In fact, for EW2, there is an additional clear peak around ~ 0.38-Hz frequency.
(b) Similarly, the range of frequencies for the second modes also changes between 0.9 Hz to 0.98 Hz. A wider and/or double peak is clearly seen around 0.9Hz in the spectral ratios in all directions.
(c) The third mode for EW direction is at ~1.50 Hz.
(d) These variations of first and second modal frequencies may be attributed to changing of the distance between the center of rigidity and the center of mass as the “in-plan” configuration changes at several levels from the top to the B2 level (see plan views and vertical section in Fig. 2). In summary, these variations may likely result from the irregular and asymmetric design of the building.
(e) Furthermore, it is likely that reduced beam sections (RBS) and damping system (DS) also contributed to the variation in frequencies (periods).
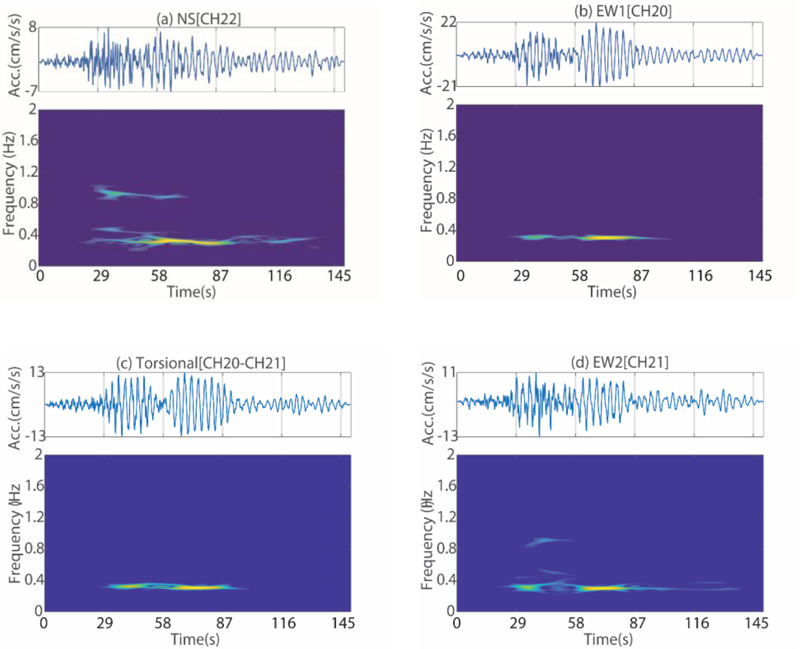
In Fig. (11), time-frequency distribution (TFD) of accelerations at the 23th level are plotted in (a) NS (CH22), (b) EW1 (CH20), (c) torsional (CH20-CH21), and (d) EW2 (CH21) directions. In all four TFD plots, ~0.30 Hz is clearly recognized (Fig. 11). In the NS and torsional directions, second modal frequency ~0.90-0.98 are also identifiable. Within ~25 to 35 seconds of the record, a ~0.43-Hz frequency is observable in the NS direction (Fig. 9), as discussed later in the paper.
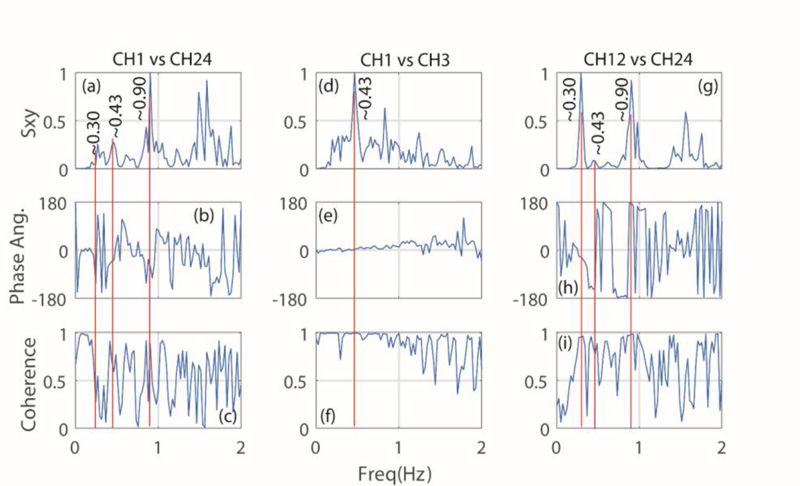
We further clarify and confirm (Fig. 12) these frequencies as cross-spectra (Sxy), phase angle (θxy), and coherency (γxy) plots of CH22 and CH11 in the NS (Fig. 12a-c) direction, CH20 and CH9 in the EW (Fig. 12d-f) direction, and CH20-CH21 and CH9-CH10 in the torsional (Fig. 12g-i) direction for accelerations recorded at the 23rd and 4th levels. We observe that ~0.3-Hz (first mode) and ~0.9-Hz (second mode) frequencies, depicted in NS, EW, and torsional cross-spectra (Sxy), all have 0o and 180o phase angles (θxy) respectively, and coherencies (γxy) of ~1. A third mode frequency of ~1.50 Hz is seen in the NS cross-spectrum (Sxy), with a 0o phase angle (θxy) and a coherency (γxy) of 1. For further information on computations of Sxy, θxy, and γxy, the study of Bendat and Piersol [22] can be referred.
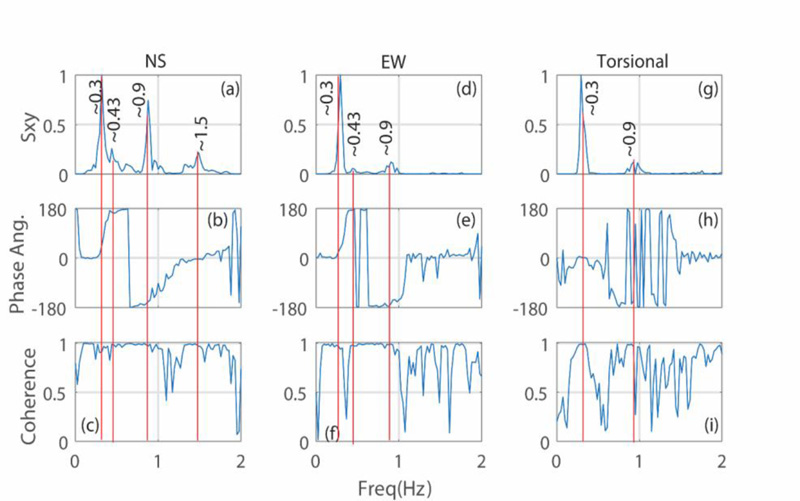
We noted earlier that the EW and torsional spectral ratios also indicated a peak at ~0.43-Hz frequency. Figs. (12a and 12b) also show (for both NS and EW motions) that Sxy has a peak at ~0.43 Hz, with γxy ~ unity, but θxy is ~180o. This peak is not seen in the Sxy of torsional motions (Fig. 12g). Therefore, it can be neither the first nor the second horizontal modal frequency. The fact that it is not observed in the torsional direction likely means it is cancelled out by the computation of the difference between two parallel EW (EW1-EW2 at the same floor) motions. Hence, the only likely explanation is that 0.43-Hz frequency belongs to vertical motions.
Fig. (13a-c) depicts Sxy, θxy, and γxy (respectively) for the pair of vertical channels (CH1) at the B2 level and (CH24) at the 25th level. Fig. (13d-f) depicts Sxy, θxy, and γxy for the pair of vertical channels (CH1 at CH3) at B2 level. Similarly, Fig. (f,g,h) depicts Sxy, θxy, and γxy for the pair of horizontal channels (CH12) at 6th level and vertical channel (CH24) at 25th level. The already identified and discussed fundamental (~0.30-Hz), second (~0.90-Hz), and third (~1.50-Hz) modal frequencies are consistent with appropriate phase angles and coherency of ~ 1. However, the ~0.43-Hz frequency, as depicted in Sxy, θxy, and γxy plots Figs. (d,e,f), for the two vertical channel pair (CH1 and CH3) at B2 level clearly depicts θx = 0o phase angle and coherency (γxy) of 1. Hence, we conclude again that the ~0.43-Hz frequency is a vertical frequency (as it also appears in horizontal spectra and spectral ratios).
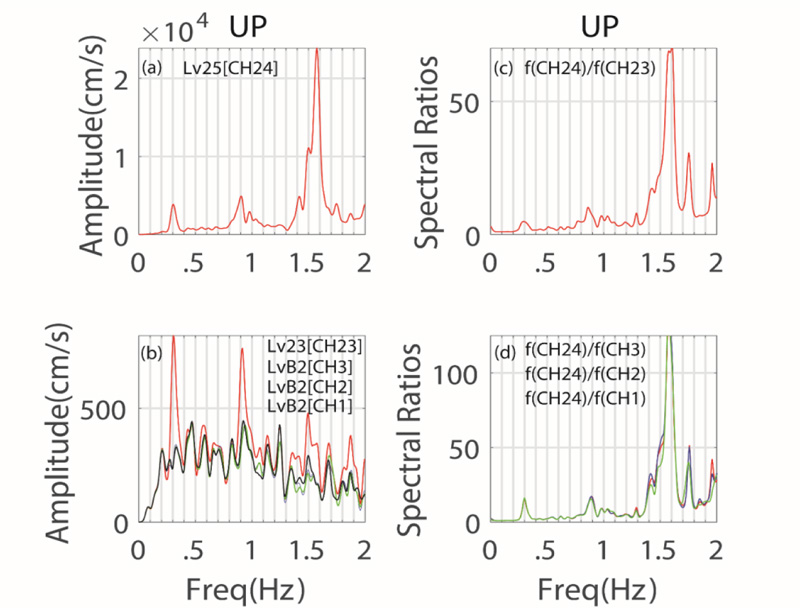
We further elaborate on this subject by introducing Fig. (14), which displays amplitude spectra of vertical accelerations (a) at the 25th Level (CH24), and (b) the 23rd level (CH23), and B2 Level (CH1, CH2, and CH3). Fig. (14c,d), displays spectral ratios of amplitude spectra (CH 24) with respect to those at the 23rd Level and with respect to those at the B2 level. The figures show that the horizontal frequencies of ~0.3 Hz, ~0.9 Hz, and ~1.50 Hz appear in all vertical spectra and spectral ratios. In addition, although comparatively small in amplitude, the ~0.43-Hz peak is also observable in all spectra but practically cancels out to ~1 in the ratios. This directly implies that the ~0.43 Hz peak is a vertical frequency and a likely site frequency, as it does not amplify throughout the building.
4.4. System Identification
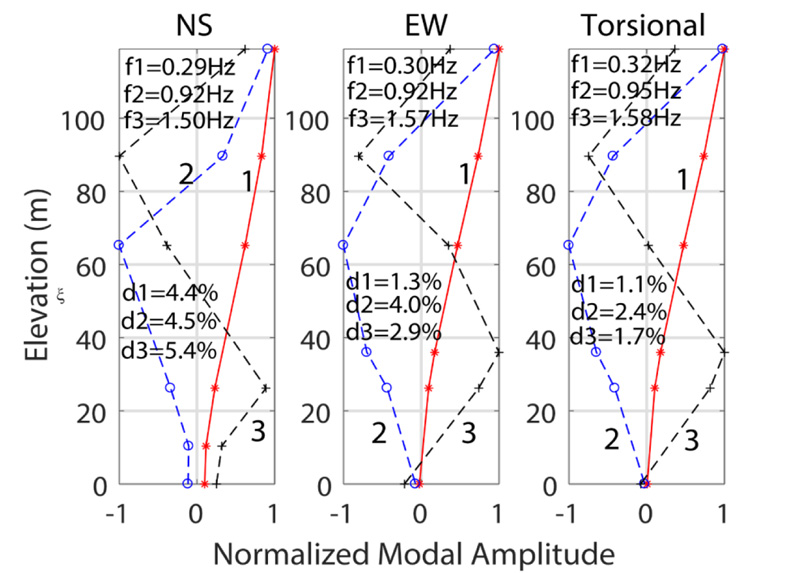
We use Numerical Algorithms for Subspace State Space System Identification (N4SID), coded in MATLAB [23] to extract (a) modal frequencies (f), (b) modal critical damping percentages (ξ), and (c) mode shapes. Background information about this method is provided in Juang [24], Van Overschee and De Moor [25, 26], and Ljung [27]. Essentially all data, including those at the basement or ground floor of a building, are used as output. Using the N4SID method, the extracted mode shapes for the first three modes are plotted separately in Figs. (15) for each of the (a) NS, (b) EW, and (c) torsional directions. In each frame of the figure, identified frequencies (f) and critical damping percentages (ξ) are shown.
The frequencies are similar to those determined by spectral ratios. Both the frequencies and critical damping percentages (ξ) are tabulated in Table 3 and later in this paper for further discussion. We note that, for this earthquake shaking data set, the critical damping percentages (ξ) shown in each frame of Fig. (15a-c) as d1, d2, and d3 (for the first three modes) are consistently lower than ~5% in the NS, EW, and torsional directions, and lower than 2.5% for only the first (fundamental) mode of the EW and torsional directions.
| Frequency (f)/Period(T) | Critical Damping % (ξ) | |||||
|---|---|---|---|---|---|---|
| Mode | 1 | 2 | 3 | 1 | 2 | 3 |
| System Identification | ||||||
| NS | ~0.29/3.45 | ~0.90/1.11 | ~1.50/0.67 | 4.4 | 4.5 | 5.4 |
| EW | ~0.30/3.33 | ~0.92/1.09 | ~1.57/0.64 | 1.3 | 4.0 | 2.9 |
| Torsion | ~0.30/3.33 | ~0.951.05 | ~1.58/0.63 | 1.1 | 2.4 | 1.7 |
| Spectral Ratios | ||||||
| NS | ~0.30-0.38/2.63-3.33 | ~0.90-0.98/ 1.02-1.11 | ~1.50/0.67 | - | - | - |
| EW | ~0.30-0.38/2.63-3.33 | ~0.90-0.98/1.02-1.11 | ~1.50/0.67 | - | - | - |
| Torsion | ~0.30-0.38/2.63-3.33 | ~0.90-0.98/1.02-1.11 | ~1.50/0.67 | - | - | - |
It is possible that the damping percentage in the NS direction (4.4%) for the first mode may be due to the presence of dampers in the building. In general, these are consistent with several other studies of recorded responses of tall buildings, including but not limited to those mentioned in this study [3-5, 28]. It is also consistent with the recent recommendations of the Los Angeles Tall Buildings Structural Design Council (LATBSDC) [13] as well as the Tall Building Initiative (TBI) of the Pacific Earthquake Engineering Research Center (PEER-TBI) [14].
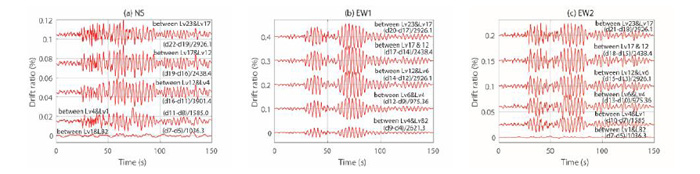
4.5. Drift Ratios
An important objective of seismic structural monitoring is to determine, during or following an earthquake, if an instrumented building has experienced nonlinear behavior and/or suffered damage. It is now an established routine to simply make a speedy assessment by computing drift ratios [29]. For the subject building, Fig. (16) shows the average drift ratios between several pairs of instrumented floors. These are computed by relative displacements between any pair of instrumented floors and dividing that by the difference in elevation of the same pair of floors. Accordingly, the largest peak average drift ratio is ~0.065% in the EW2 lineup, between levels 17 and 12. These levels of drift ratios are smaller than a drift ratio that indicates the onset of damage (e.g., 0.5%) [5, 29, 30] and The Building Standards Law of Japan (BCJ) [31, 32].
5. DISCUSSION
In this paper, we studied the very first set of response data recorded by a seismic monitoring array in a unique San Diego, California building at ~340 km distance from the epicenter of the M7.1 Ridgecrest, California earthquake of July 5, 2019. The building is asymmetric and irregular, both vertically and in-plan. It is of steel construction, including special seismic moment frames with Reduced Beam Sections (RBS) and diagonal dampers. The largest peak accelerations at the basement and superstructure are 0.007 g and 0.044 g, respectively. Identified modal frequencies and critical damping percentages are summarized in Table 3.
CONCLUSION
We identify the following conclusions from the study of the recorded responses of the building:
(i) The NS, EW, and torsional structural frequencies are similar, and the corresponding first, second, and third modes are coupled.
(ii) For the first and second modes, there is some variation of the frequencies that is attributable to the effect of torsional behavior resulting from the varying distance between the center of rigidity and the center of mass of multiple levels, as depicted in changing plan views (Fig. 2). These variations in frequencies, identified by spectral ratios, are separately summarized in Table 3.
(iii) We conclude that for the first mode, the variation of frequency, f (period, T) [e.g. ~ 0.30<f<0.38 Hz (2.63<T<3.33 s)] is substantial (~0.26%).
(iv) It is likely that reduced beam sections (RBS) and damping system (DS) contributed to the variation in the frequencies (periods) as well.
(v) Critical damping percentages are all less than 5% and less than 2% for the EW direction.
(vi) From the records, we deduce an ~0.43-Hz vertical site frequency. In the future, this should be confirmed from actual measurements of Vs versus depth at the site (borehole logs when available), rather than relying on Vs30 approximations, as we have done in this paper.
The effect of the variation of the distance between the center of rigidity and the center of mass in multiple levels of the building to the modal frequencies is a subject that will be investigated separately. In addition, another subject for future studies should be to identify dynamic characteristics using (low-amplitude) ambient records and compare them with those from seismic records.
CONSENT FOR PUBLICATION
Not applicable.
FUNDING
None.
CONFLICT OF INTEREST
The authors declare no conflict of interest, financial or otherwise.
ACKNOWLEDGEMENTS
Declared none.

