All published articles of this journal are available on ScienceDirect.
Losses and Productivity Parameters for Cladding Technology with Wet-Process Sprayed Mortar
Abstract
Background and Objective:
The wet-process sprayed mortar is a potential solution to minimize the traditional application negative points. However, its use is still incipient and a recent technological innovation in several regions of Brazil. Few available parameters that attest gains to subsidize the budget, design, and execution of cladding are systematized. This paper aims to evaluate the industrialized mortar loss and labor productivity in the execution of internal and external cladding for buildings.
Methods:
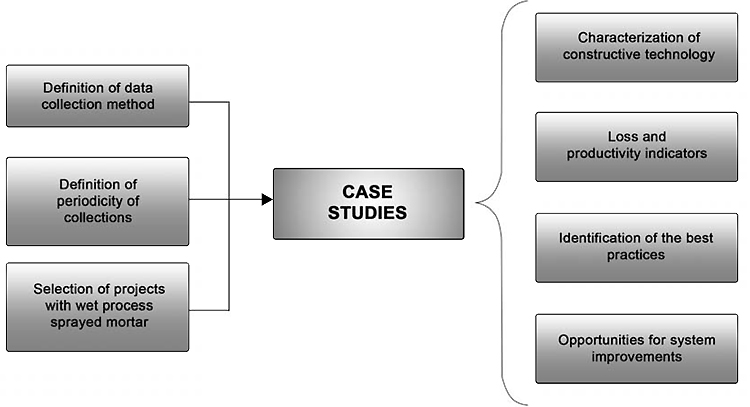
The first step was to define the elements to characterize the constructive cladding technology with mechanical projection of mortar and method for effective data collection. The second step consisted in the accomplishment of the field research, which took into account the case studies in 08 buildings under construction. The third step intended to describe the best practices highlighted in the construction works analyzed and the fourth step described the identification of actions able to succeed in the implementation and operation of the system.
Result:
The results allowed verifying industrialized mortar loss varying from 6.38% to 150.02%, as well as masons’ productivity from 0.18M’hr/m2 up to 5.91M’hr/m2. The present research also made it possible to identify factors influencing the increase in the loss indicator, such as the fresh mortar consistency, failure in the transport and control of bagged materials, and high thicknesses in the cladding layer. As for the factors that favored productivity, it is important to highlight: the experience of the masons involved, the mortar application to the windows, and good logistics for the transportation of bagged goods.
Conclusion:
Identification of the best practices, opportunities to improve production management, and obtainment of quantitative references comprise the main contributions of this research, which may help in adoption of this technology and solution of similar problems by construction companies.
1. INTRODUCTION
The wet-process sprayed mortar is considered as the most adequate alternative to achieve high performance in the building coating execution. There has been increasing interest in the use of mortar designed as an application system for these coatings [1-3].
However, there are few companies using this technique and few studies that approach systemically the possible benefits in efficiency provided by the process [2]. In the same way, few parameters are available to attest the benefits of the wet-process sprayed mortar and to subsidize building budgeting, design and execution.
For [4], the wet-process sprayed mortar is still a technology lacking in the compilation of reliable data that attest productivity gains and reduction of losses due to its application. For the mentioned author, the absence of parameters implies the increase of the risk level associated with the technology. It also interferes the decision-making by the construction companies and represses the evolution of the technology.
In addition, studies such as that of [5] considered that technological aspects, such as the material consumption and losses involved in the wet-process sprayed mortar, should be investigated in more detailed scientific studies.
Therefore, there is the importance of studying mortar waste and workforce productivity in the wet-process sprayed mortar coating execution. In addition to completing the functions to be performed by the vertical fences, it also implies representative costs for the building as a whole.
In view of the above, this research aimed to investigate mortar waste and workforce productivity in the execution of internal and external wall coating in the wet-process sprayed mortar.
It should be emphasized that, in this paper, wet-process sprayed mortar was approached at the national level, in line with the high interest from the technical community and the lack of specific studies that consider the characteristics of the Brazilian construction process, since this technology is internationally established.
2. WET-PROCESS SPRAYED MORTAR
The wet-process sprayed mortar uses compressed air to launch the mortar at high speed on a surface. For this, the mortar is transported through a hose and pneumatically projected onto the surface at high speed through the pipe nozzle [6-8]. Compared to the manual application, this technology presents timesaving as one of its main benefits [9].
In this process, the two mortar projection methods available are the pump and the projector by compressed air spray with coupled container. Projectors with attached containers stand out due to their easy operation, lower cost, and faster workforce training, as well as lower risks of clogging and the no need of using special mortars [10].
The wet-process sprayed mortar comprises three main steps: mixing the mortar, transporting it to the application site, and launching the mortar to the substrate. The efficiency of the process occurs when mechanization is present in those steps [11].
The first attempt to implement the system in Brazil dates back to the mid-1970s and occurred specifically in the city of São Paulo. This attempt was not successful in view of the lack of training of the workforce, as well as of the managers responsible for the implementation [12].
Although it is not largely adopted in Brazil [13, 14], in the last years, the use of wet-process sprayed mortar in coatings has been strengthened [5].
At the national level, the technique is still an issue in researches that evaluates its characteristics [15]. In Europe and the USA, technical regulations regarding wet-process sprayed mortar and concrete have been in the scenery since the mid-1990s [16].
The wet-process sprayed mortar potential has been wasted in the construction sites due to the lack of adequacy when implementing such system [12]. In their research [12], verified that the adoption of wet-process sprayed mortar systems has as main obstacles the absence of production technology and the lack of systemic vision towards the process by companies implementing it.
The latterly mentioned author affirms that the success in the application of this technology depends on the quality of the workforce and the correct regulation of the projection equipment, which must be adapted to the coating type being executed.
For [12], the benefits of using wet-process sprayed mortar systems are only achieved with the adoption of coating projects, the adequacy of the logistics in construction sites to receive the technology, and qualification of the workforce.
A study [17] pointed out that factors such as flow at the construction site, the way material is stored, the conformity between the displacements, the potential of the projection equipment, and the exclusive supply of water and energy can imply better productivity rates and reduction of losses in wet-process sprayed mortar systems. The author also states that the thickness of slabs, the number of fittings, and the dimensioning of the projection teams have a direct impact on the final costs of the coating.
3. LOSSES OF MATERIALS AND LABOR PRODUCTIVITY
A classic definition for material losses is presented by a study stating that [18]: “any quantity of material consumed in addition to the quantity theoretically necessary, which is indicated in the projects and their memorials or other executor prescriptions, for the executed product”.
For [19], the broad concept of productivity depends on the production objective of the analyzed system, which is defined as “the degree to which a system achieves a given production objective”, considering it as the efficiency in transforming inputs into outputs for a production process.
Table 1 shows ways to measure the portion of losses and industrialized mortar consumption as well as labor productivity.
| Indicator | Equation | Detailing | Reference |
|---|---|---|---|
| Material Unitary Consumption - CUM | " |
EST (VI) = quantity of material in stock at the verification initial date, measured in kg. EST (VF) = quantity of material in stock at the verification final date, measured in kg. FORN = amount of material received between VI and VF in kg. TRANSF = a mount of material delivered (negative signal) or received (positive signal) between VI and VF. QS = amount of service performed between VI and VF, measured in m2. VI = date for initial verification. VF = date for final verification. As for the cladding with application of the industrialized mortar, the unit consumption is the amount of anhydrous mortar required to execute a cladding of 1m2. |
[18] |
| Percentage of the portion of losses - IP (%) |
 |
CTeo = theoretical consumption, in kg. CTeo = Cref x Qs Cref = reference consumption, in kg/m2. Cref = esp x Cref1cm esp = average thickness of the layer to be coated, in centimeters. Cref1cm = consumption required for execution of 1m2 for a thickness of 1cm (given by manufacturer) |
[18] |
| Production Unitary Relation - RUP |  |
M’hr = Man-hours of team demanded for the job. | [19] |
3.1. Reference Studies for Losses and Productivity of Cladding with the Wet-Process Sprayed Mortar
This topic presents some studies involving percentages of losses and productivity values of cladding executed with this type of constructive technology.
3.1.1. Reference Studies for Losses and Productivity of Wet-Process Sprayed Mortar Coating
The research of [2] identified the difficulties and benefits in the production system of facade coating using the wet-process sprayed mortar and conventional processes. Data of losses and productivity were obtained in two projects. Table 2 presents relevant characteristics of these projects.
| Characterization | Company E | Company V |
|---|---|---|
| Experience with wet-process sprayed mortar systems | First experience | First experience |
| Building Type | 15 floors | 11 building with 4 apartments each |
| Mixer center Location | Last pavement | First floor |
| Equipment Type | Pump | Pump |
| Apparatus Type | Electric rocker | Scaffolding |
| Mortar Type | Industrialized, suitable for projection | Industrialized, suitable for projection |
| Mortar Transport | Load elevator | Manual to the mixer center |
[20] contemplated the analysis of the coating productivity using wet-process sprayed mortar. Table 3 presents the main characteristics found in that study.
| Company | E1 | E2 | ||
|---|---|---|---|---|
| Left Side | Right Side | Rear Facade | Internal Coating | |
| Workforce | Outsourced | Outsourced | Outsourced | Own |
| Number of pavements | 13 | 21 | ||
| Relation janitor: manson |
4:3 | 7:1 | 3:1 | 15:3 |
| RUPmason (Mh/m2) | 0.43 a 1.44 | 0.52 a 1.17 | 0.60 a 0.76 | 0.61 a 0.62 |
| Mortar type | Industrialized | Industrialized | Industrialized | Industrialized |
| Application method | Projected | Projected | Projected | Projected |
| Mix equipment | Projection machine | Projection machine | Projection machine | Mortar mixer |
| Mix location | On pavement | On pavement | On pavement | - |
| Transport equipment | Rack | Rack and rocker | Rack | - |
The third study deals with the research carried out by [21], in a development with 21 floors. In order to measure the losses of processed mortar, the author took into account the balance between the theoretical quantity and the actual quantity of processed mortar bags consumed, including the average thickness of the coated surface.
[22]'s research on the productivity of the workforce for the execution of mortar coating involved 14 cases from various regions of Brazil. From the total, 10 were related to the wet-process sprayed mortar system. Cases 1, 2, 3, and 4 were characterized by high thicknesses (varying from 3 to 8 centimeters) in the coating layer, while in cases 5, 6, and 7 the projection was applied on structural masonry, with thicknesses lower than 2 cm and presenting an extensive area per construction worker. Cases 12, 13, and 14 refer to the projection in internal areas, whose thickness did not exceed 2 cm.
The set of favorable situations evidenced by [22] for the execution of the external coating included: adoption of a projection plane before the beginning of the task, management focused on the production per floor, thicknesses less than 3 cm, use of precast windows, few corners. On the other hand, the unfavorable situations were: execution of framings after the plaster application and independent production, that is, one rocker per floor.
3.1.2. Reference Values for Losses
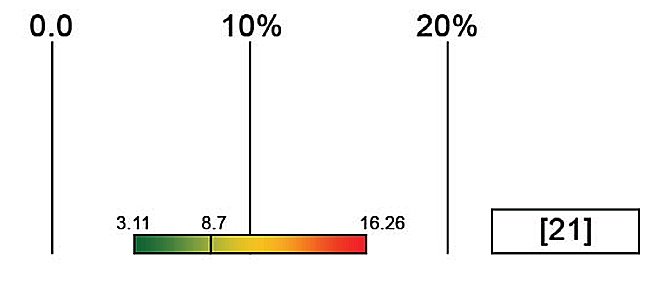
According to research by [21], it was possible to indicate reference values for losses of industrialized mortar applied in internal areas using the wet-process sprayed mortar. Fig. (1) shows the minimum, average, and maximum values obtained by [21].
According to projects evaluated by [2], the losses of industrialized mortar in external cladding ranged from 5.17% to 32.82%, as shown in the Fig. (2).

3.1.3. Reference values for Productivity
Based on the researches by [20] and [22], reference values for labor productivity were gathered in the execution of the wet-process sprayed mortar in internal cladding, as shown in Fig. (3).

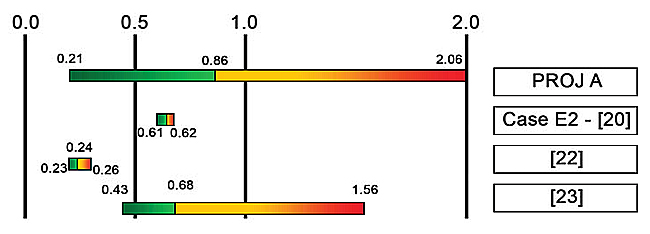
According to Fig. (3), the productivity values evidenced by [22] were better than those obtained by [20] in case E2. While [22] observed variations from 0.23 to 0.26 M’hr/m2, with an average of 33 m2/day/man [20], observed variations around 0.62M’hr/m2 or 12.9 m2/day/man.
Fig. (4) represents the reference values for the productivity of cladding execution in external areas, according to the research studies [2], [20] and [22], indicating the minimum, average, and maximum values obtained in their case studies, including the range established by TCPO 14 [23].
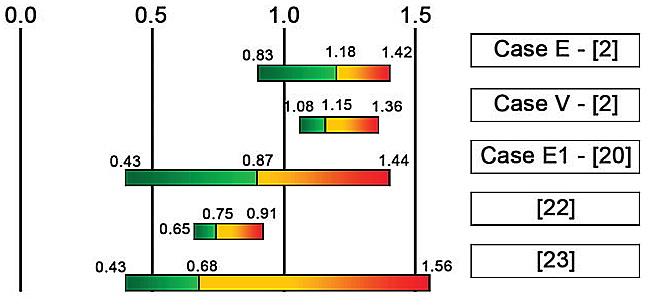
According to the values shown in Fig. (4), the productivity shown by [2] in Case E, with a variation from 0.88 to 1.42 M’hr/m2 [20], in Case E1, with a variation from 0.43 to 1.44 M’hr/m2, and [22], with a variation from 0.65 to 0.91 M’hr/m2 are consistent with the range of values established by TCPO 14 [23].
4. FIELD RESEARCH METHODOLOGY
The methodology for conducting field research is illustrated in Fig. (5).
4.1. Definition of Data Collection Method
Regarding the choice of the data collection method, it was decided to adopt the six booklets of indicators from the Performance Indicators Program (PROGRIDE), for the constructive technology of cladding with wet-process sprayed mortar, developed by the Construction Community, under the leadership of the Brazilian Portland Cement Association (ABCP).
The first booklet takes an approach to the enterprise characterization.
The second booklet is intended to characterize the construction company.
The third one deals with the losses of the industrialized mortar in three parts: input characterization, real consumption calculation, and a survey of the quantity of service executed and calculation of the consumption and loss indicators.
The fourth booklet refers to the workforce productivity for the mortar cladding service, both for internal and external areas.
The fifth booklet deals with the record of the abnormalities that somehow prevented the production team from working.
The sixth booklet presents, summarily, the results from the indicators of loss, consumption, and RUP for masons and servants.
The methodology adopted by the mentioned notebooks to survey the indices of losses, consumption, and productivity is the same one presented in Table 1.
4.2. Periodicity of Collections
As for the periodicity of collections, as the authors agreed, considering also the available resources and the experience of PROGRIDE, the technical visit in the studied projects for effective data collection in loco was carried out following a weekly cycle of activities.
4.3. Selection of Companies Using Wet-Process Sprayed Mortar System
Finally, the search for companies to compose the set of case studies of this research began with the Construction Community of the city of Recife, in the state of Pernambuco, in its 6th Cycle, throughout the activities related to the Mechanization Systems of Cladding. The objective of the search was to find projects in the internal and/or external cladding phase, using the wet-process sprayed mortar.
The present research involved the participation of seven construction companies and the presentation of case studies in eight projects, in cladding phase by wet-process sprayed mortar. Codes were assigned by letters to identify the projects analyzed, and numbers to identify the companies involved. Table 4 shows which indicators were collected per projects.
| Companies | 1 | 2 | 3 | 4 | 5 | 6 | 7 | |
|---|---|---|---|---|---|---|---|---|
| Index | PROJ A | PROJ B | PROJ C | PROJ D | PROJ E | PROJ F | PROJ G | PROJ H |
| Loss | Yes | No | No | No | Yes | Yes | Yes | Yes |
| Productivity | Yes | Yes | Yes | Yes | Yes | Yes | Yes | Yes |
In projects B and C, belonging to the same construction company, it was not possible to follow-up the loss portion, and only the results for productivity were presented. In D, due to the use of mortar dosed at the construction site, the loss indexes were not followed-up either.
5. CASE STUDIES
The case studies followed these steps: project characterization; company characterization; field data collection (determination of mortar consumption and cladding layer thickness, quantification of the area, quantification of man-hours, and recording of abnormalities occurred in the period); data compilation; data processing.
The field data collection followed the methodology presented on the booklets of indicators. The data obtained at the construction site were arranged in spreadsheets to generate the loss, consumption, and RUP indicators.
In work E, material unitary consumption was determined by recording the quantity of bags added to the mixer for the preparation of the mortar to be designed by the pump. Interns or technicians did this registration, as part of the material control procedure. This decision was made because the same mortar used in the projection equipment was also used for other services, such as manual cladding of mortar in internal areas and masonry elevation, since the material had technical qualifications for those services, according to the provider’s specification. Thus, if the equation for material unitary consumption Table 1 were applied, the consumption and loss data would not reflect the construction site reality.
The data treatment included the use of two position measures - arithmetic mean and median - and two dispersion measures - standard deviation and coefficient of variation. In addition to that, it also included data representation through box plot graphs, which made it possible to visualize the maximum and minimum values as well as to evaluate data symmetry and dispersion, forming an important tool for this research conclusions.
5.1. Company Characterization
The companies’ characterization occurred through an interview with the engineer responsible for the projects.
The studied construction companies work on the incorporation and construction of buildings and residential works for private clients. All companies have developed at least one improvement project, among which workplace safety and ISO 9001 are common to all.
5.2. Project Characterization
The project characterization was carried out based on of the first PROGRIDE booklet, with results presented in Table 5.
| Items for Characterization of Project (PROJ) | Company 01 | Company 02 | Company 03 | Company 04 | Company 05 | Company 06 | Company 07 | |
|---|---|---|---|---|---|---|---|---|
| PROJ A | PROJ B | PROJ C | PROJ D | PROJ E | PROJ F | PROJ G | PROJ H | |
| 1. Enterprise type | Residential | Residential | Residential | Residential | Residential | Residential | Residential | Commercial |
| 2. Enterprise standard | High | High | High | High | Medium | High | High | Medium |
| 3. Duration of project | ||||||||
| Beginning | 03/2012 | 04/2012 | 04/2012 | 01/2012 | 12/2013 | 06/2012 | 10/2013 | 12/2014 |
| Completion prediction | 04/2015 | 09/2014 | 09/2014 | 07/2014 | 12/2015 | 12/2015 | 02/2017 | 05/2016 |
| 4. Technical data from projects | ||||||||
| Number of towers | 1 | 1 | 1 | 1 | 1 | 1 | 9 | 3 |
| Number of pavements | 15 | 21 | 21 | 26 | 25 | 30 | 4 | 3 |
| Number of units | 60 | 126 | 126 | 96 | 240 | 84 | 180 | 13 |
| 5. Adopted typologies | ||||||||
| Structure | Reinforced with ribbed slab | Reinforced | Reinforced | Reinforced with ribbed slab | Reinforced with massive slab | Reinforced with ribbed slab | Reinforced with massive slab | Reinforced with ribbed slab |
| Fencing | Ceramic block | Ceramic block | Ceramic block | Ceramic block | Ceramic block | Ceramic brick | Ceramic brick | Concrete block |
| External cladding | Plaster, ceramics and granite | Plaster and ceramics | Plaster and ceramics | Plaster | Plaster | Plaster | Plaster (single paste for painting) | Plaster |
5.3. Wet-Process Sprayed Mortar Characterization
Based on the mortar mixing, transport, and projection stages, the authors gathered the main information from the construction sites to characterize the projects mechanical projection system, as it can be observed in Table 6.
| Characteristics | Projects (PROJ) | |||||||||
|---|---|---|---|---|---|---|---|---|---|---|
| A | B | C | D | E | F | G | H | |||
| Masons’ Experience on Wet-Process Sprayed Mortar | Familiar with the technique | Familiar with the technique | Familiar with the technique | Familiar with the technique | First experience | First experience | First experience | Familiar with the technique | ||
| Manpower Type | Subcontracted | Subcontracted | Subcontracted | Self-employed | Self-employed | Mixed | Self-employed | Subcontracted | ||
| Helper/Mason Relation | 1:2 | 1:2 | 1:3 | 1:1 | 4:5 | 1:1 | 3:5 | 1:1 | ||
| Used System | Portable system | Portable system | Portable system | Fixed central mixer | Portable system | Portable system | Fixed central mixer | Fixed central mixer | ||
| Central Mixer Location | Pavement floor | Pavement floor | Pavement floor | Ground floor | Pavement floor | Pavement floor | Ground floor | Ground floor | ||
| Plaster | Mortar Type | Bagged industrialized | Bagged industrialized | Bagged industrialized | Produced at the project | Bagged industrialized | Bagged industrialized | Bagged industrialized | Bagged industrialized | |
| Application Area | Internal | External | External | External | External | External | External | External | ||
| Apparatus | - | Scaffolding | Scaffolding | Scaffolding | Scaffolding | Scaffolding | Scaffolding | Scaffolding | ||
| Average Thickness (cm) | 0.7 – 1.0 | 4.0 – 6.0 | 4.0 – 6.0 | 4.0 – 6.0 | 4.0 – 5.0 | 4.0 – 6.0 | 4.0 – 6.5 | 4.0 – 5.0 | ||
| Equipaments | Mortar Mixture | Mixer | Mixer | Mixer | Concrete mixer | Mixer | Mixer | Mixer | Mixer | |
| Mortar Transport | Stock Up to Mixture | Manual | Manual | Manual | Manual, in bulk | Manual | Manual | Manual | Manual | |
| Mixer to Bomb | Direct release, commanded by masons |
Direct release, commanded by masons |
Direct release, commanded by masons |
Manual, via winch |
Direct release, commanded by masons |
Direct release, commanded by masons |
Direct release, commanded by masons |
Direct release, commanded by masons |
||
| Bomb to Substrate | Hose mechanized | Hose mechanized | Hose mechanized | Container mechanized | Hose mechanized | Hose mechanized | Hose mechanized | Hose mechanized | ||
| Type of Equipment Projection | Bomb | Bomb | Bomb | Jet mortar sprayer | Bomb | Bomb | Bomb | Bomb | ||
According to technical visits to the projects, construction companies predominantly adopted the portable system with bagged material as projection system. In this system, the mixer and pump are located on the projection floor.
5.3.1. Mortar Supply and Packaging
In all of the analyzed projects, except for D, the projection mortar was bagged and palletized or stacked on wooden platforms, with the indication for mechanical application.
5.3.2. Mortar Mixing and Transport
In works A, B, C, E and F, the mortar was dry and transported to the vicinity of the mixing plant, from the tank where it was wrapped up . This route involved the use of equipment such as pallet carriage, for horizontal transport, and a winch, for vertical transportation. In G and H works, the bagged mortar was transferred from the bagging tank to the mixer, by only horizontal transport, using the skytrack, or telescopic handler.
For the mortar mixing, all projects used mixer equipment, in which the operator performed the water/dry material ratio, according to the production requirement. After that, the fresh mortar is thrown directly into the chamber of the projection equipment.
5.3.3. Projection
Only in the construction work D, the projection counted on the use of the coupled container method and in the other works analyzed, the wet-process sprayed mortar system was performed through the use of a projection pump.
Projects G e H used scaffolding, with the time required for assembly and disassembly influences the production team productivity. However, such apparatus type can contribute for the simultaneous execution of several stretches along the facade.
5.4. Presentation and Analysis of Loss and Productivity Indicators
Table 7 shows results of industrialized mortar loss indicators, mortar unitary consumption, and the RUP weekly, cumulative, and potential values in analyzed projects.
| Company | Company 1 | Company 2 | Company 3 | Company 4 | Company 5 | Company 6 | Company 7 | |
|---|---|---|---|---|---|---|---|---|
| Project | A | B | C | D | E | F | G | H |
| Plaster | Internal | External | External | External | External | External | External | External |
| Adjustments and corners execution | Yes | Yes | Yes | Yes | Yes | Yes | Yes | Yes |
| Analyzed periods (weeks) | 17 | 6 | 3 | 4 | 3 | 3 | 4 | 5 |
| Industrialized mortar loss (%) | ||||||||
| Minimum | 27.93 | NC | NC | NC | 7.04 | 28.85 | 6.38 | 13.13 |
| Average | 81.23 | NC | NC | NC | 13.9 | 41.82 | 56.4 | 17.49 |
| Maximum | 150.02 | NC | NC | NC | 23.93 | 58.74 | 148.94 | 26.53 |
| Median | 71.32 | NC | NC | NC | 10.73 | 37.87 | 35.14 | 15.53 |
| Standard deviation | 39.96 | - | - | - | 8.88 | 15.33 | 67.16 | 5.24 |
| Variation coefficient | 45% | - | - | - | 63% | 36% | 119% | 30% |
| Unitary consumption of industrialized mortar loss (Kg/m2) | ||||||||
| Minimum | 15.29 | NC | NC | NC | 65.88 | 87.47 | 54.25 | 36.54 |
| Average | 23.68 | NC | NC | NC | 74.31 | 96.27 | 93.60 | 59.43 |
| Maximum | 33.95 | NC | NC | NC | 84.27 | 107.75 | 139.65 | 80.53 |
| Median | 23.25 | NC | NC | NC | 72.79 | 93.60 | 90.26 | 58.73 |
| Standard deviation | 5.43 | - | - | - | 9.2 | 10.42 | 38.91 | 15.65 |
| Variation coefficient | 21% | - | - | - | 12% | 10% | 41% | 26% |
| Productivity – Weekly RUPmason (M’hr/m2) | ||||||||
| Minimum | 0.21 | 0.18 | 0.23 | 0.43 | 0.59 | 0.70 | 1.04 | 0.46 |
| Average | 0.86 | 0.26 | 0.42 | 0.71 | 0.98 | 1.44 | 2.49 | 0.67 |
| Maximum | 2.06 | 0.34 | 0.75 | 1.17 | 1.60 | 1.81 | 5.91 | 0.82 |
| Median | 0.69 | 0.27 | 0.42 | 0.61 | 0.76 | 1.8 | 1.51 | 0.71 |
| Standard deviation | 0.51 | - | - | 0.32 | 0.54 | 0.63 | 2.29 | 0.13 |
| Variation coefficient | 48% | - | - | 46% | 54% | 44% | 91% | 20% |
| Productivity – Cumulative RUPmason (M’hr/m2) | ||||||||
| Minimum | 0.41 | 0.18 | 0.23 | 0.47 | 0.59 | 0.70 | 1.57 | 0.62 |
| Average | 0.51 | 0.22 | 0.42 | 0.55 | 0.66 | 1.24 | 2.89 | 0.70 |
| Maximum | 0.58 | 0.25 | 0.49 | 0.61 | 0.82 | 1.56 | 5.91 | 0.82 |
| Median | 0.51 | 0.24 | 0.42 | 0.55 | 0.66 | 1.45 | 2.04 | 0.69 |
| Potential RUPmason (M’hr/m2) | 0.37 | 0.18 | 0.32 | 0.43 | 0.67 | 0.70 | 1.20 | 0.46 |
5.4.1. Analysis of Industrialized Mortar Losses in Internal Cladding
As Table 6 shows, project A was the only one in this research with wet-process sprayed mortar cladding in internal areas. Fig. (6) represents the box plot of loss values.
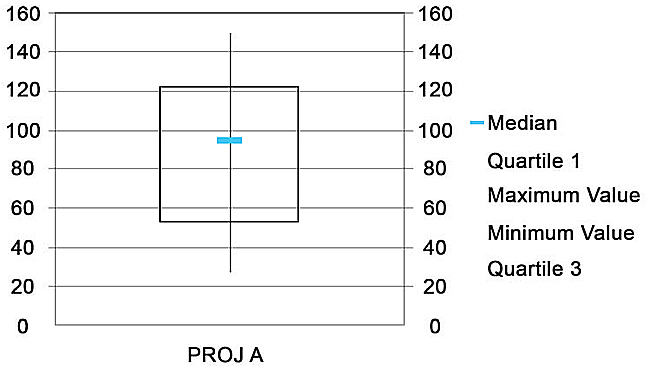
Considering a coefficient of variation equivalent to 45%, the loss data collected in project A constitute a distribution classified as high dispersion, being higher than 30%, with values varying from 27.93% to 150.02%. From the Box Plot presented, 50% of the loss index for project A was between 53.26% and 122.29% (quartile 1 and quartile 3, respectively).

As it can be observed in Fig. (7), the loss values for A were higher than those found by [21], which varied from 3.11% to 16.26%, taking into account that they are projects with the same production system and that the mortar application occurred in internal areas. As most loss values for project A were higher than 53%, with an average of 81.23%, it can be considered that the industrialized mortar losses in this project were high.
5.4.2. Analysis of Industrialized Mortar Losses in External Cladding
Fig. (8) shows box plot graphs of projects E, F, G, and H, characterized by the wet-process sprayed mortar in internal area claddings.
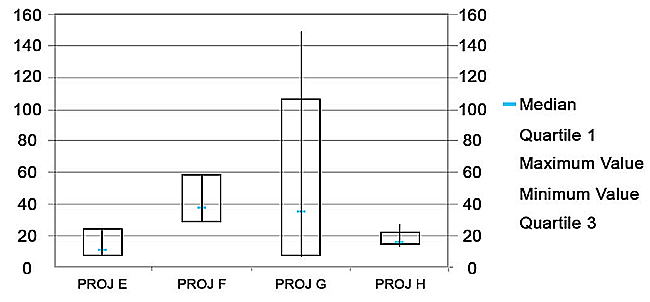
The distribution of the losses data collected in project E presented a variation coefficient of 63%, classified as high dispersion, with values varying from 7.04% (quartile 1) to 23.93% (quartile 3), as the box plot shows. These values were obtained in a period in which the wet-process sprayed mortar was already consolidated in the company.
In project F, the collected data distribution resulted in a variation coefficient of 36%, indicating a high dispersion, with values varying from 28.85% to 58.74%, equivalent to quartile 1 and quartile 3, respectively, according to the box plot.
The data collected in G presented a variation coefficient equivalent to 119%, indicating a high dispersion, with losses varying from 6.38% to 148.4%. According to the box plot analysis, half of the data is between 6.38% and 106.02%. Among the factors that may have influenced these indexes, it was noticed the low consistency presented by the mortar used in the projection and by several stretches with reference levels, indicating a thickness above 4cm, considered as high.
In project H, the loss values ranged from 13.13% to 26.53%, presenting a variation coefficient of 30%, setting up average data dispersion. From the box plot, 50% of the values are comprised between 14.14% and 21.82%. The results were satisfactory to the construction site management that applied wet-process sprayed mortar for the first time.
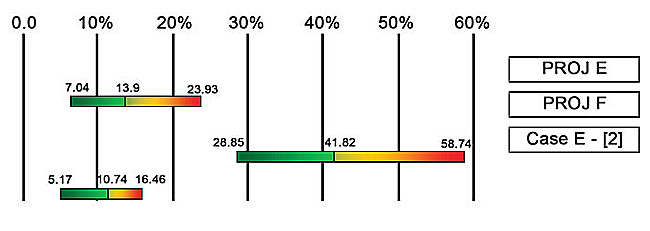
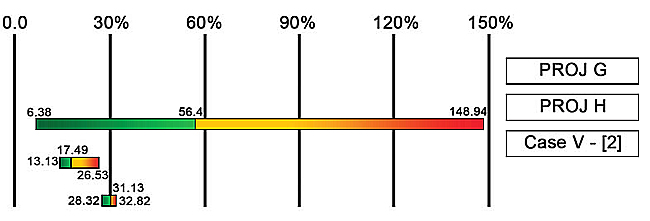
Regarding the reference values identified in the literature, the loss results in E and F can be compared to case E from the research of [2], since they present similar mechanization system characteristics, in the same way as G and H can be compared with case V from [2].
According to Fig. (9), the average loss value in work E is close to the value found by [2] in case E. The losses found in F were higher than the results of [2].
Fig. (10) shows variations in projects G and H as well as in case V of [2]. Based on the data presented in this graph, it can be seen that project G presents both the lowest and the highest loss index, and that project H presents the best loss result, considering the average value of all averages presented.
5.4.3. Analysis of Labor Productivity in Internal Claddings
Fig. (11) shows a box plot of masons’ productivity values in M’hr/m2 from project A.
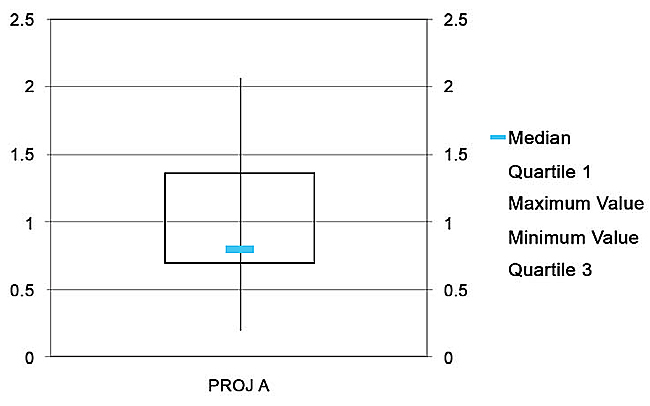
According to the analysis in the graph above, the weekly productivity index for project A ranged from 0.21M’hr/m2 to 2.06M’hr/m2 with a variation coefficient of 48%, indicating a high data dispersion, with half of these values concentrated in a range from 0.7M’hr/m2 to 1.36M’hr/m2. Among the factors that favored the team’s productivity, it is possible to highlight: workmanship with experience in wet-process sprayed mortar, average thickness of the cladding layer ranging from 0.7cm to 1.0cm, and application in internal areas.
Since project A was characterized by performing an inner cladding using a portable system, the RUP results can be compared with case E2 values found by [20] and the values obtained by [22], for internal cladding.
Comparing, according to Fig. (12), A’s productivity values and the values obtained in [20] and [22] surveys, for internal cladding, it is noted that the RUP mean and maximum values in project A are higher than the results found by those authors.
5.4.4. Analysis of Labor Productivity in External Claddings
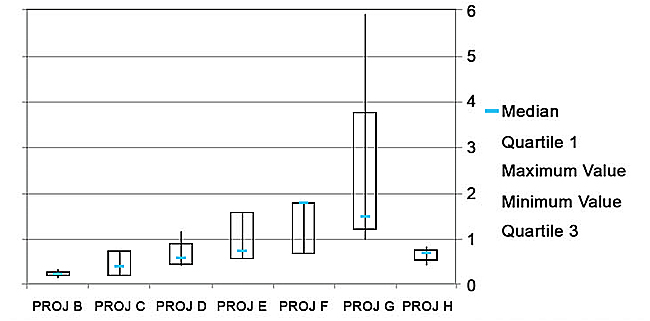
Fig. (13) indicates box plots for the analyzed projects with mortar cladding in external areas.
As projects B and C belong to the same construction company, the implementation of the projection system occurred in the same period with the goal of executing the cladding in only two panels of a facade in each work.
In B, the productivity variation was between 0.18 M’hr/m2 and 0.34 M’hr/m2, with half of these values concentrated in the range of 0.21 M’hr/m2 to 0.3 M’hr/m2. In project C, the productivity variation was from 0.23 M’hr /m2 to 0.75 M’hr /m2. In those cases, the predominant workforce knew how to execute the wet-process sprayed mortar and the thickness of the cladding layer averaged 4cm to 6cm. Those two facts were an advantage for the productivity.
Project D presented a productivity variation of 0.43 M’hr/m2 to 1.17 M’hr/m2 with a variation coefficient of 46%, indicating a high data dispersion, with half of these values concentrated in the range of 0.48 M’hr/m2 to 0.93 M’hr/m2.
The productivity variation in project E was from 0.59 Hm/m2 to 1.60 Hm/m2, with a variation coefficient of around 54%, setting a high dispersion in the obtained data. During the collection phase, the following abnormalities were recorded: projection equipment breakage, hose clogging, delays in the transport of bagged material to the projection pavement, and demotivation by the masons in continuing to work with the system due to the problems mentioned.
The productivity data collected in the project F ranged from 0.7 M’hr/m2 to 1.81M’hr/m2 with a variation coefficient of 44%, indicating high data dispersion. Factors such as labor turnover, equipment breakdown, and team demotivation influenced the low productivity indexes in F.
In G, the registered productivity varied from 1.04M’hr/m2 to 5.91M’hr/m2 with a variation coefficient of 91%, indicating a high dispersion in the obtained data. The RUP values recorded in G indicate a low productivity for a team composed by 5 masons and 3 helpers. The factors identified as influential in production were: a great deal of adjustments and corners, the mortar consistency, equipment breaks, hose clogging, and the team's lack of motivation because of the low productivity.
In project H, the productivity of the production team varied from 0.46 M’hr/m2 to 0.82 M’hr/m2 with a variation coefficient of 20%, that is, presenting data with average dispersion and half of the values in the range of 0.54M’hr/m2 to 0.78M’hr/m2. The team that performed the service was subcontracted and knew the projection technique, which favored to reach a good productivity. The RUP values were satisfactory for the construction site management. Briefly, the factors influencing productivity were: geometric characteristics of the area with few corners and adjustments, workmanship with experience in the wet-process sprayed mortar, and the use of a scaffolding, which favored masons movement along the stretch in execution.
The following works were compared: the productivity data obtained in projects B, C, D, E, F with the values found by [2] for case E [20], for Case E1 [22], and TCPO 14 [23]. Fig. (14) indicates the minimum, average and maximum results of the analyzed works together with the values found in the literature.
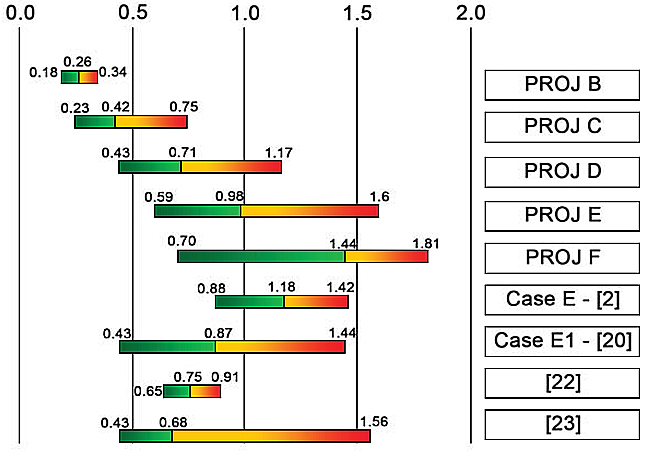
According to Fig. (14), the result variations in B and C constitute the best productivity results among the analyzed ones. The results of D are consistent with the variations obtained in case E1 of [20] and [22]. The projects E and F presented minimum values consistent with the reference studies, but the maximum RUP values are higher than those predicted by [20] and [22]. Considering the average productivity value obtained, these are within the reality of the reference studies and TCPO 14 [23].
Project G and H were characterized by the execution of an external area cladding, using the system with a fixed mixer station located on the ground floor and a scaffolding. Because of that, they can be compared with the results of case V in [2]. Fig. (15) shows the productivity variations in G, H and case V of [2], including the range of values established by TCPO 14 [11].
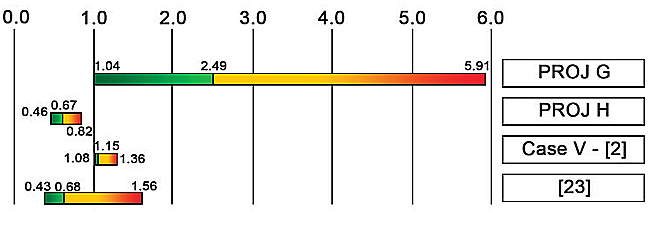
According to Fig. (15), project H obtained productivity values higher than case V in [2], since the maximum RUP value in H is lower than the minimum value of RUP in [2]. The minimum RUP value in G is consistent with the results of [2], but presents the average and maximum values outside the reality found in project H and case V in [2]. Regarding the values established by TCPO 14 [23], H presents coherent variations while G presents discrepant variations.
5.5. Identification of the Best Practices
The best practices presented were observed in the system operation phase and refer to actions taken by the production team, in agreement with the management, seeking process improvement.
The best productivity was verified in project B, with a value of 0.18M’hr/m2, equivalent to 44 m2/day/man. Two factors favored the projection efficiency in this project: the masons involved had experience with this technology and the executed facade stretch was simple with a small area.
The worst result of productivity was evidenced in G, where the RUP was 5.91M’hr/m2, that is, 1.35 m2/day/man. A peculiar characteristic of this project was the execution of the corners as well as window and door adjustments with mortar dosed in the construction site. The masons projected the facade area with industrialized mortar and then returned executing the adjustments and corners with mortar dosed in the construction site.
In relation to projects as a whole, E did not present prominence referring to the consumption, loss, and productivity indexes, but it was observed that some actions could be highlighted among the best practices, since they contribute to minimize waste volume generated by the system, optimize the adjustment execution, and use of water rationally in the hose cleaning, also avoiding the waste on the pavement.
One practice observed in project E was the mortar packing as it is released from the hose, when the pump was switched off, in containers for later use. This material was commonly reused either in the projection or execution of cladding finishing itself. With this practice, residues from the system were minimized. Fig. (16) shows a worker directing the mortar into a container after turning the equipment off.
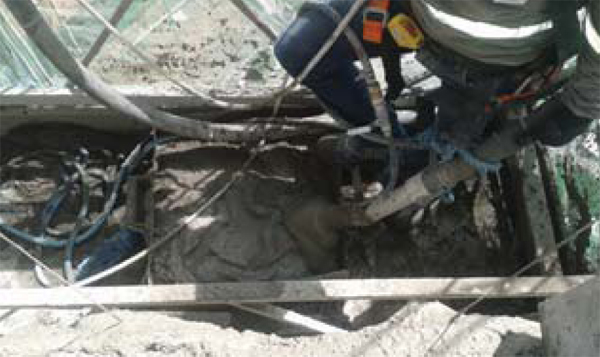
Still in project E, it was observed that the masons made the mortar application first in the contours of the adjustments and later in the other facade areas. With this practice, the involved masons were able to optimize the time in the execution of cladding surface and window adjustments, since they require a longer time to finish.
With respect to the wastes generated during the equipment cleaning, these were packed in containers, as shown in Fig. (17). This material was rested until the solid part decanted and then went to segregation, in which the liquid part of the mixture was reused to clean the hose and the solid part was bagged and transported to the ground floor in a suitable location, awaiting final disposal. This practice has implications for the rational use of water, in the act of cleaning, and minimizes the spreading of material in the work area, but it still causes loss. This is an aspect that deserves attention regarding waste management.
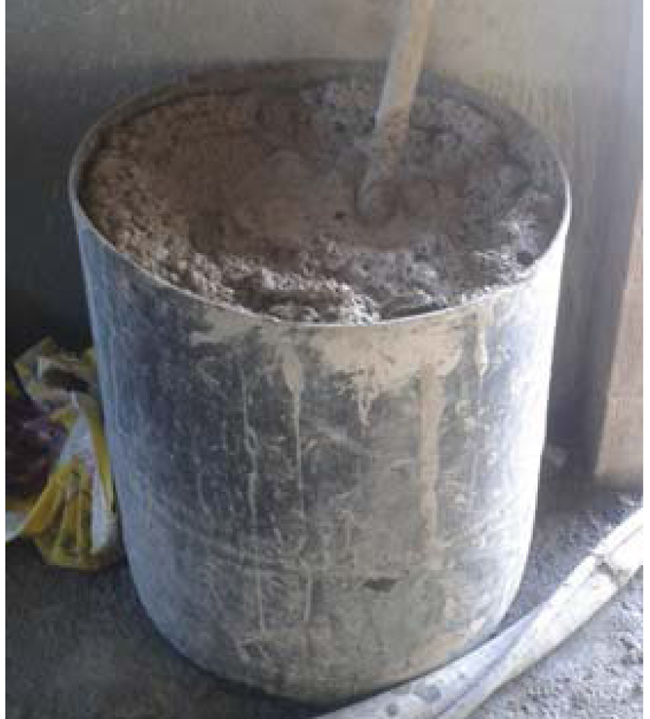
Given the practices observed in the construction sites, Table 8 brings together some actions that can collaborate to make the portable system more efficient.
| The Best Practices Identified | Benefits |
|---|---|
| Using of return mortar from the hose. | Reduction of waste from the system. |
| Prioritizing the application in the adjustments. | Optimization of the mortar application time in the substrate. |
| Using mortar with a dosage compatible with the projection equipment (stator-rotor). | Avoiding excessive wear on the stator-rotor set and minimizing the chances of hose clogging. |
| Packaging hose-returned waste in cylinders or tanks for later disposal in a suitable place. | Avoiding throwing mortar waste along the pavement. |
5.6. Identification of Opportunities for Improvements in Production Management
The opportunities for improvement indicated in this paper result from observations during the technical visits carried out at the construction site and from the maximum values of consumption, losses and productivity. For this propose, the main problems in the portable system operation phase were identified, acting in the steps of bagged material transport to the central mixer, including the packaging, mixing, and application of the final product.
As mentioned in the previous item, the project G presented the highest consumption of industrialized mortar and the worst productivity of all studied projects. In this same work, which used industrialized mortar specifically for projection, the mixture had a low consistency and, when applied to the wall, it took longer to reach the point for twisting.
If the mortar mixture presents low consistency, it may influence the index for losses and team’s productivity, as in G, in which it was recorded the higher industrialized mortar consumption indicators as well as the higher RUP.
The amount of mortar produced must be compatible with the masons’ productivity while they are executing the masonry, otherwise, there will be a large volume of idle material on the equipment camera and in the hose. Besides, depending on the mortar properties, those conditions can cause hose clogging.
In all the projects that had the pump system analyzed, problems in hose clogging were found; that can be considered as an influencing factor in the team’s productivity. There are different causes that can lead to this type of problem, such as the time when this accessory is inactive and filled with mortar without performing the necessary cleanings, resulting in failures in the system use.
In the transport stage, the first problem identified in the system was related to bagged material distribution and control along the floors, mainly due to the non-collection of the materials after the end of the activity, besides the losses along the route to the central mixer. The mortar transport stage was not the target of data collection, but the reported problems are potential factors influencing the losses of the projection system and are situations that require improvement actions.
Another evidenced problem was the bagged material use for the execution of other services in the project, as in E. Masons from other services carried out this action, without informing the project administration.
Given the discussion above, it is evident that there are problems related to the mortar transport, mixing and projection phases, mainly due to the lack of procedures to operate the system and action plans along with corrective measures to minimize the failures.
Table 9 presents the main steps of the wet-process sprayed mortar with bagged material and the respective problems identified in the analyzed construction sites.
| Steps | Identified Issues |
|---|---|
| Transport to the central mixer. | Bagged material loss. Bagged material not picked-up after the end of the service in the pavement. |
| Conditioning close to the central mixer. | Using the bagged material in other services. |
| Mortar mixture. | Final mixing consistency unsuitable for projection. Produced volume higher than demand. |
| Mortar application. | Clogging (hose). Deregulated output pressure (possibility). |
Therefore, based on the observations of the production system in the analyzed projects, this research presents some measures that can be followed in the system implantation phase, to collaborate with the process efficiency:
- Testing the mortar dosage with the equipment specifications;
- Checking the compatibility between the mortar composition and the stator-rotor set, for the case of helical pumps;
- Checking the packaging of bagged material near the mixer, in order to avoid loss and use in other services;
- Checking the mortar preparation so that the resulting mixture is in adequate conditions for pumping;
- Planning the mortar application sequence to avoid team idleness;
- Using motorized rocker arms to facilitate the team movement along the facade, when necessary;
- At the end of the projection activity on the pavement, carrying the bagged material that was not used to the place of the next application or to the initial packaging.
Those actions aim to optimize the use of resources in the projection activity, collaborating to reduce the loss index and favoring the productivity of the team involved in the service.
CONCLUSION
Although the wet-process sprayed mortar system presents itself as an innovative alternative in the execution of the coatings, according to the performed analyzes in the construction works investigated in this research, it still presents difficulties both in the implantation phase and in the operation phase.
In addition to the scientific contribution, this research brings a practical contribution in answering a specific demand regarding the technical and economic viability of the wet-process sprayed mortar system. The results obtained and the carried out analyzes are in line with the interest of companies in the use of this technology. Despite contributing to the greater industrialization of the civil construction sector, the technology is not widespread yet.
In addition, the tools used to measure losses and productivity, as well as the proposed indicators, are also important contributions of the research, since they support the identification of losses and the increase of workforce productivity and subsidize improvements in the wet-process sprayed mortar system applied to coatings.
CONSENT FOR PUBLICATION
Not applicable.
CONFLICT OF INTEREST
The authors declare no conflict of interest, financial or otherwise.
ACKNOWLEDGEMENTS
Decleared none.

