All published articles of this journal are available on ScienceDirect.
Finite Element Simulations on the Tensile Resistance of Bolted End-Plate Connections with Tubular Members
Abstract
Background:
Bolted end-plate connections represent the simplest and cheapest way to connect tubular members. EN1993:1-8 provides the general rules based on component method. However, in the case of splices with tubular members the proper definition of the effective length around corner bolts is not clearly addressed.
Objective:
The objective of the study is to investigate the accuracy and the effectiveness of the existing analytical predictions to estimate the tensile resistance of end-plate connections with tubular members where corner bolts are adopted.
Method:
Parametric finite element analyses were carried out to investigate the tensile strength of connections of both square and rectangular hollow sections.
Results:
The tension resistance is largely influenced by the corner bolts. Indeed, the connections with corner bolts exhibit larger resistance that increases when the bolts are closer to the corner of the tubular member. However, reducing the distance between the bolt and the wall of the tubular section can affect the splice ductility.
Conclusion:
• The method proposed Steige and Weynand to calculate the tension resistance of connections with bolts distributed on all sides of the splice is consistent with EN 1993-1-8.
• The finite element simulations showed that the corner bolts can increase the resistance of the connection. In addition, the bolt layout can be optimised by placing the bolts as close to the hollow section as possible.
1. INTRODUCTION
Tubular members with either rectangular or square hollow sections (i.e RHS and SHS) are widely used in the steel buildings, especially in the case of valuable examples of architecture. Bolted end-plate connections represent the sim- plest and cheapest way to connect tubular members. EN1993:1-8 provides the general rules based on component method to compute analytically the axial tensile strength of end-plate connections. However, in the case of splices with tubular members the proper definition of the effective length around corner bolts is not clearly addressed. This aspect can induce either misinterpretation or miscalculation of those types of connections.
The design procedure presented by [1-5] does not give practical and easy design approach with a safety correlations between experimental and analytical ultimate strength values. The six failure mechanisms postulated by Packer et al. [1] are applicable only in case of end-plate connection with two bolts per side. Aalberg and Karslen [6] showed that the T-Stub model in EN 1993-1-8 [7] can be used for this type of connection under the following assumptions: the bolts should be positioned within the width/depth of the RHS dimension and be in the same position on both sides of the connection. Wheeler et al. [2] presented a model based on a modified T-stub analogy, which incorporates the effect of bolt prying forces. This model is limited to square and rectangular sections with two bolt rows, one above the top flange and the other below the bottom flange. Some years later, they proposed a more refined and complex “Cumulative modified T-stub model” [3]. Willibald [4] proposed a two dimensional yield line model that involves rather complicated formu- las. All these procedures involve very difficult calculations and methods that are not according to EN1993-1-8.
A comprehensive and consistent study on the characterization of effective length for corner bolts in circular tube-to-circular tube connection was carried out by Hoang et al. [8], which proposed accurate EC3-compliant formulations but, unfortunately, not directly applicable to the case of tension splices among rectangular or square hollow profiles.
Hence, at the current stage, in the Authors’ best knowledge, an easy design procedure that covers all the possible geometries and bolts layout for tube-to-tube connections is not yet available.
In order to investigate the accuracy and the effectiveness of the existing analytical predictions, a parametric finite element study is presented and discussed hereinafter. In particular, the study concentrates on tensile strength of connections of both square and rectangular hollow sections with bolts on two or four sides. Two types of welds between the tubular members and the end-plate are considered: the fillet weld and the full penetration weld. Fig. (1) shows the geometrical parameters of the examined bolted end-plate connections.
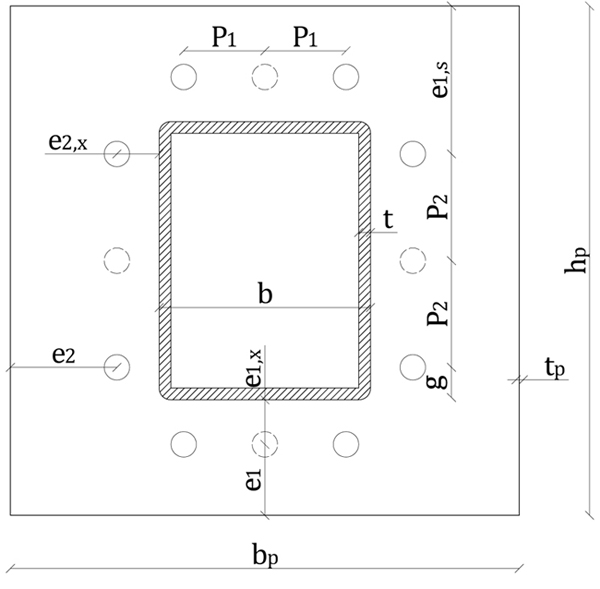
The paper is organized into two main parts, as follows: i) the first part describes the available theoretical methods and the comparison between the resistance analytically calculated and the results of some experimental tests available in thefrom literature; ii) the finite element simulations are presented and discussed in the second part. In the light of both analytical and numerical results conclusive remarks are drawn.
2. ANALYITICAL STUDY
2.1. Component Method
The EC3-compliant component method schematizes the joint as a mechanical systems made of elementary components that are characterized by an elastic-plastic force-deformation response curve. The calculation procedure can be summarized in three main steps:
- Component identification: Determination of contributing components in compression, tension and shear in view of connecting elements and load introduction into the column web panel.
- Component characterization: Determination of the force-deformation response of each component as a mechanical spring.
- Component assembly: Assembling all the translational springs that can be distributed in series and/or in parallel to obtain the overall response of the joint.
In bolted connections an equivalent T-stub in tension may be used to model the design resistance of the following basic components:
- Column flange in bending.
- End-plate in bending.
- Flange cleat in bending.
- Base plate in bending under tension.
T-stub model for unstiffened plated components was developed by Zoetemeijer [9] and then extended it to some stiffened configuration. Later, Jaspart [10] applied the concept to various plate configurations.
In the case of bolted connection, the resistance of each bolt row depends on the effective length (leff) that guarantees the equivalence with a simple T-Stub connection. The determination of the effective length of the equivalent T-stub is crucial to obtain the correct resistance. Unfortunately, the current version of EN1993:1-8 [7] does not cover the entireall bolt row configuration in the case of bolted end plate joints with hollow members.
Parker et al. [11] developed one dimensional yield line model for connection with bolts on two sides of hollow section, showing six possible failure modes (Fig. 2) given as follows:
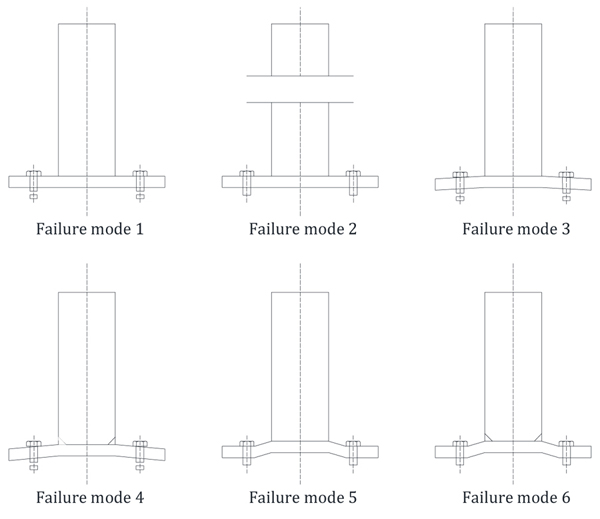
- Failure mode 1: Rupture of the bolts without prying force.
- Failure mode 2: The yielding of the hollow section.
- Failure mode 3: The failure due to the combination of bolt fracture and plastic hinge formation in the flanges at the weld.
- Failure mode 4: A more general version of mechanism 3, whereby the flange plate plastic hinge is permitted to form within the tube.
- Failure mode 5: The mechanism due to the combination of the flange-plate failure and flange-plate bent in double curvature without bolt failure.
- Failure mode 6: The mechanism due to the flange-plate failure, flange-plate bent in double curvature, inner plastic hinge within the hollow section.
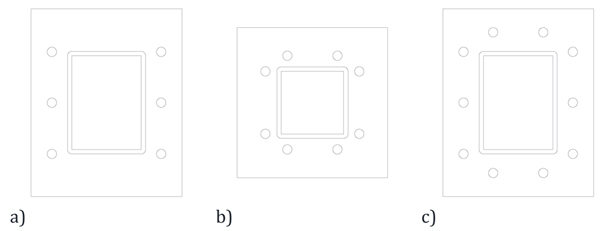
In order to assess the accuracy of the available analytical methods described in the previous Section, the theoretical prediction hashave been verified against some test data on different connection configurations as given by Packer et al. [1], Willibald [4] and Kato and Mukai [12]. In order to univocally identify the type of connection geometry, the following labelling code was used:
- C1 for specimens with two side bolts (4\6 bolts), shown in Fig. (3a).
- C2 for specimens with four side bolts (8 bolts), shown in Fig. (3b).
- C3 for specimens with four side bolts (10 bolts), shown in Fig. (3c).
C1 configuration C2 configuration C3 configuration
2.2. C1 Configuration
Bolted connections of tubular members with bolts located only on two sides generally behave as partial strength. After a series of tests, Packer et al. [1] proposed an idealized bending stress distribution through the thickness of the end-plate, the significant contribution of strain-hardening is incorporated and the resulting flexural capacity is in closer agreement with the actual ultimate plate bending strength. The maximum bending moment capacity for flange plate is:
 |
(1) |
Where:
 |
(2) |
fyp: Yield strength of the end-plate.
fup: Ultimate tensile strength of the end-plate.
Four different approaches were adopted to compute the ultimate resistance and the corresponding failure mode of the specimens tested by Packer et al. [1]:
- Approach 1: The failure modes 4 and 6 postulated in [11] were added to the typical failure modes of EC3 [7].
In order to compute the bending strengths of mode 1 and 2 of EC3 (i.e. Mpl,1 and Mpl,2), the hardened stress fp
was used.
- Approach 2: To compute Mpl,1 was applied method 2 from EC3-8 table 6.2 and hardened stress fp for Mpl,2.
- Approach 3: To take into account the possibility of a plastic hinge inside the wall tube, the value “m” is computed as the distance between the half hollow section thickness and the bolt center (i.e. m = ex + t/2).
- Approach 4: The ultimate tensile stress fup was applied to compute Mpl,1 and the hardened stress fp for Mpl,2.
The comparison between the theoretical approaches and the experimental results are reported in Table 1. As it can be observed, the approach 3 is the most accurate one, giving calculated resistances closest to the experimental values. The cases with larger differences are those characterized by axial yielding of the walls of tubular member constituting the web of the L-stub. The resistance of this failure mode is not accounted for in these four methods.
| Test | Approach 1 | Approach 2 | Approach 3 | Approach 4 | |||||
|---|---|---|---|---|---|---|---|---|---|
| Specimen | Nu,exp | Nu,th,1 | Ratio | Nu,th,2 | Ratio | Nu,th,3 | Ratio | Nu,th,4 | Ratio |
| [-] | [kN] | [kN] | [–] | [kN] | [–] | [kN] | [–] | [kN] | [–] |
| C1-1 | 443 | 398 | 1.11 | 473 | 0.94 | 419 | 1.06 | 473 | 0.94 |
| C1-2 | 350 | 184 | 1.90 | 376 | 0.93 | 229 | 1.53 | 327 | 1.07 |
| C1-3 | 622 | 594 | 1.05 | 736 | 0.85 | 656 | 0.95 | 736 | 0.85 |
| C1-4 | 793 | 775 | 1.02 | 930 | 0.85 | 843 | 0.94 | 931 | 0.85 |
| C1-5 | 860 | 855 | 1.01 | 1077 | 0.80 | 952 | 0.90 | 1077 | 0.80 |
| C1-6 | 955 | 942 | 1.01 | 1149 | 0.83 | 1093 | 0.87 | 1149 | 0.83 |
| C1-7 | 971 | 969 | 1.00 | 1149 | 0.85 | 1114 | 0.87 | 1149 | 0.85 |
| C1-8 | 974 | 1000 | 0.97 | 1149 | 0.85 | 1125 | 0.87 | 1149 | 0.85 |
| C1-9 | 795 | 811 | 0.98 | 834 | 0.95 | 834 | 0.95 | 834 | 0.95 |
| C1-10 | 795 | 813 | 0.98 | 840 | 0.95 | 840 | 0.95 | 840 | 0.95 |
| C1-11 | 1122 | 1069 | 1.05 | 1149 | 0.98 | 1149 | 0.98 | 1149 | 0.98 |
| C1-12 | 1080 | 1040 | 1.04 | 1149 | 0.94 | 1149 | 0.94 | 1149 | 0.94 |
| C1-13 | 931 | 561 | 1.66 | 1149 | 0.81 | 749 | 1.24 | 1149 | 0.81 |
| C1-14 | 490 | 356 | 1.38 | 610 | 0.80 | 443 | 1.11 | 610 | 0.80 |
| C1-15 | 680 | 655 | 1.04 | 804 | 0.85 | 698 | 0.97 | 804 | 0.85 |
| C1-16 | 1164 | 1087 | 1.07 | 1149 | 1.01 | 1149 | 1.01 | 1149 | 1.01 |
| Average value | 1.10 | 0.88 | 0.99 | 0.89 | |||||
| Standard deviation | 0.26 | 0.07 | 0.16 | 0.08 | |||||
2.3. C2 and C3 Configurations
The configurations with four-side bolted splices were tested by [4, 12]. Based on Willibald model [14], Steige and Weynand [5] proposed an equation for the effective length, which is used here to calculate an effective length for the corner bolts. Setting this design resistance equal to the resistance of a half T-stub produces the estimated effective length in Eq. (3), as follows:
 |
(3) |
This equation is not practical for hand calculation. The effective length can be simplified with the following equation proposed by Couchaux [13]:
 |
(4) |
With
 |
(5) |
| Approach | Non-circular Patterns | Circular Patterns |
|---|---|---|
| 2 | leff,i+2.m+0.625?ei leff,i+0.5pi 2?m+0.625?ei+ei,s ei,x+0.5?pi 4?m+1.25?ei 2?m+0.625?ei+0.5?pi |
π?m+2?e1,s 2?π?mπ?m+pi e1,s+pi |
| 3 | 2?m+0.625?ei+pi/2 m+ei?k+0.5?pi+g/2 |
2?π?m π?m+pi |
| with i=1,2 | ||
| Test | Approach 1 | Approach 2 | Approach 3 | |||||
|---|---|---|---|---|---|---|---|---|
| Author | Specimen | Nu,exp | Nu,th,1 | Ratio | Nu,th,2 | Ratio | Nu,th,3 | Ratio |
| [-] | [-] | [kN] | [kN] | [-] | [kN] | [-] | [kN] | [-] |
| Willibald | C2-1 | 1108 | 1282 | 0.86 | 1140 | 0.97 | 1255 | 0.88 |
| C2-2 | 1162 | 1214 | 0.96 | 1214 | 0.96 | 1214 | 0.96 | |
| C2-3 | 1240 | 1282 | 0.97 | 994 | 1.25 | 1116 | 1.11 | |
| C2-4 | 1190 | 1214 | 0.98 | 1112 | 1.07 | 1214 | 0.98 | |
| C2-5 | 903 | 1103 | 0.82 | 838 | 1.08 | 918 | 0.98 | |
| C2-6 | 946 | 851 | 1.11 | 654 | 1.45 | 835 | 1.13 | |
| C2-7 | 843 | 726 | 1.16 | 763 | 1.1 | 864 | 0.98 | |
| C2-8 | 946 | 1074 | 0.88 | 845 | 1.12 | 987 | 0.96 | |
| C2-9 | 881 | 745 | 1.18 | 484 | 1.82 | 751 | 1.17 | |
| C2-10 | 1019 | 1074 | 0.95 | 747 | 1.36 | 871 | 1.17 | |
| C3-1 | 1030 | 1072 | 0.96 | 712 | 1.45 | 876 | 1.18 | |
| C3-2 | 1153 | 1409 | 0.82 | 855 | 1.35 | 1014 | 1.14 | |
| C3-3 | 1105 | 1116 | 0.99 | 850 | 1.3 | 931 | 1.19 | |
| C3-4 | 1240 | 1409 | 0.88 | 938 | 1.32 | 1072 | 1.16 | |
| Kato | C2-11 | 1039 | 643 | 1.62 | 639 | 1.63 | 632 | 1.65 |
| C2-12 | 1173 | 996 | 1.18 | 969 | 1.21 | 965 | 1.22 | |
| C2-13 | 1334 | 1368 | 0.98 | 1134 | 1.18 | 1129 | 1.18 | |
| C2-14 | 1275 | 1296 | 0.98 | 1185 | 1.08 | 1179 | 1.08 | |
| C2-15 | 1338 | 1344 | 1 | 1344 | 1 | 1344 | 1 | |
| C2-16 | 630 | 219 | 2.87 | 218 | 2.89 | 215 | 2.92 | |
| C2-17 | 1198 | 510 | 2.35 | 507 | 2.36 | 501 | 2.39 | |
| C2-18 | 1632 | 1259 | 1.3 | 1251 | 1.31 | 1236 | 1.32 | |
| C2-19 | 1847 | 1673 | 1.1 | 1465 | 1.26 | 1509 | 1.22 | |
| C2-20 | 1961 | 2072 | 0.95 | 1465 | 1.34 | 1567 | 1.25 | |
| C2-21 | 1961 | 2096 | 0.94 | 1465 | 1.34 | 1771 | 1.11 | |
| Average value | 1.05 | 1.28 | 1.17 | |||||
| Standard deviation | 0.48 | 0.43 | 0.46 | |||||
Three different approaches to calculate the connection resistance were adopted, namely:
- Approach 1: Two-dimensional yielding line procedure proposed by Willibald [4].
- Approach 2: Eurocode procedure adding the formulation of leff, i proposed by Steige and Weynand [5].
- Approach 3: Eurocode procedure adding the formulation of leff, nc proposed by Couchaux [13]. The effective lengths adopted for the approaches 2 and 3 are reported in the Table 2.
The comparison between these analytical predictions and the experimental data is reported in Table 3. As it can be observed, all methods overestimate the experimental resistance and approaches 2 and 3 lead to very similar results, but the method 3 is simpler to be use.
3. NUMERICAL MODELING
3.1. Investigated Joints
The geometrical features of the connections are reported in Table 4 and shown in Fig. (4). All connections have the same hollow sections 152×152×9.4 mm. It should be noted that connections from C2-1 to C2-7 were extracted from uniaxial tensile tests carried out by Willibald [4]. In the other joints, the thickness of the end-plate, the type of welds and two positions of corner bolts (i.e. designated as c1 and c2) were varied.
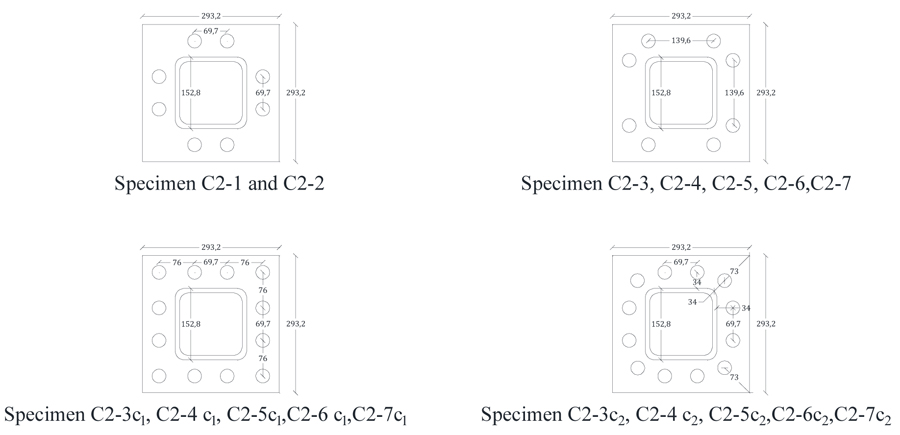
| Label [-] |
tp [mm] |
Weld Throat a [mm] |
nb [-] |
e [mm] |
ex [mm] |
es [mm] |
p [mm] |
|---|---|---|---|---|---|---|---|
| C2-1 | 16 | 11.74 | 8 | 35.7 | 34.6 | 76.8 | 139.6 |
| C2-2 | 20 | 12.02 | 8 | 35.7 | 34.6 | 76.8 | 139.6 |
| C2-3 | 16 | 11.38 | 8 | 35.7 | 34.6 | 111.75 | 69.7 |
| C2-4 | 20 | 12.09 | 8 | 35.7 | 34.6 | 111.75 | 69.7 |
| C2-5 | 25 | 12.09 | 8 | 35.7 | 34.6 | 111.75 | 69.7 |
| C2-6 | 12 | 12.09 | 8 | 35.7 | 34.6 | 111.75 | 69.7 |
| C2-7 | 10 | 12.09 | 8 | 35.7 | 34.6 | 111.75 | 69.7 |
| C2-3c1 | 16 | 11.38 | 12 | 35.7 | 34.6 | 111.75 | 69.7 |
| C2-4c1 | 20 | 12.09 | 12 | 35.7 | 34.6 | 111.75 | 69.7 |
| C2-5c1 | 25 | 12.09 | 12 | 35.7 | 34.6 | 111.75 | 69.7 |
| C2-6c1 | 12 | 12.09 | 12 | 35.7 | 34.6 | 111.75 | 69.7 |
| C2-7c1 | 10 | 12.09 | 12 | 35.7 | 34.6 | 111.75 | 69.7 |
| C2-3c2 | 16 | 11.38 | 12 | 35.7 | 34.6 | 111.75 | 69.7 |
| C2-4c2 | 20 | 12.09 | 12 | 35.7 | 34.6 | 111.75 | 69.7 |
| C2-5c2 | 25 | 12.09 | 12 | 35.7 | 34.6 | 111.75 | 69.7 |
| C2-6c2 | 12 | 12.09 | 12 | 35.7 | 34.6 | 111.75 | 69.7 |
| C2-7c2 | 10 | 12.09 | 12 | 35.7 | 34.6 | 111.75 | 69.7 |
3.2. Modelling Assumptions
The finite element models were carried out in Abaqus 6.14 [15]. Due to the geometry and loading symmetry of the specimen, the geometry of ¼ of the connection was modelled in order to reduce the computational time toat the minimum.
The material properties are consistent with those given by [4]. The plastic hardening was simulated using both nonlinear kinematic and isotropic hardening law.
The tubular member, the end-plate, the bolts and welds were modelled using C3D8R (i.e. an 8-node linear brick, reduced integration, hourglass control) solid finite elements.
The model is completed by a rigid 3D planar shell part interacting with the end-plate. The interaction between the steel surfaces in contact was modelled introducing the contact interaction that allows accounting for the interaction between surfaces characterized by friction sliding with Coulomb friction coefficient equal to 0.3, while “Hard contact” was selected to characterize the normal behaviour.
The bolts used in this numerical model are grade 8.8 M16. The hexagonal head of the bolts was modelled and the pre-tensioning was disregarded. The tensile plastic behaviour of the bolts was modelled similarly as reported in [16, 17] for HR bolts.
3.3. Validation of Numerical Models Against Experimental Results
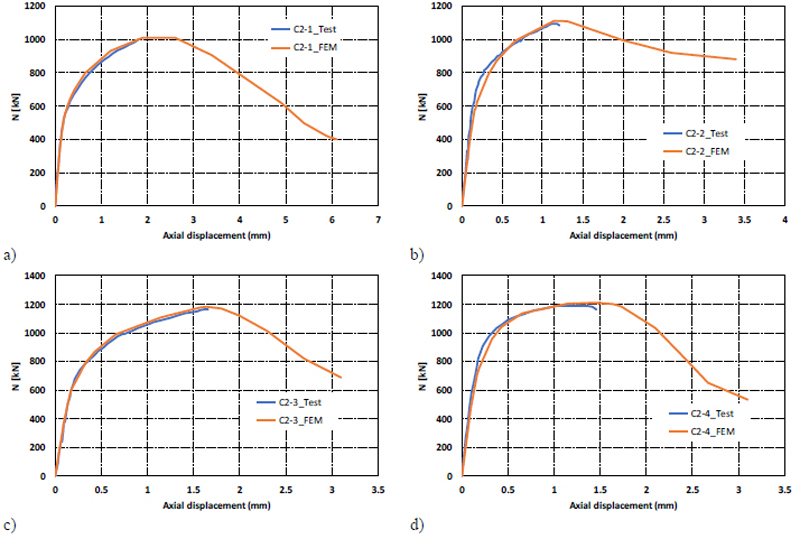
To validate the numerical modeling, four specimens of the experimental program carried out by Willibald [4] have been modeled. The predicted resistances of the FEM-models are compared to the results of the tensile tests in Fig. (5), where it can be recognized the good agreement between the experimental response curves and the corresponding finite element simulations can be recognized. Indeed the mean ratio between the test strength Nux over the numerical resistance Nu,FEM is equal to 1.02 and coefficient of variation is equal to 3.4%.
3.3. Numerical Results
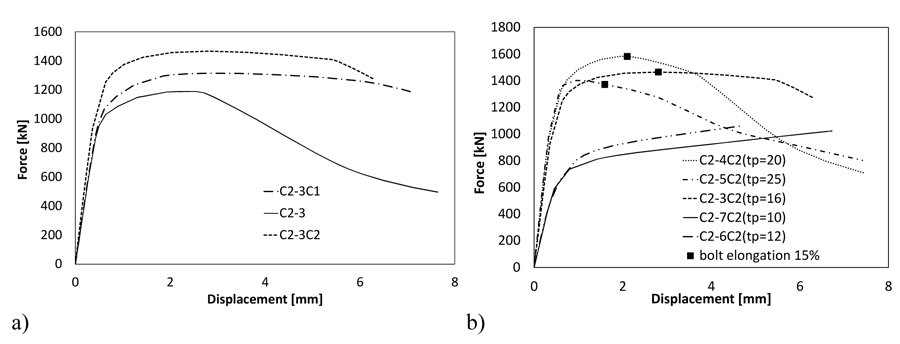
Fig. (6) shows the comparison between the tension response curves of C2-3, C2-3c1 and C2-3c2. As expected the later connection is characterized by the larger resistance since the corner bolts are closer to the tubular profile. Fig. (6) shows the comparison of connection response varying the thickness of the end-plate. The connections with thinner end-plate (i.e. tp = 10 - 12 mm) are characterized by mode 5 (Fig. 2) with very ductile failure response curves. The cases with thicker end-plate (i.e. tp = 16-20-25 mm) exhibit less ductility due to the activation of bolt failure in mode 3 and 4 (Fig. 2).
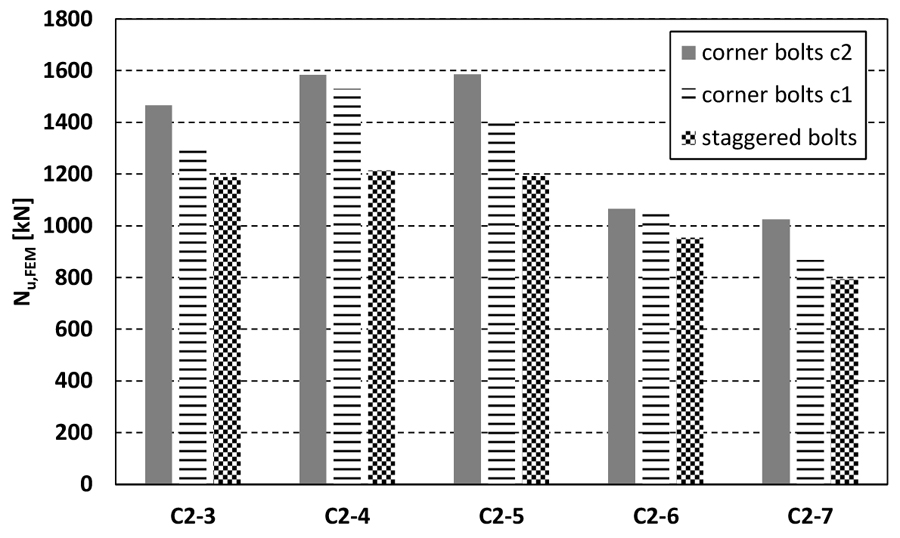
The tension resistances for all the models are reported in Fig. (7), where it can be easily recognized the crucial role of corner bolts can be easily recognized. Indeed, the connections with corner bolts exhibit larger resistance that increases when the bolts are closer to the corner of the tubular member (i.e. the configuration C2). However, reducing the distance ex (Fig. 1) between the bolt and the wall of the tubular section can affect the splice ductility. In so doing, three different types of failure mode can occur, namely i) the failure of the bolts, ii) the failure of fillet welds, and iii) the yielding of the walls of the tubular member. The first two are brittle mechanisms that should be avoided.
4. CONCLUSIVE REMARKS AND FURTHER DEVELOPMENTS
In the light of the results obtained from both analytical and finite element models presented and discussed in this paper, the following remarks can be drawn:
- To estimate the tension resistance of connections with bolt configuration C1 (i.e. bolts located on two opposite side of the splice) it needs to account for the tensile resistance of the walls of the tubular members constituting the web of the equivalent L-Stub.
- The method proposed by Steige and Weynand [5] to calculate the tension resistance of connections with C2 and C3 bolt configurations (i.e. bolts distributed on all sides of the splice) is consistent with EN 1993-1-8 and it is very versatile. The disadvantage of this procedure is in the complexity of the formula used to derive the effective length in the case of corner bolts. The simplified formula proposed by Couchaux [13] has similar accuracy, thus resulting more effective for practical applications.
- The finite element simulations showed that the corner bolts can increase the resistance of the connection. In addition, the bolt layout can be optimizsed by placing the bolts as close to the hollow section as possible.
CONSENT FOR PUBLICATION
Not applicable.
CONFLICT OF INTEREST
The authors declare no conflict of interest, financial or otherwise.
ACKNOWLEDGMENTS
The research leading to these results was carried out in the framework of Erasmus+ mobility project. This is the work of a partnership between INSA Rennes and University of Naples “Federico II”.


